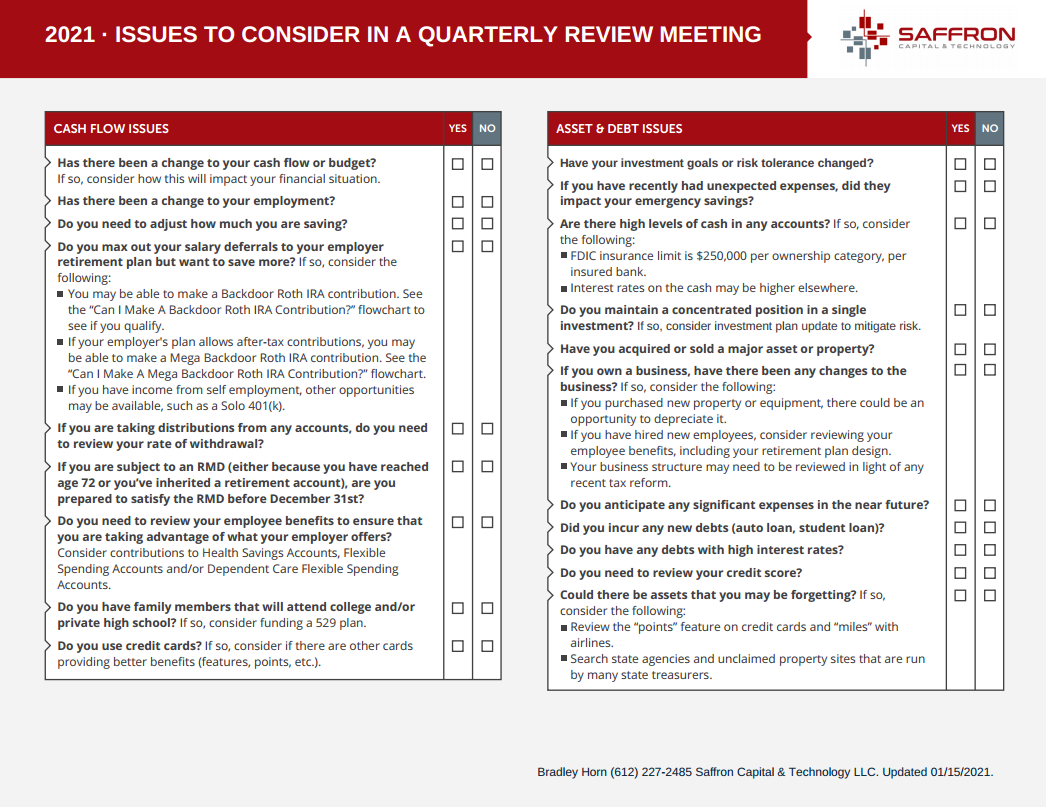
Issues to Consider in a Quarterly Review Meeting
July 8, 2021
The Sustainability of Social Security
September 2, 2021
Benchmark Selection for Investment Portfolios
Introduction
Benchmarking is the process of comparing your investment portfolio to a market index. Investors should carefully assess benchmark selection. This is especially important for multi-asset portfolios subject to periodic rebalancing and cash distributions. A well-chosen benchmark is like a compass that can quickly tell an investor when he or she is off course.
What is a Benchmark?
Common portfolio benchmarks include headline indexes, like the S&P 500 index and the NASDAQ 100 index. There are also benchmarks for narrow slices of the market, like healthcare technology stocks. Moreover, you can use a benchmark composite, which combines two or more benchmarks. Finally, there are ‘horse race benchmarks’, which average the performance of multiple funds or advisors. Regardless of type, all benchmarks are ‘passive’ in nature. They track returns on a buy-and-hold strategy with no active effort to rebalance the portfolio.
The Need for Benchmarking
Benchmarking selection serves many purposes:
- Investment Policy: A good benchmark reflects your investment objectives, time horizon, and risk tolerance.
- Portfolio Construction – Portfolio construction and rebalancing is based on the benchmark portfolio.
- Performance Assessment – Benchmarks provide a reference for advisor performance and confirm if new investments added or subtracted value.
- Cost Management – Finally, good benchmarks provide a lens into whether your portfolio could be cheaper to construct and manage.
A Gold Standard for Benchmarking
The CFA institute supports financial analysts with industry standards. They define a benchmark as “a recognized index, a composite of similar assets or indices, or a peer group of similar funds.” They also qualify good benchmarks as having the following features:
- Public Data : Benchmark construction uses publicly available and historical data,
- Unambiguous: Benchmark securities are clearly defined,
- Priced Daily – The value of the benchmark is priced daily,
- Investable – The benchmark contains securities that you can purchase easily,
- Low Turnover – Benchmark composition is stable over time,
- Risk and Return Profile – The benchmark’s risk and return metrics are readily available.
Benchmark Selection
Selecting a benchmark can be complicated. First, there are many indexes to choose from with lots of overlap from different benchmark providers. Meanwhile, some yardsticks may come up short if liquidity management and retirement distributions is your focus.
Consider the case of an investor who expects to retire in 2025 as depicted in green in the chart below. Her investment portfolio allocates funds among a combination of assets. The portfolio includes equity, bond, and money market securities. The portfolio also combines active risk response to limit downside risk and to preserve capital. The investor’s return and risk profile is compared to a range of benchmark indexes.
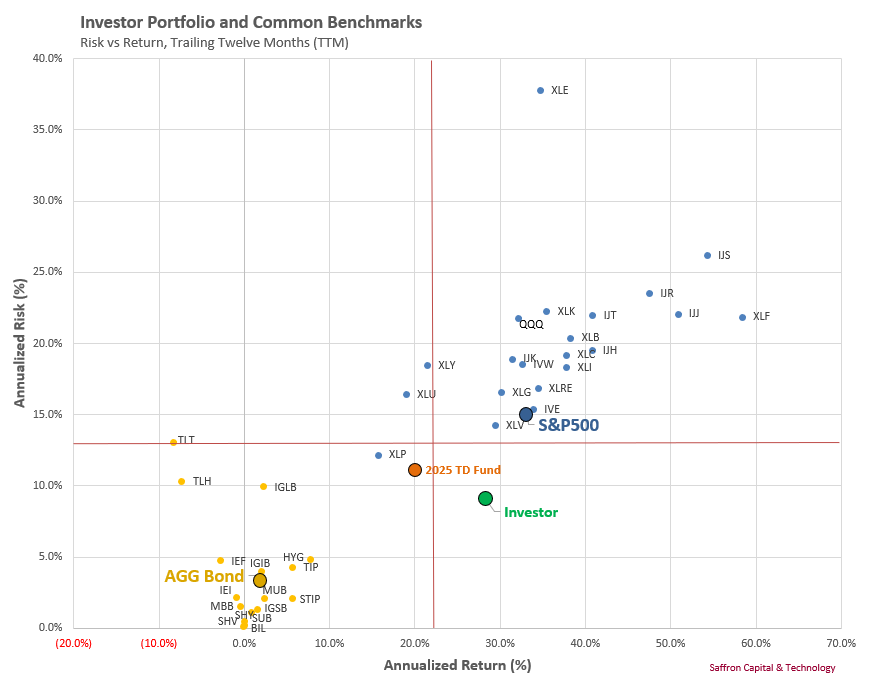
At first glance, there is no benchmark in the bond space (yellow dots) or the equity space (blue dots) that matches the investor portfolio. The S&P 500 index, for example, has a very different asset composition and risk/return profile. The same is true for the Aggregate Bond Index.
In this case, the investor may be a candidate for a peer group benchmark, like the 2025 Target Date Fund. The fund has an asset allocation that is roughly similar. However, the investor’s objectives and investment style are different. In response, a composite benchmark may be more appropriate. The following table and chart shows the investor portfolio versus a set of benchmark portfolios that vary the amount of stocks, bonds and cash by risk appetite.
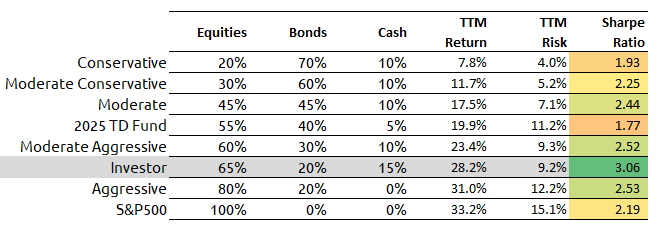
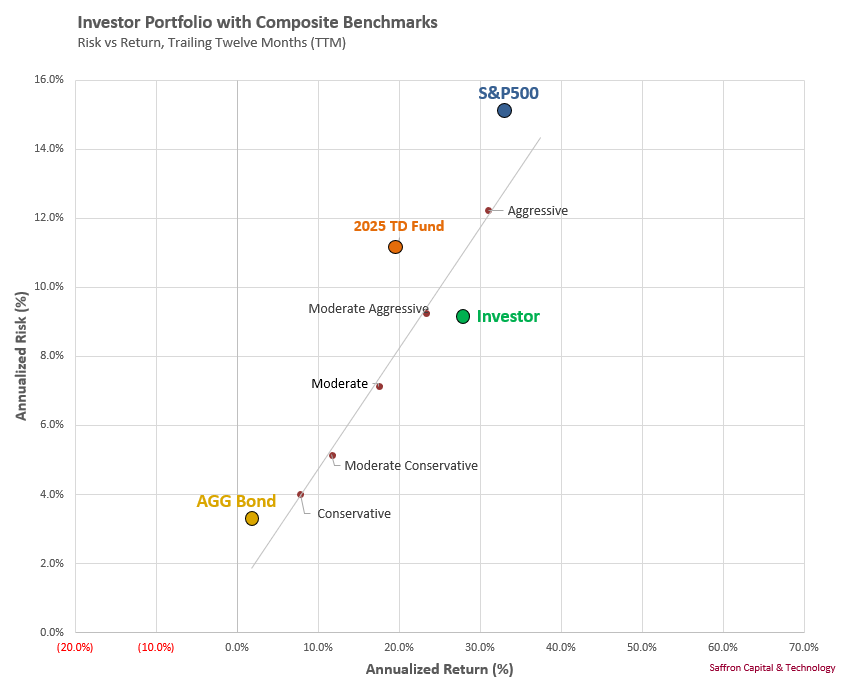
In this case, the portfolio labeled ‘Moderate Aggressive’ best aligns to the client portfolio given the tactical allocation of 60% equities, 30% bonds and 10% cash.
Benchmark Portfolios
Benchmark construction should consider the following:
- Asset Allocation: Most people have diversified, multi-asset portfolios. The composite benchmark should reflect the passive allocation that most closely aligns to the investor’s objectives, risk tolerance and liquidity plan.
- Risk-Adjusted Returns: The Sharpe ratio measures the risk-adjusted return of the investment portfolio and the benchmark portfolio. The ratio defines the return generated per unit of risk and the higher the number, the better. Benchmark selection benefits when aligning Sharpe ratios.
- Other factors: Benchmark selection will also depend on other factors that drive expected return. Ideally, the drivers of value are the same in the investment and benchmark portfolio. Factors might include bond duration, company size, relative price, and market liquidity. These additional factors can help to better align benchmark selection to the investor’s portfolio.
Conclusion
Benchmark selection can enhance your investment experience. It is an integral part of your investment policy and, when identified in advance of any performance period, a good benchmark will facilitate portfolio construction, rebalancing and performance management.

