The third quarter earnings season is well underway. Actual earnings have been reported for 328 of the companies in the S&P 500 index. Specifically, net income for all the reporting companies is 40.4% higher than that reported 12 months ago. The actual growth rate achieved is high absolute terms. Notably, the actual growth rate reported is 10.7% higher than the consensus of all analysts projections reported by FactSet.
Projected Earnings – 4Q.2021
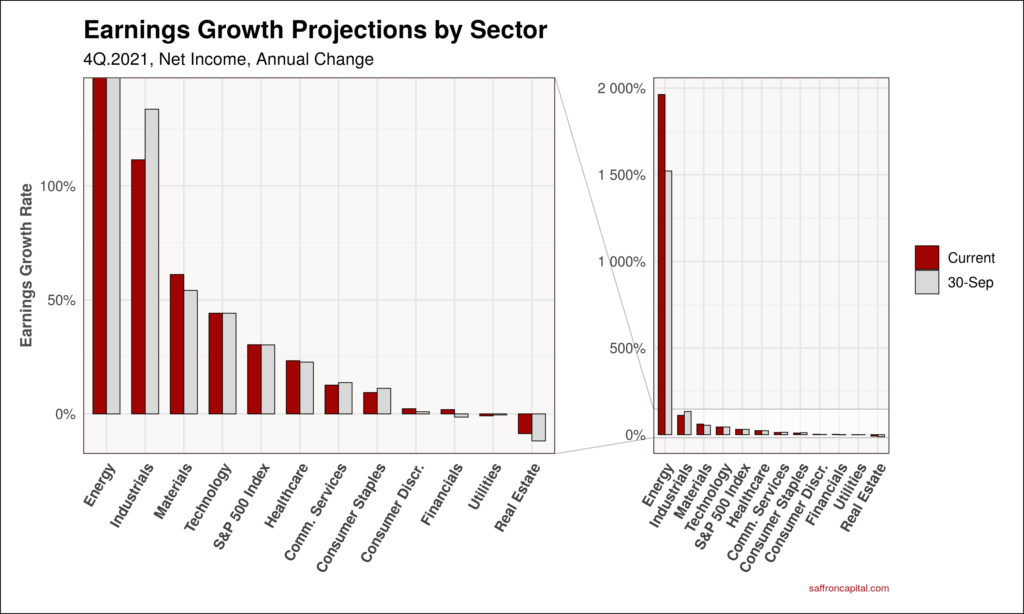
Updates to net income projections for the fourth quarter have been active and significant. Not surprisingly, change is explained by the large amount of actual earnings data spilling in for the 3rd quarter. For example, the chart below shows the most recent growth estimates for the fourth quarter compared to those at the start of the quarter.
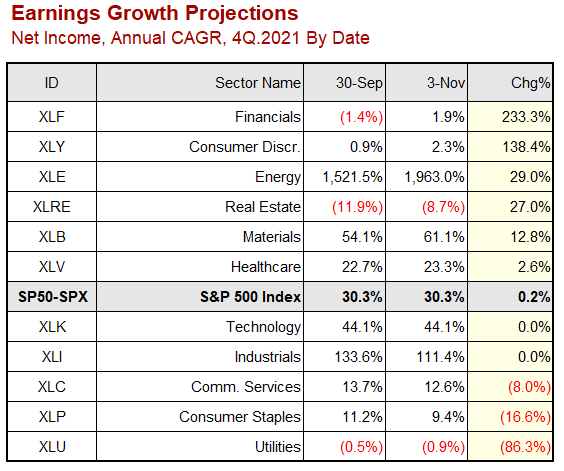
The data table at right shows how much the growth projections have changed by sector since September 30. For example, Financials (XLF), Consumer Discretionary (XLY) and Energy (XLE) sectors had the largest positive changes in projected fourth quarter earnings. In contrast, the Communication Services (XLC), Consumer Staples (XLP) and Utilities (XLU) sectors had the largest negative changes. Above all, the consolidated earnings outlook for the S&P500 index has increased by 61% to 38.2%.
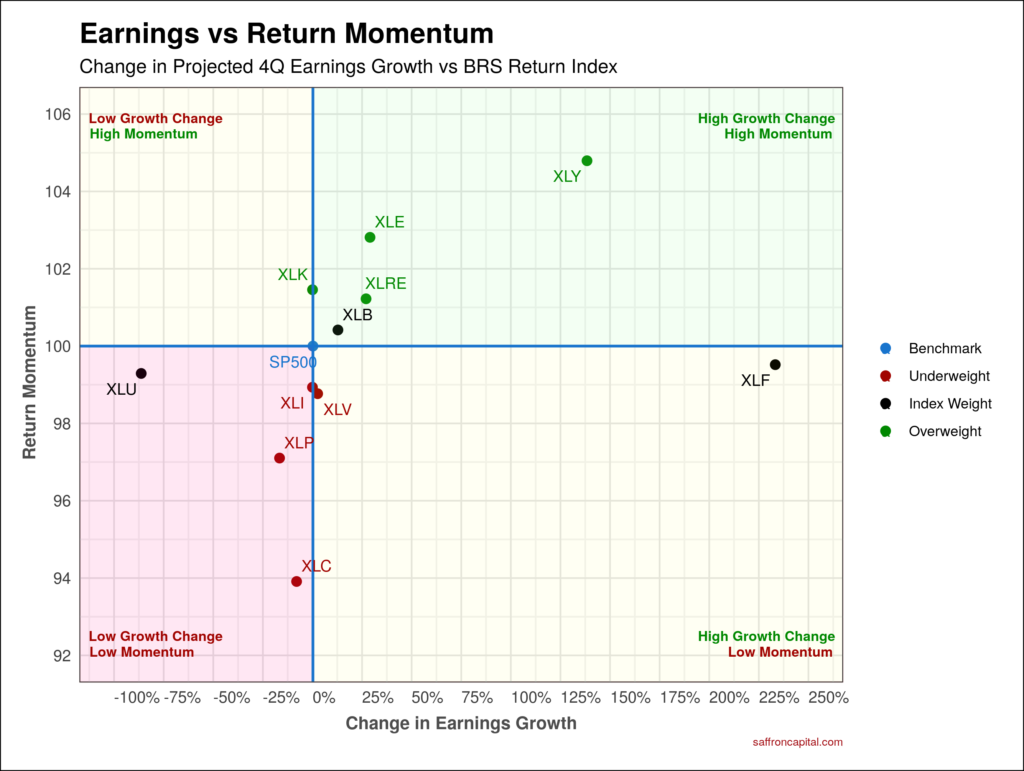
The next chart builds on this data. Specifically, the chart shows how the recent changes in projected earnings growth are related to realized returns by sector. Not surprisingly, we see that sectors with positive changes in consolidated earnings had positive returns over the last 30
days. Conversely, those sectors with large negative changes in consolidated earnings had negative returns. And by comparing sector results to index, we define clusters to characterize which sectors to potentially overweight and which to potentially underweight in tactical portfolio allocations.
Using 4Q Earnings Projection To Assess Value
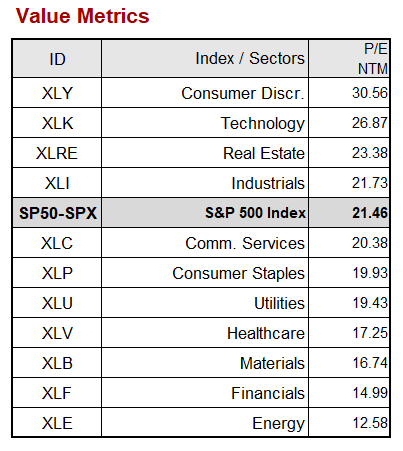
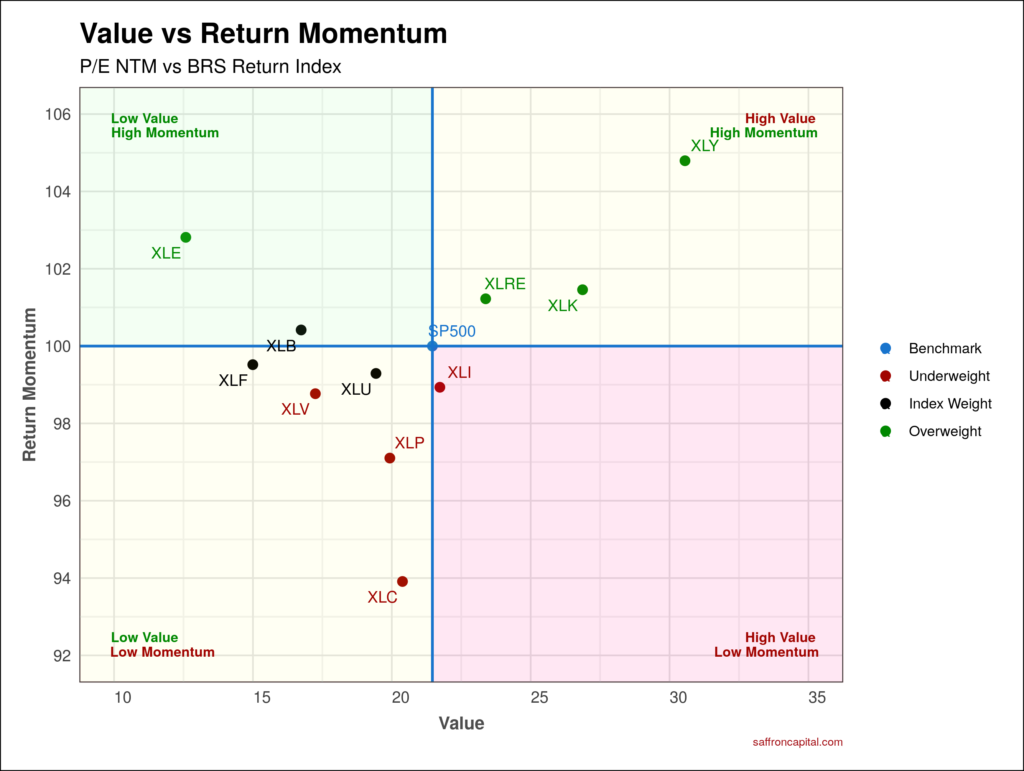
Finally, projected net income by company can be consolidated to assess the relative value of different market sectors. For example, the price/earnings (P/E) ratio is one of several metrics used to assess the relative value of different market sectors.
The table at left lists the P/E ratio for each sector based on earnings projections for the next twelve months (NTM). You can quickly see that 4 of 11 sectors have P/E ratios or relative values higher than index, while 7 sectors have discounted P/E values to index.
The next chart shows how forward-looking P/Es relate to realized returns by sector. The chart shows that several sectors [Consumer Discretionary (XLY), Technology (XLK), and Real Estate (XLRE)] have strong return momentum, but are also well bid and have high relative values versus benchmark. Only the Energy (XLE) sector offers low relative value and high return momentum. Finally, we see that the Industrials (XLI) sector can be classified as having both high value and low return momentum.
See the Signals
If you enjoyed this brief and want more content like this, then please take a moment to subscribe to my Weekly Insight Report at no cost. The link for the free trial is here.
I’d like to hear from you. Have comments or questions regarding this post? Please feel free to contact me here.


