March returns across markets were extraordinary for their speed and scale. Returns across the asset classes were again dominated by events in Ukraine. Equity markets world-wide were up with only a few exceptions in the emerging markets. The market risk regime shifted mid-month and favored favored investments in risky assets versus cash. Growth outperformed value, consumer cyclicals beat defensive stocks, and large cap topped small stocks. Fixed income assets suffered significant monthly losses. However, infrastructure project bonds outperformed equities, as did most commodities. The following analysis provides a visual record of returns across and within the major asset classes.
US Equities
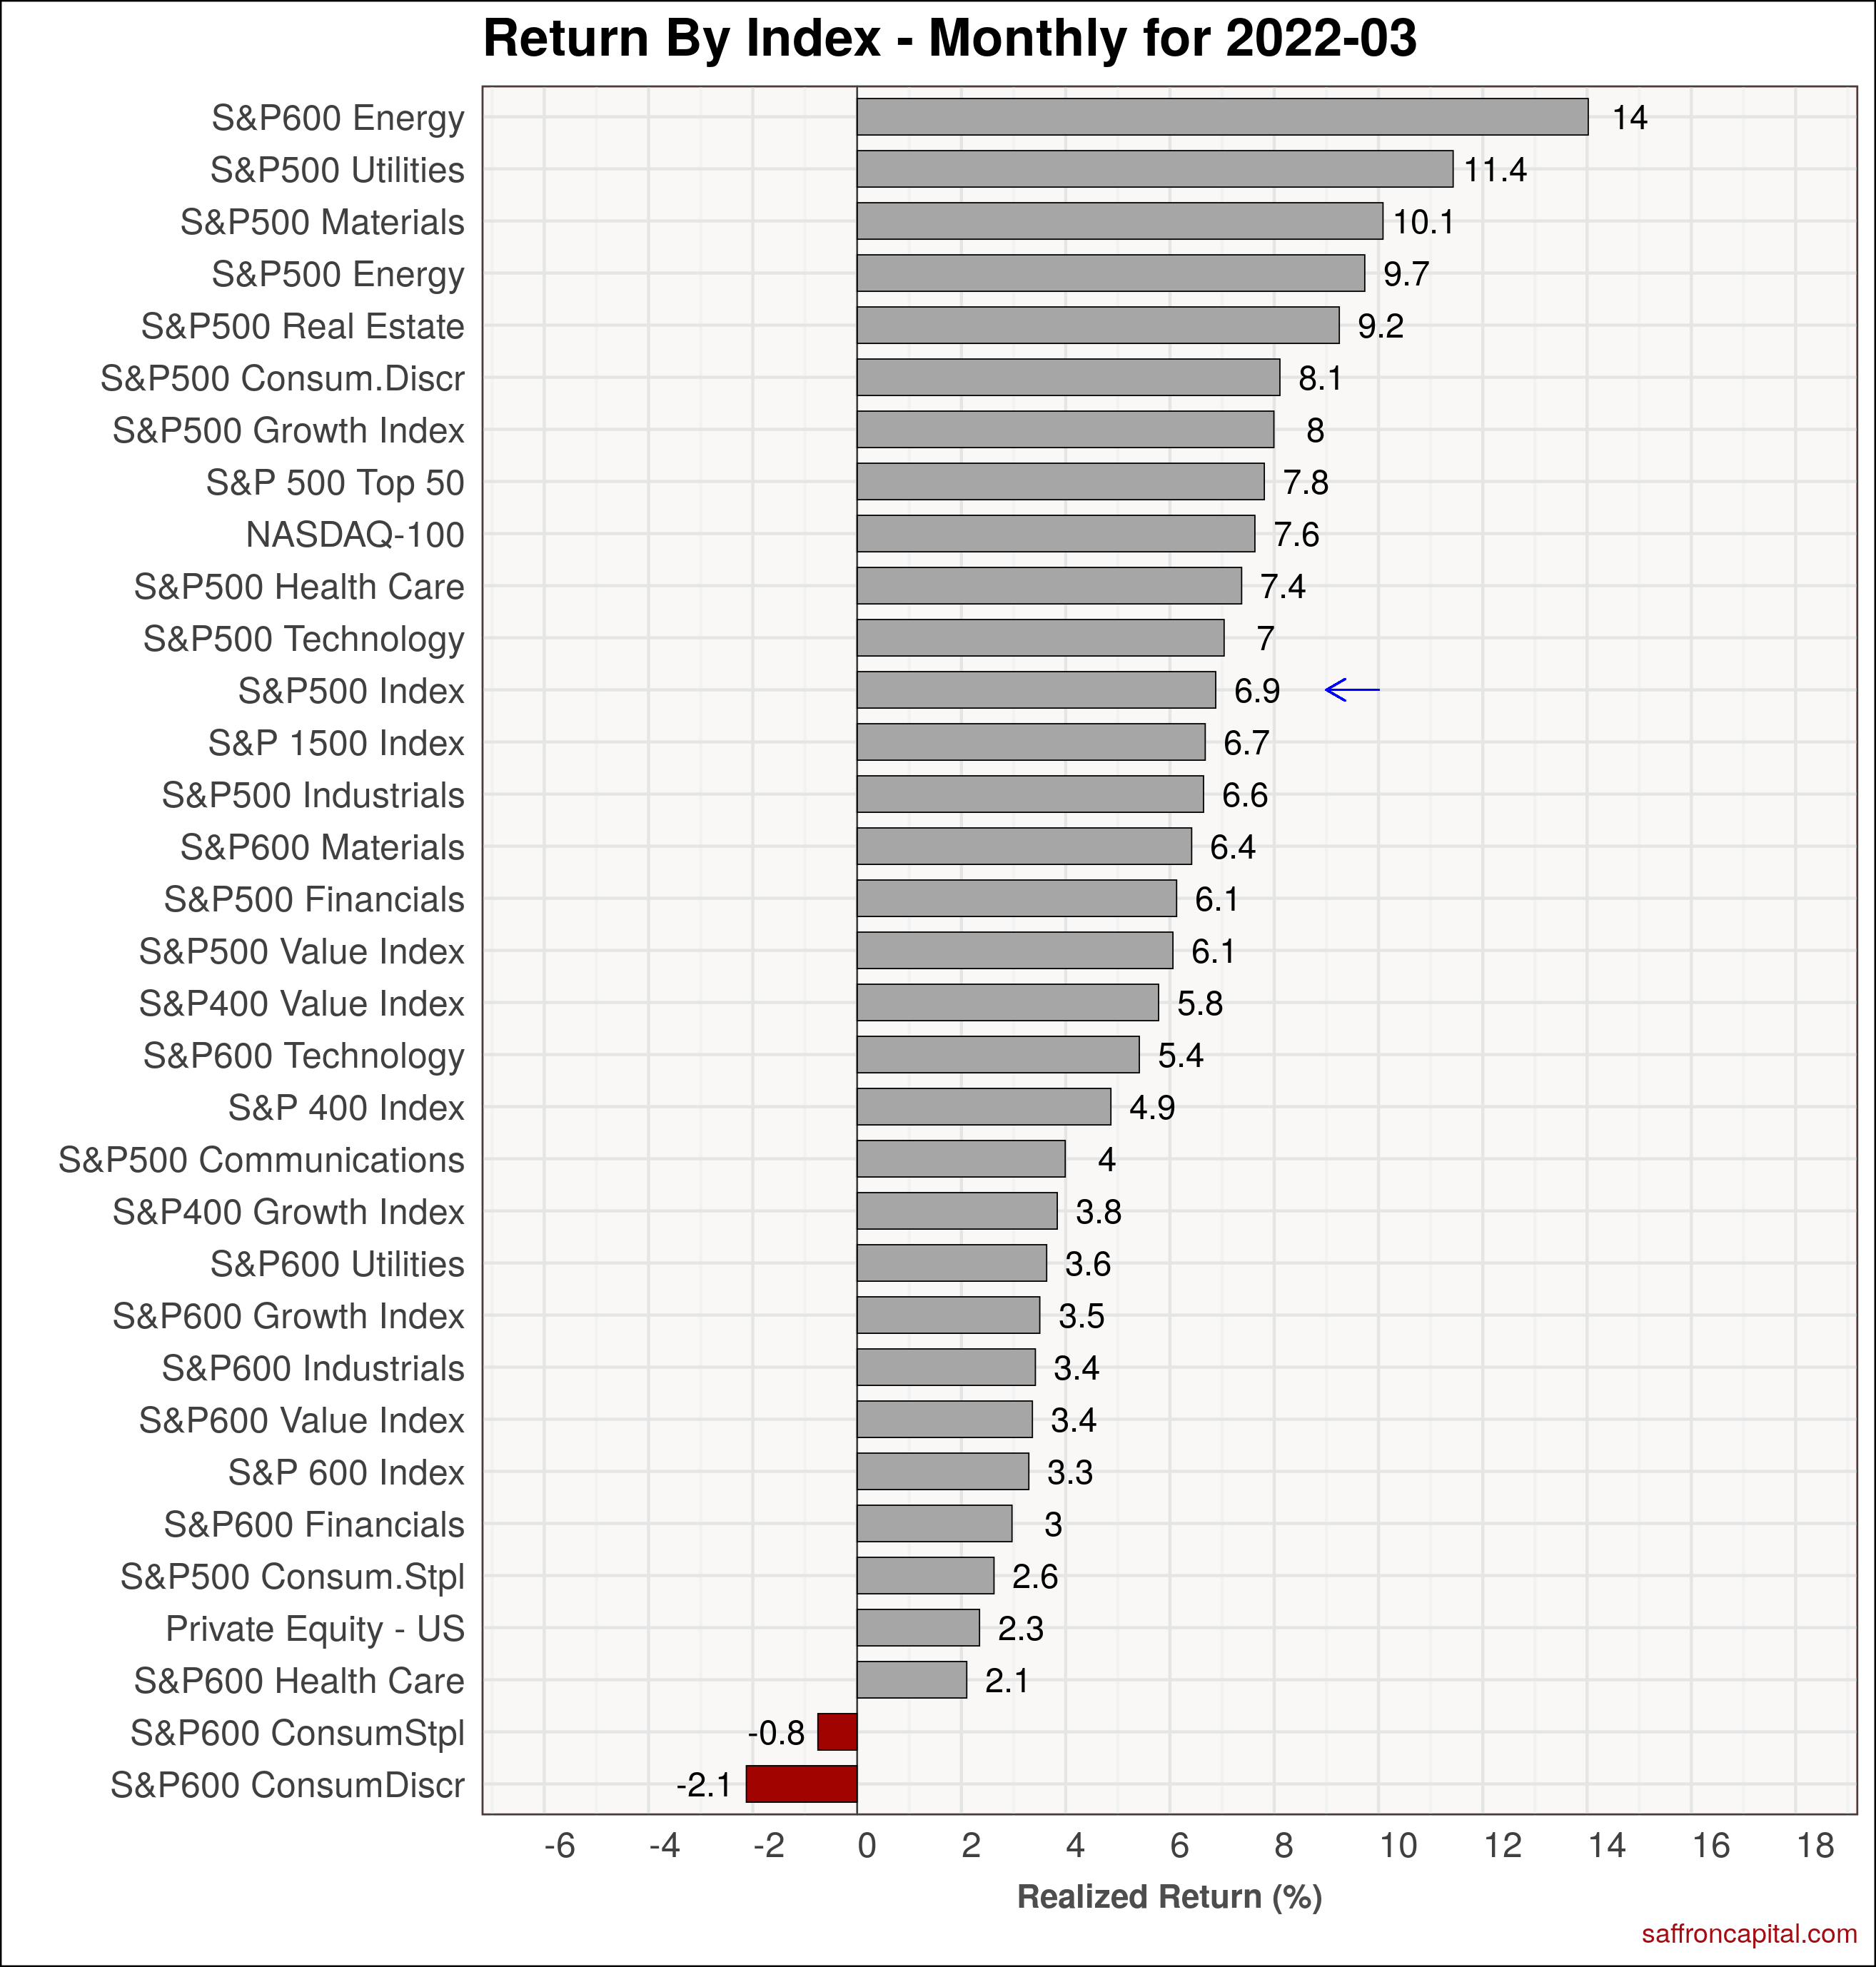
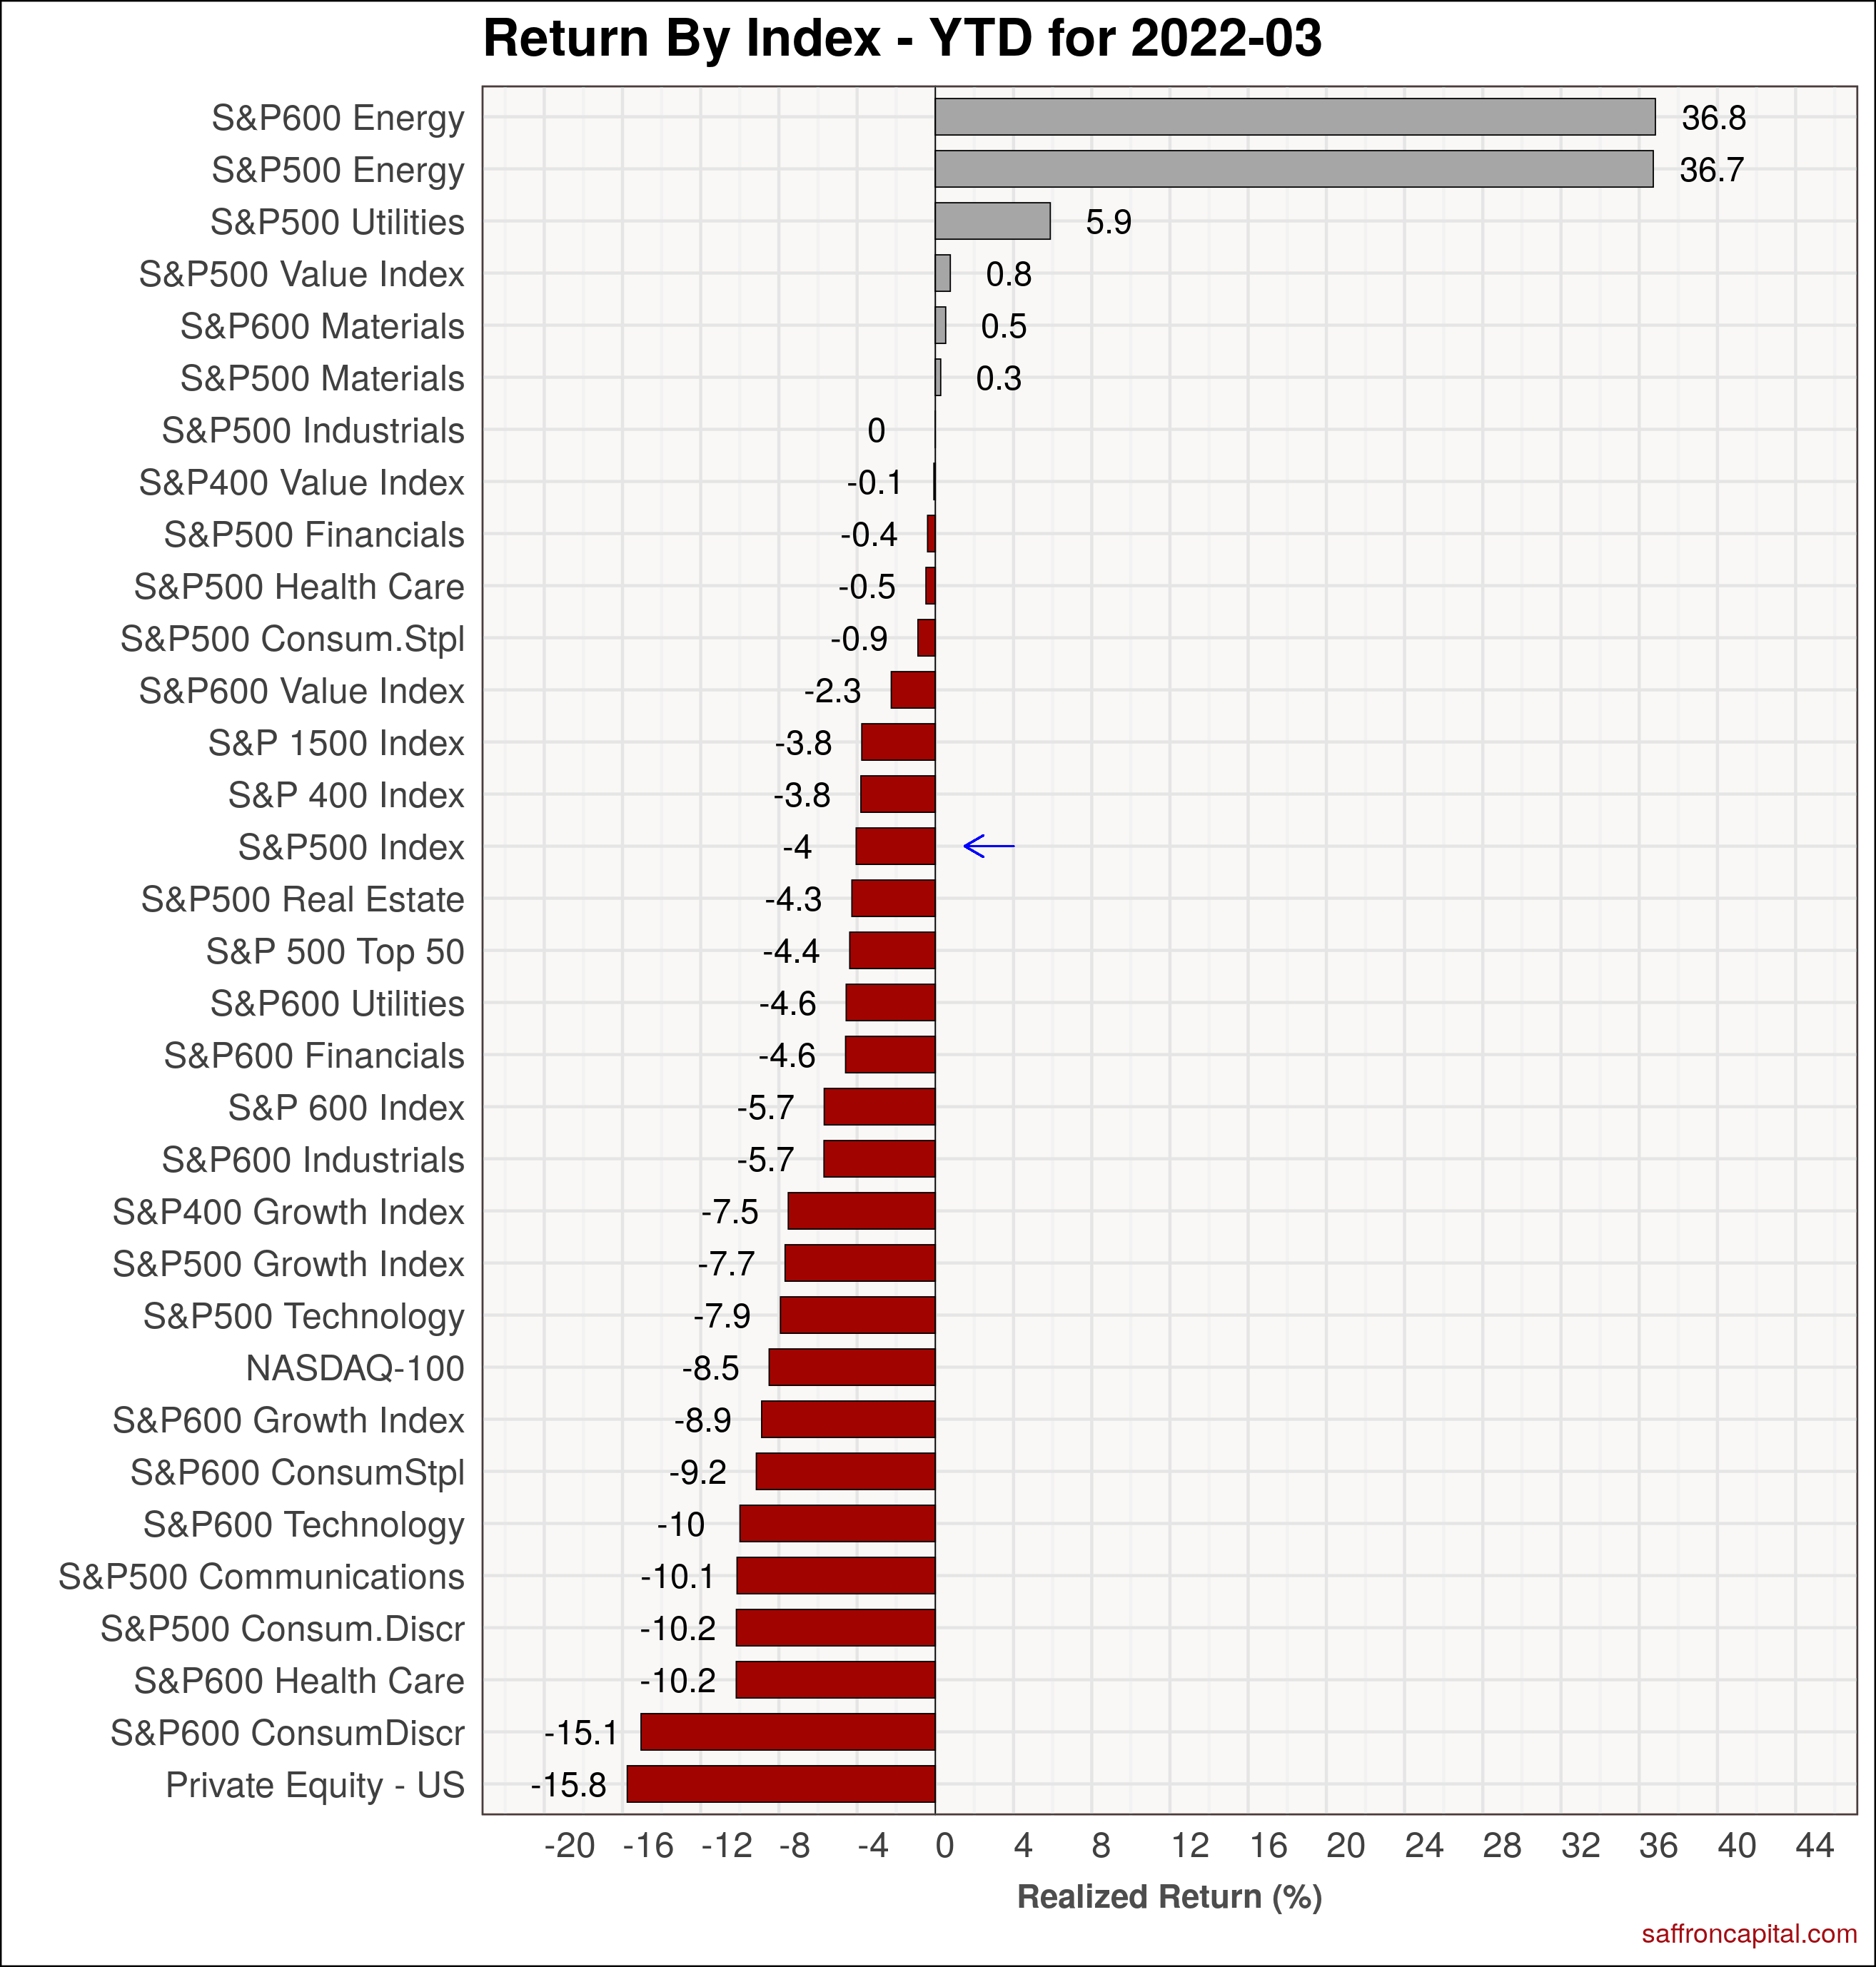
The total return for the The S&P 500 index, including dividends, was 6.9%. Strength was seen in small cap energy (+14.0%), utilities (+11.4%), materials (+10.1%), large cap energy (+9.7%) and real estate (+9.2%). On a year-to-date (YTD) basis, energy shares (+36.7%) easily dominated of the S&P 500 index (+0.8%) with the majority of sectors posting negative returns. The hardest hit sectors included private equity (-15.8%) and consumer discretionary (-16.2%) stocks.
Click to enlarge
Developed Market Equities
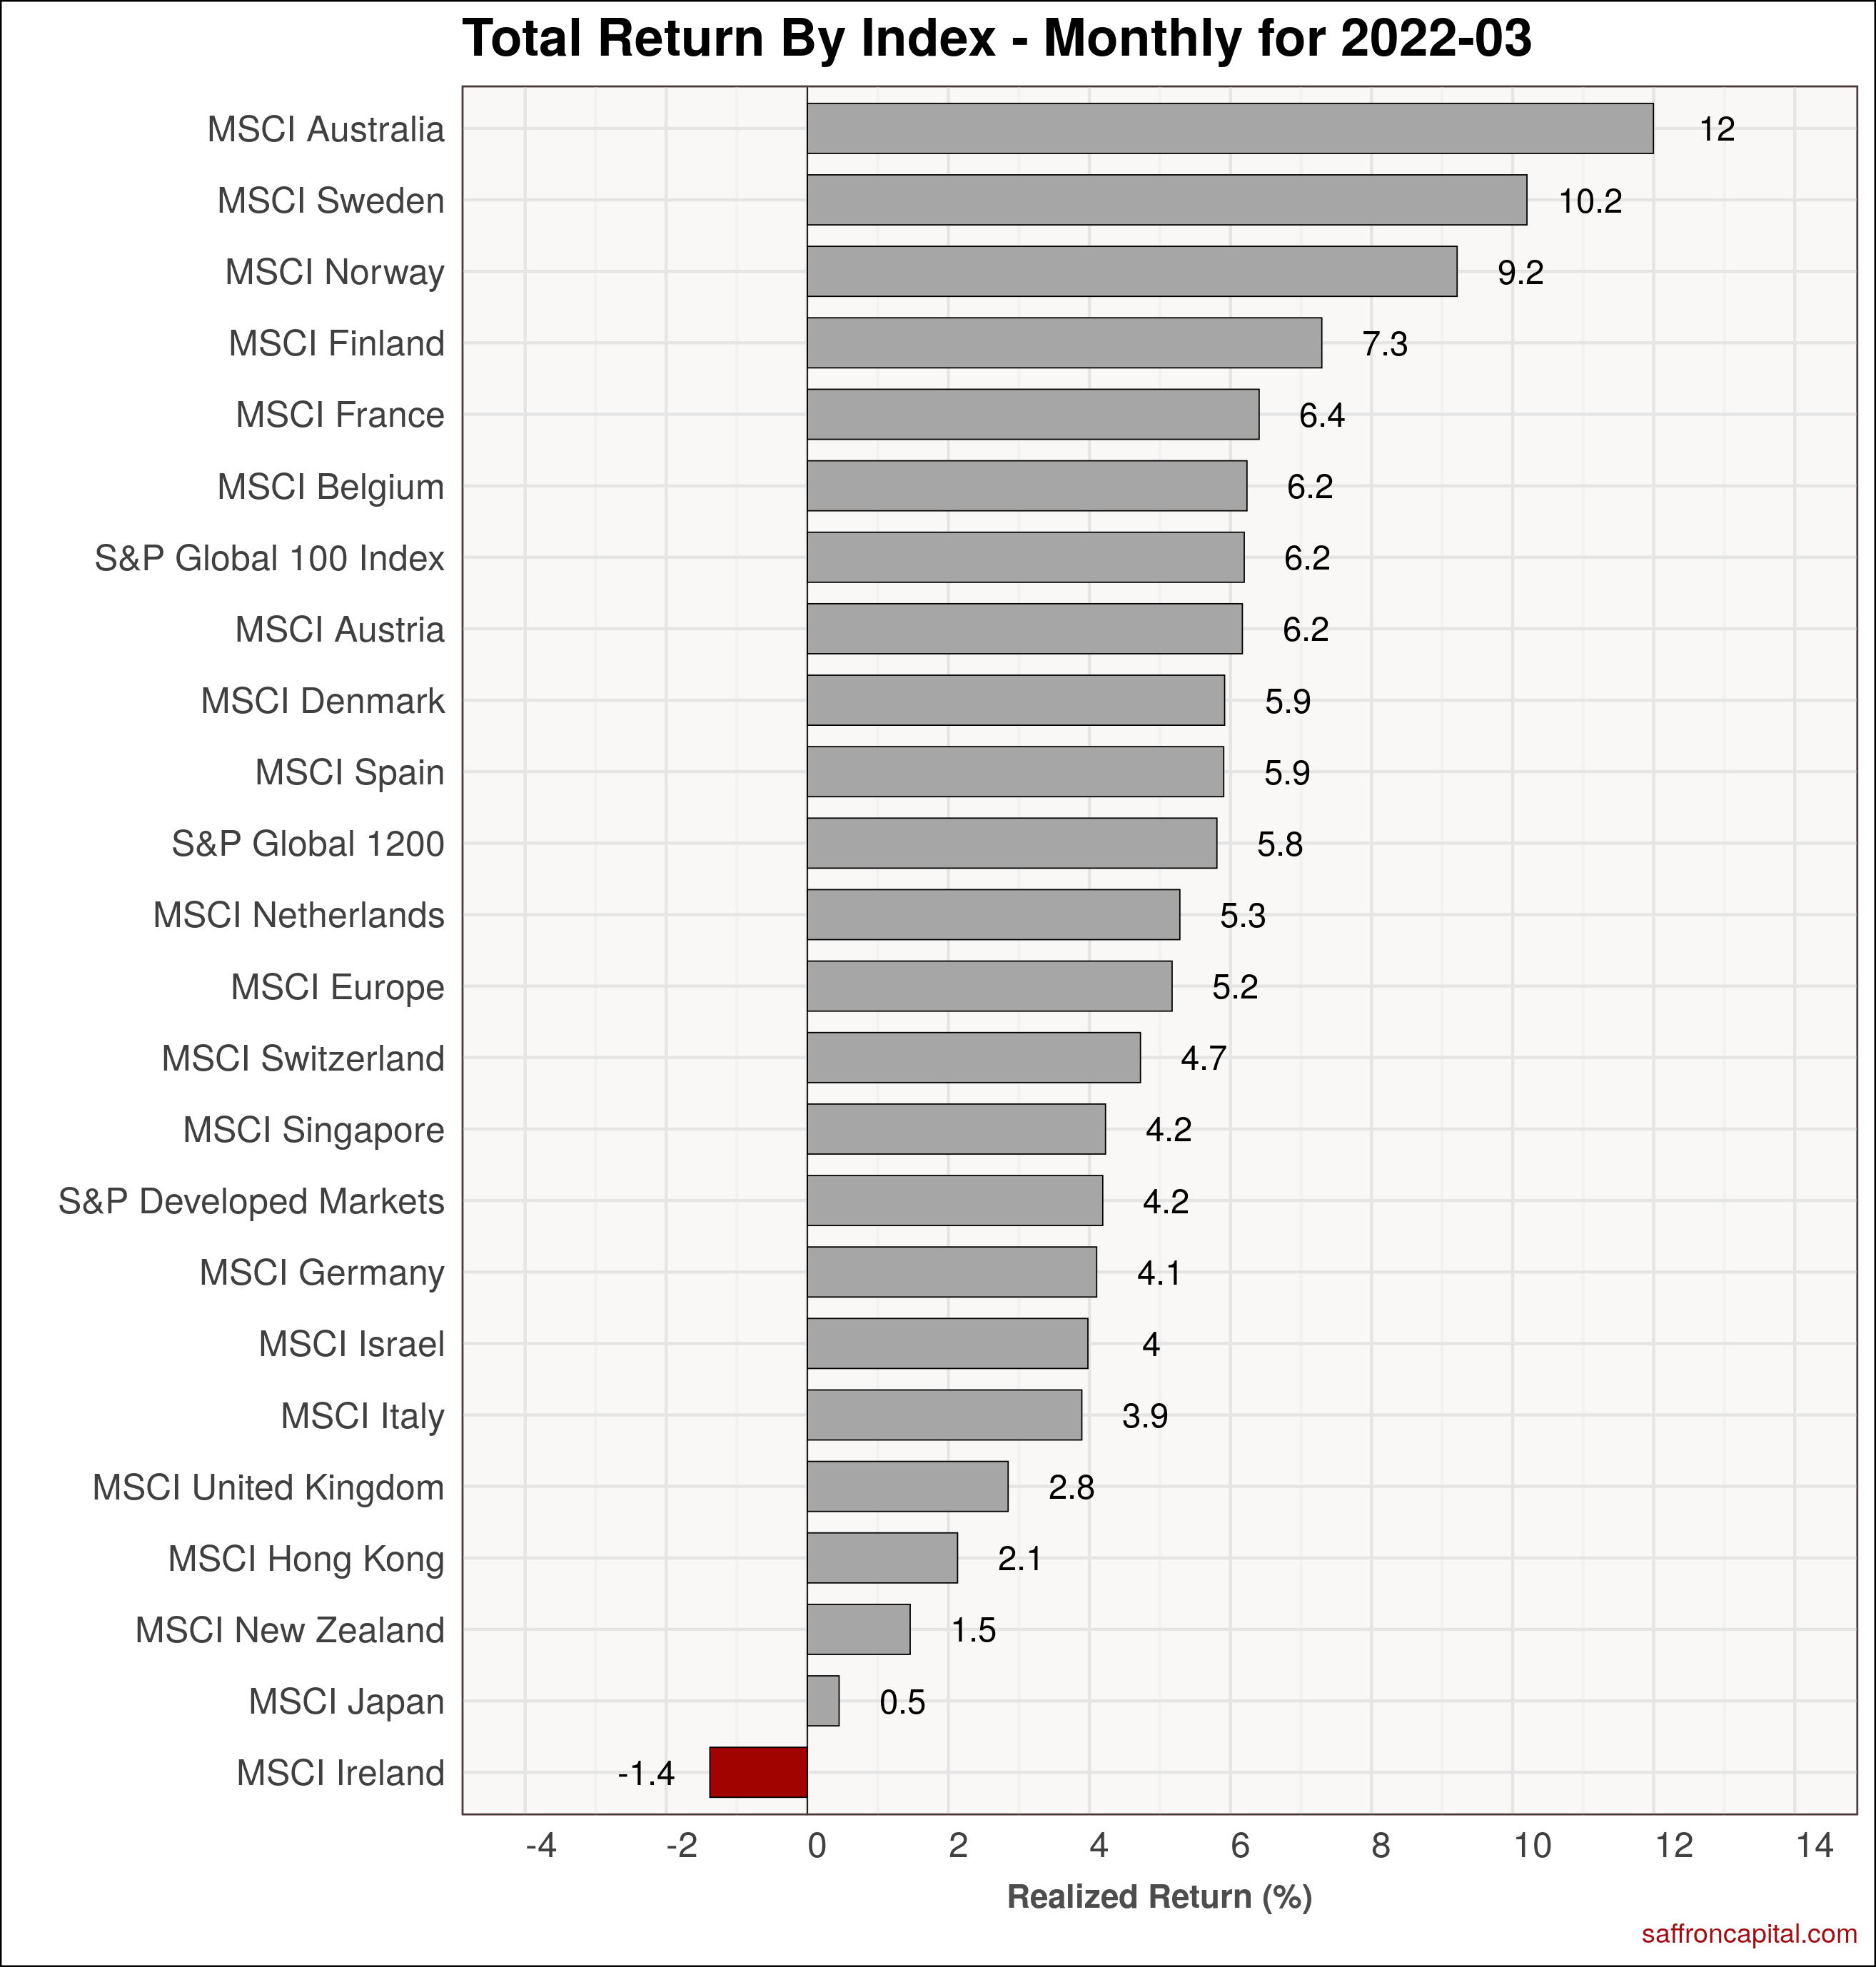
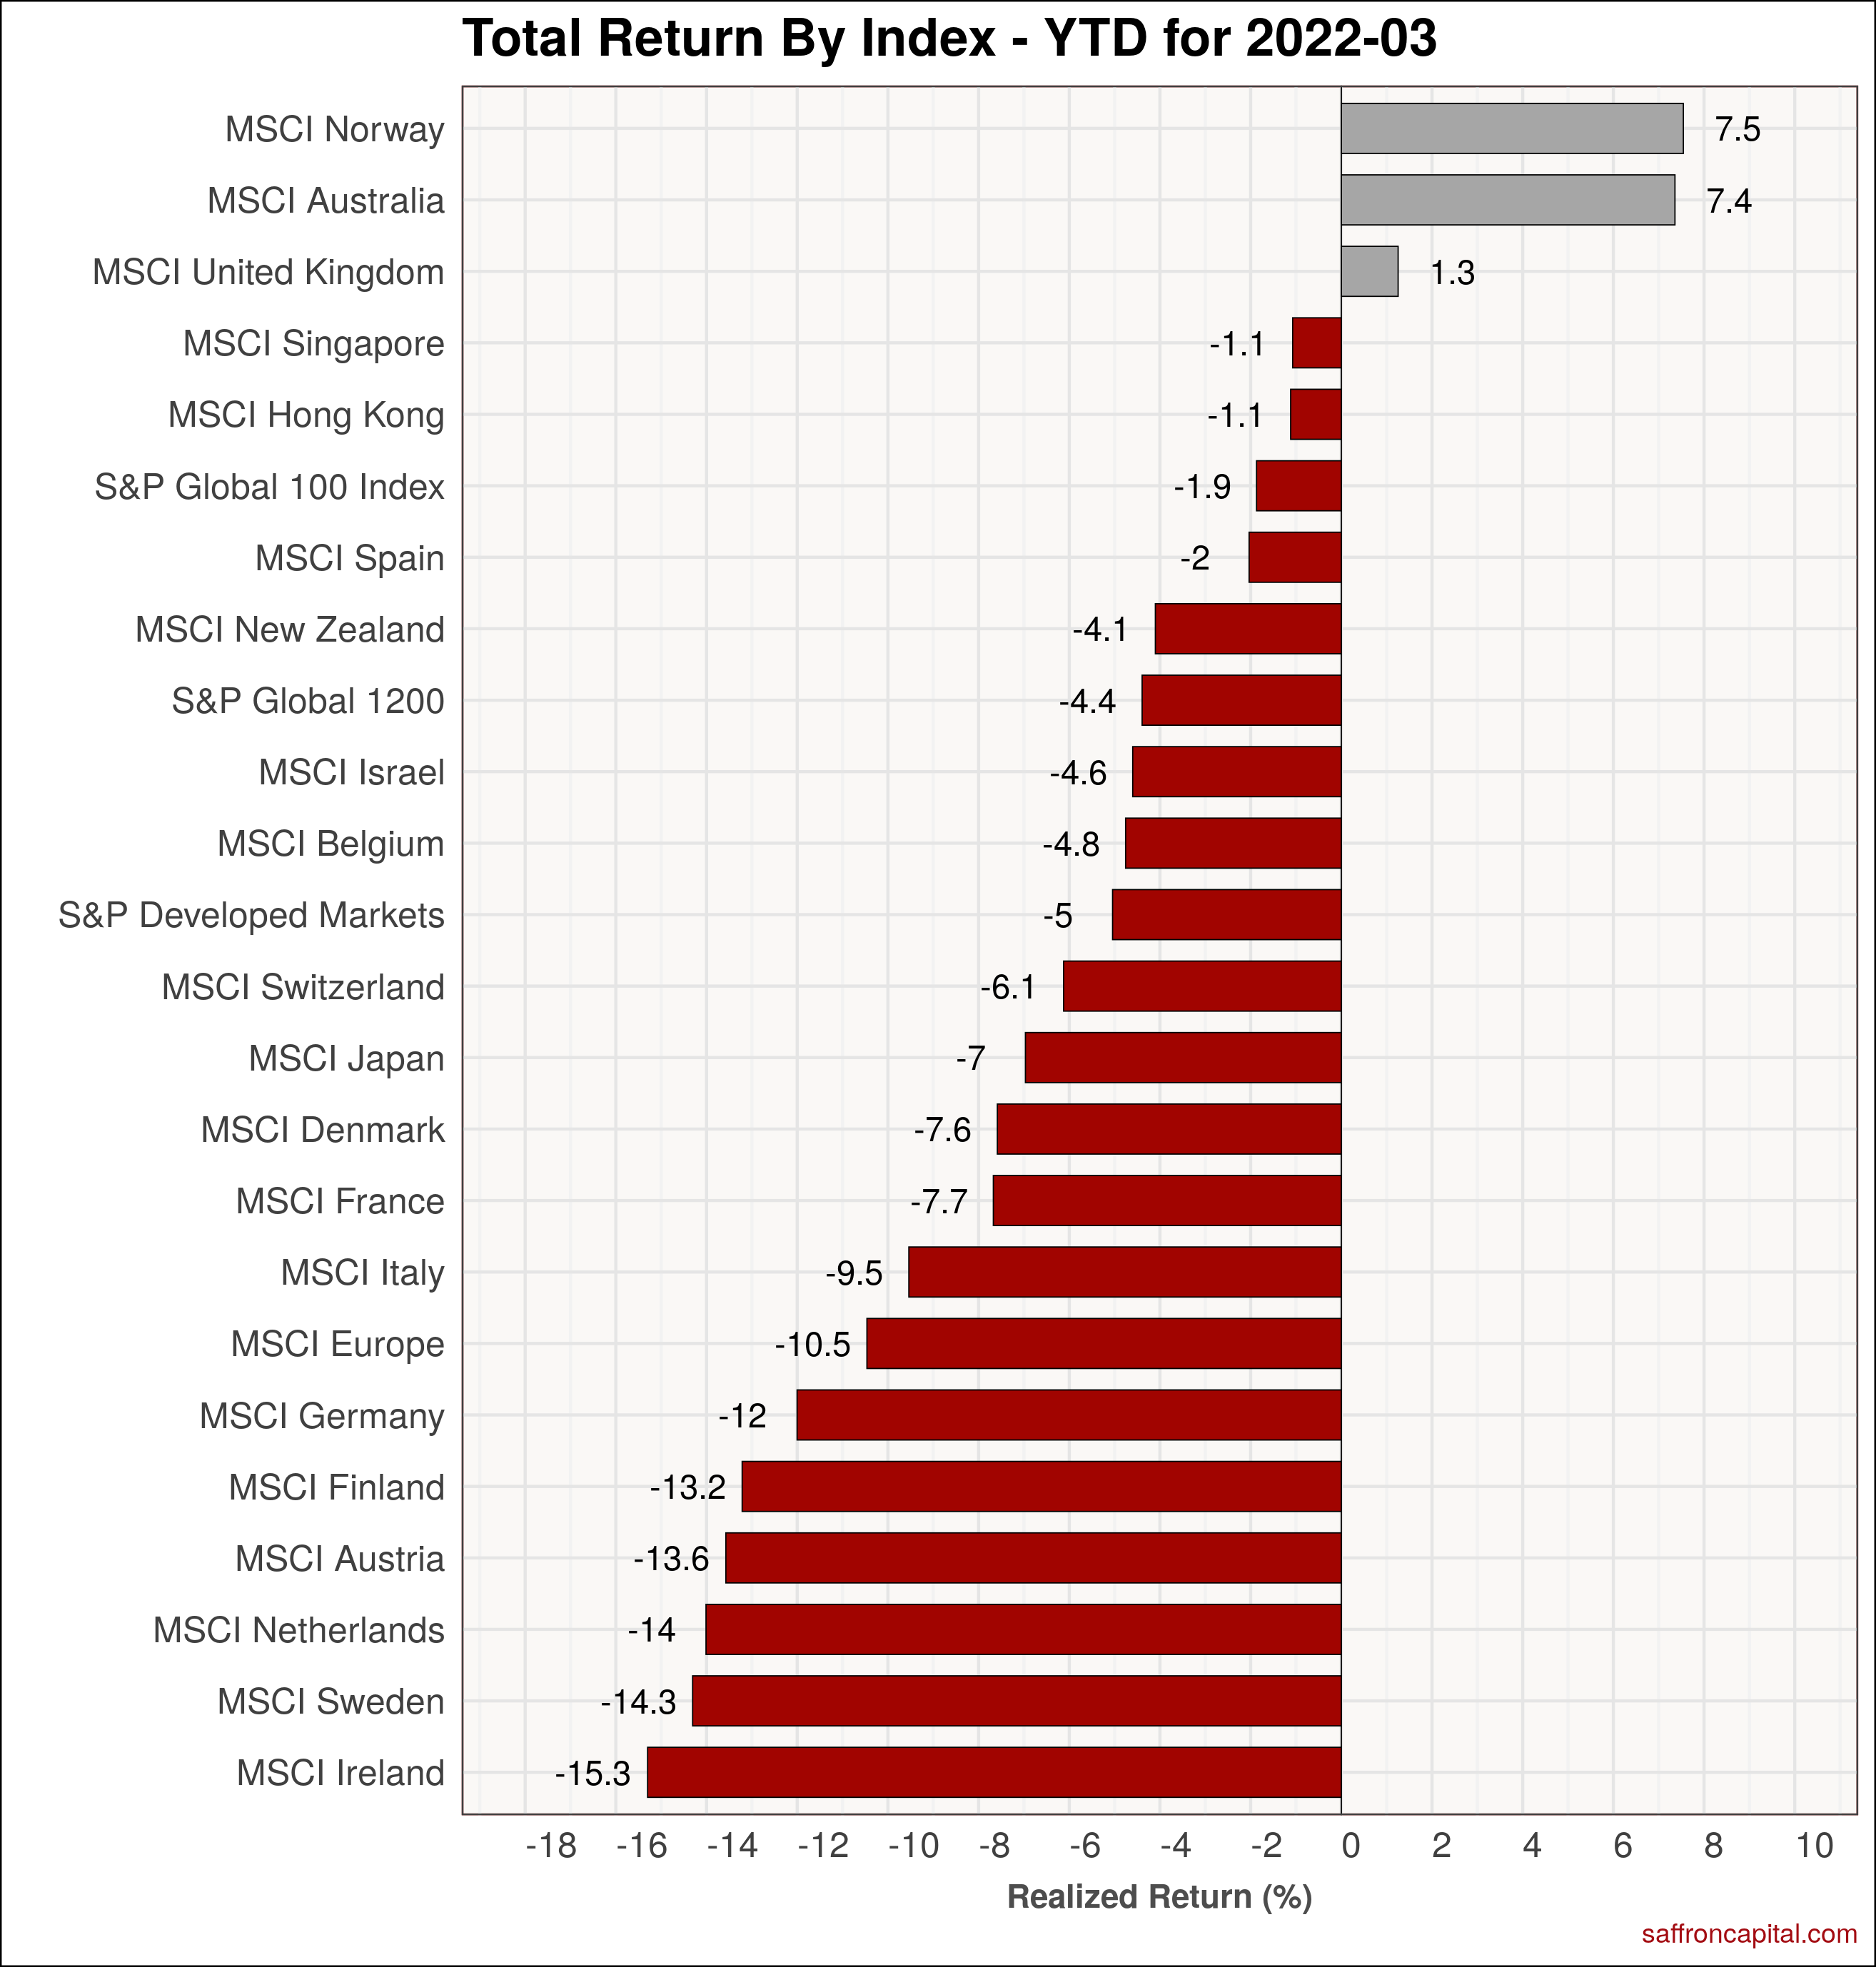
Elsewhere, many countries had positive returns. However, the S&P Developed Markets index (+4.2%) lagged the US by 270 basis points. Leading indices included Australia (+12%), Sweden (+10.2%) and Norway (+9.2%). Loss leaders included Ireland (-1.4%), Japan (+0.5%) and New Zealand (1.5%). On a year-to-date basis, international shares lag US equities by over 500 basis points.
Click to enlarge
Emerging Market Equities
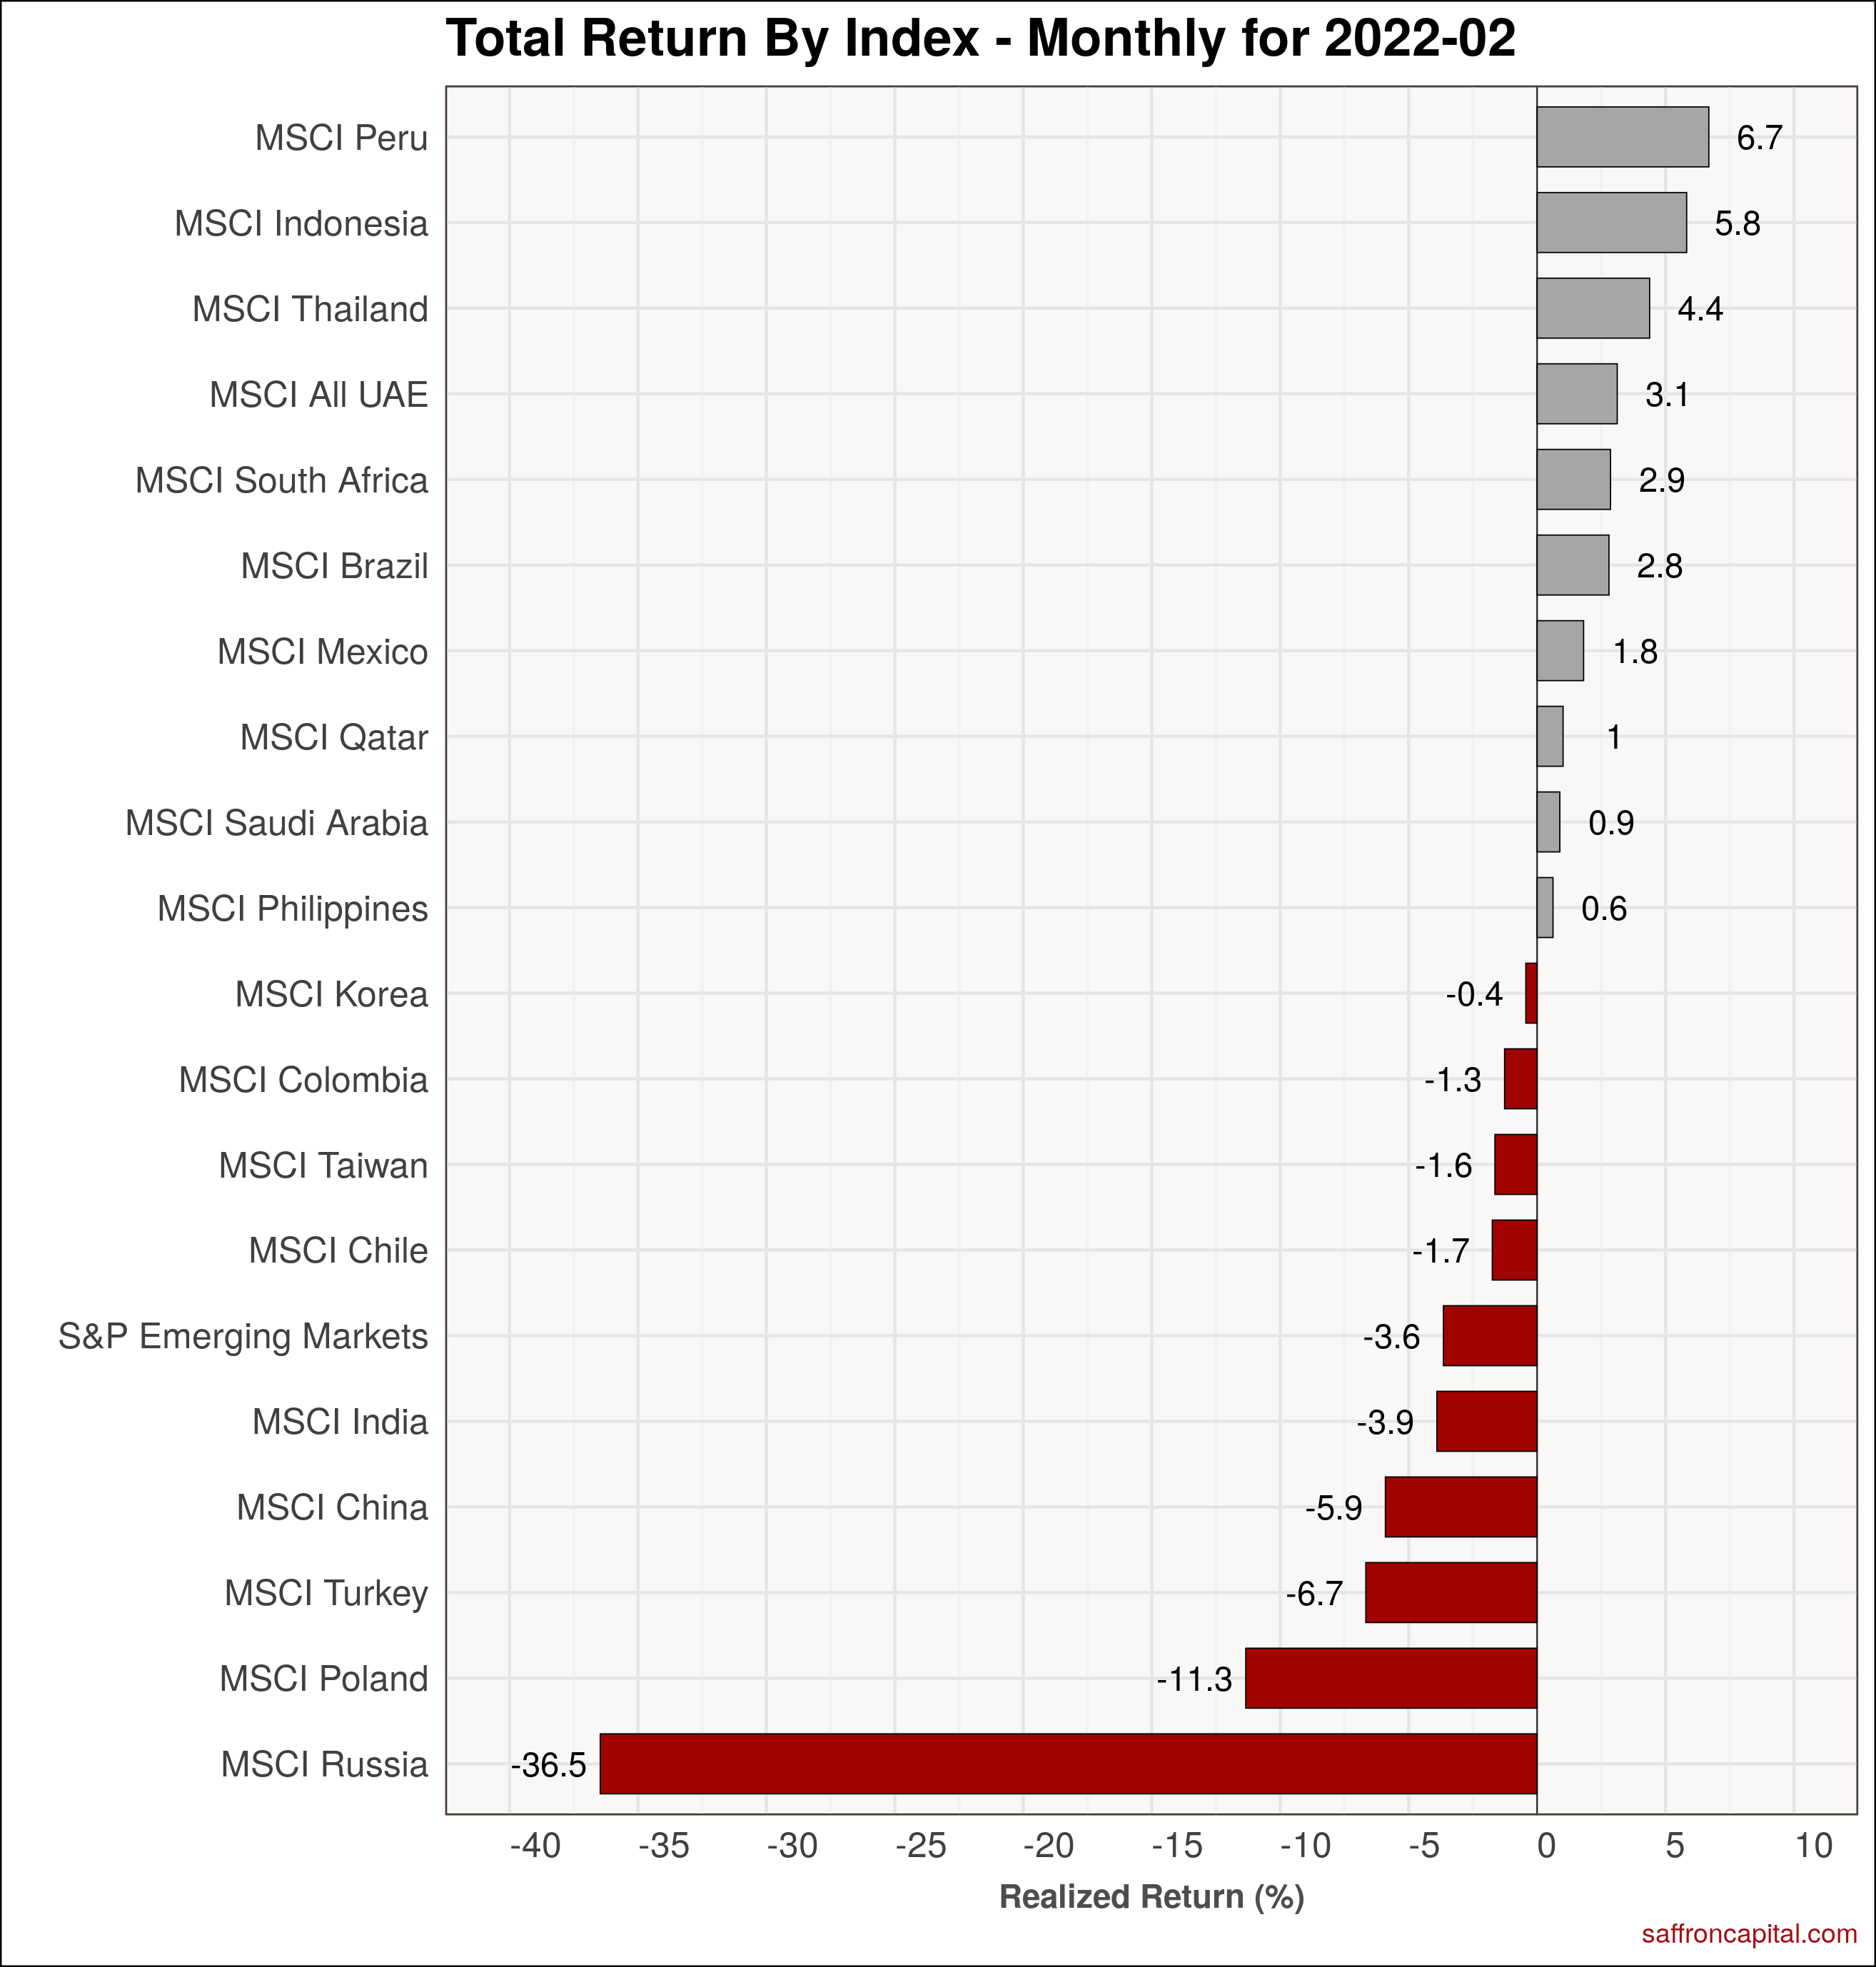
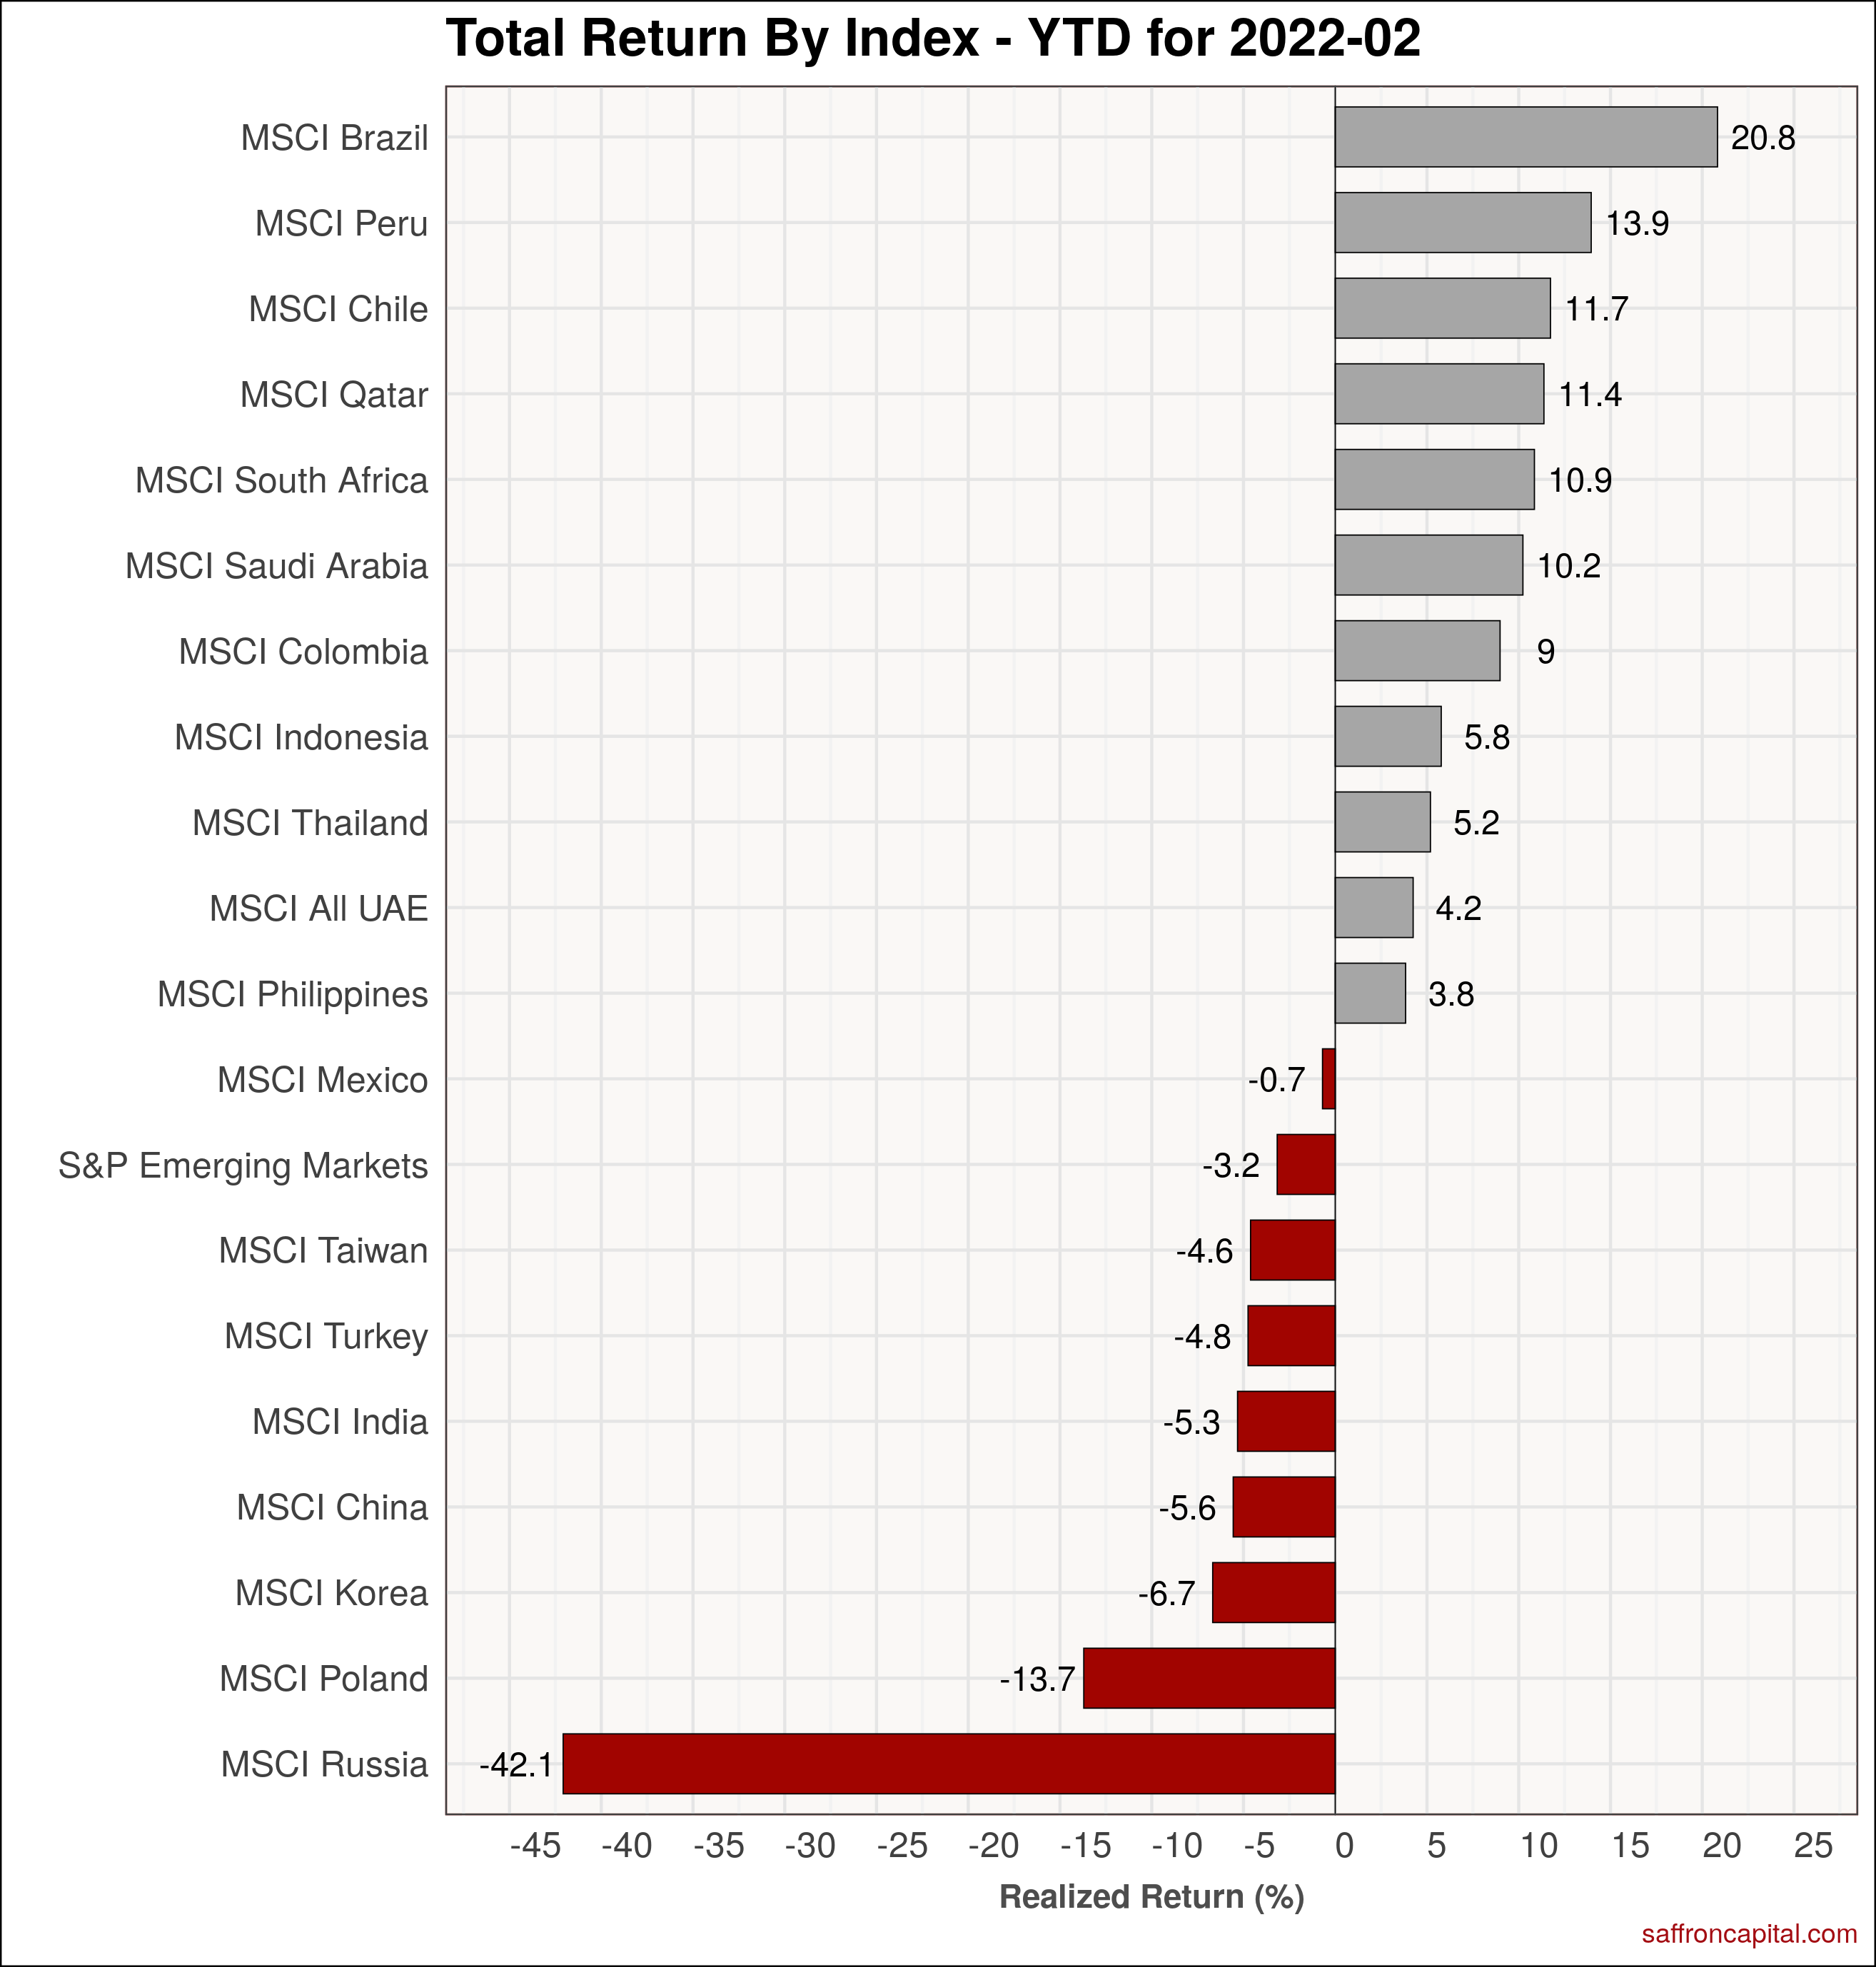
Next, we see the emerging markets index (-0.1%) was unchanged, though March returns varied widely by country. Poland (+14.8%), Brazil (+14.7%) and Chile (14.3%) topped the charts, while Russia (-32.8%), China (-6.4%) were down. Year-to-date, the Emerging Markets index (-6.0%) is down due to the Russian stock market (-81.3%), whose fall has been extreme.
Click to enlarge
Government Bonds
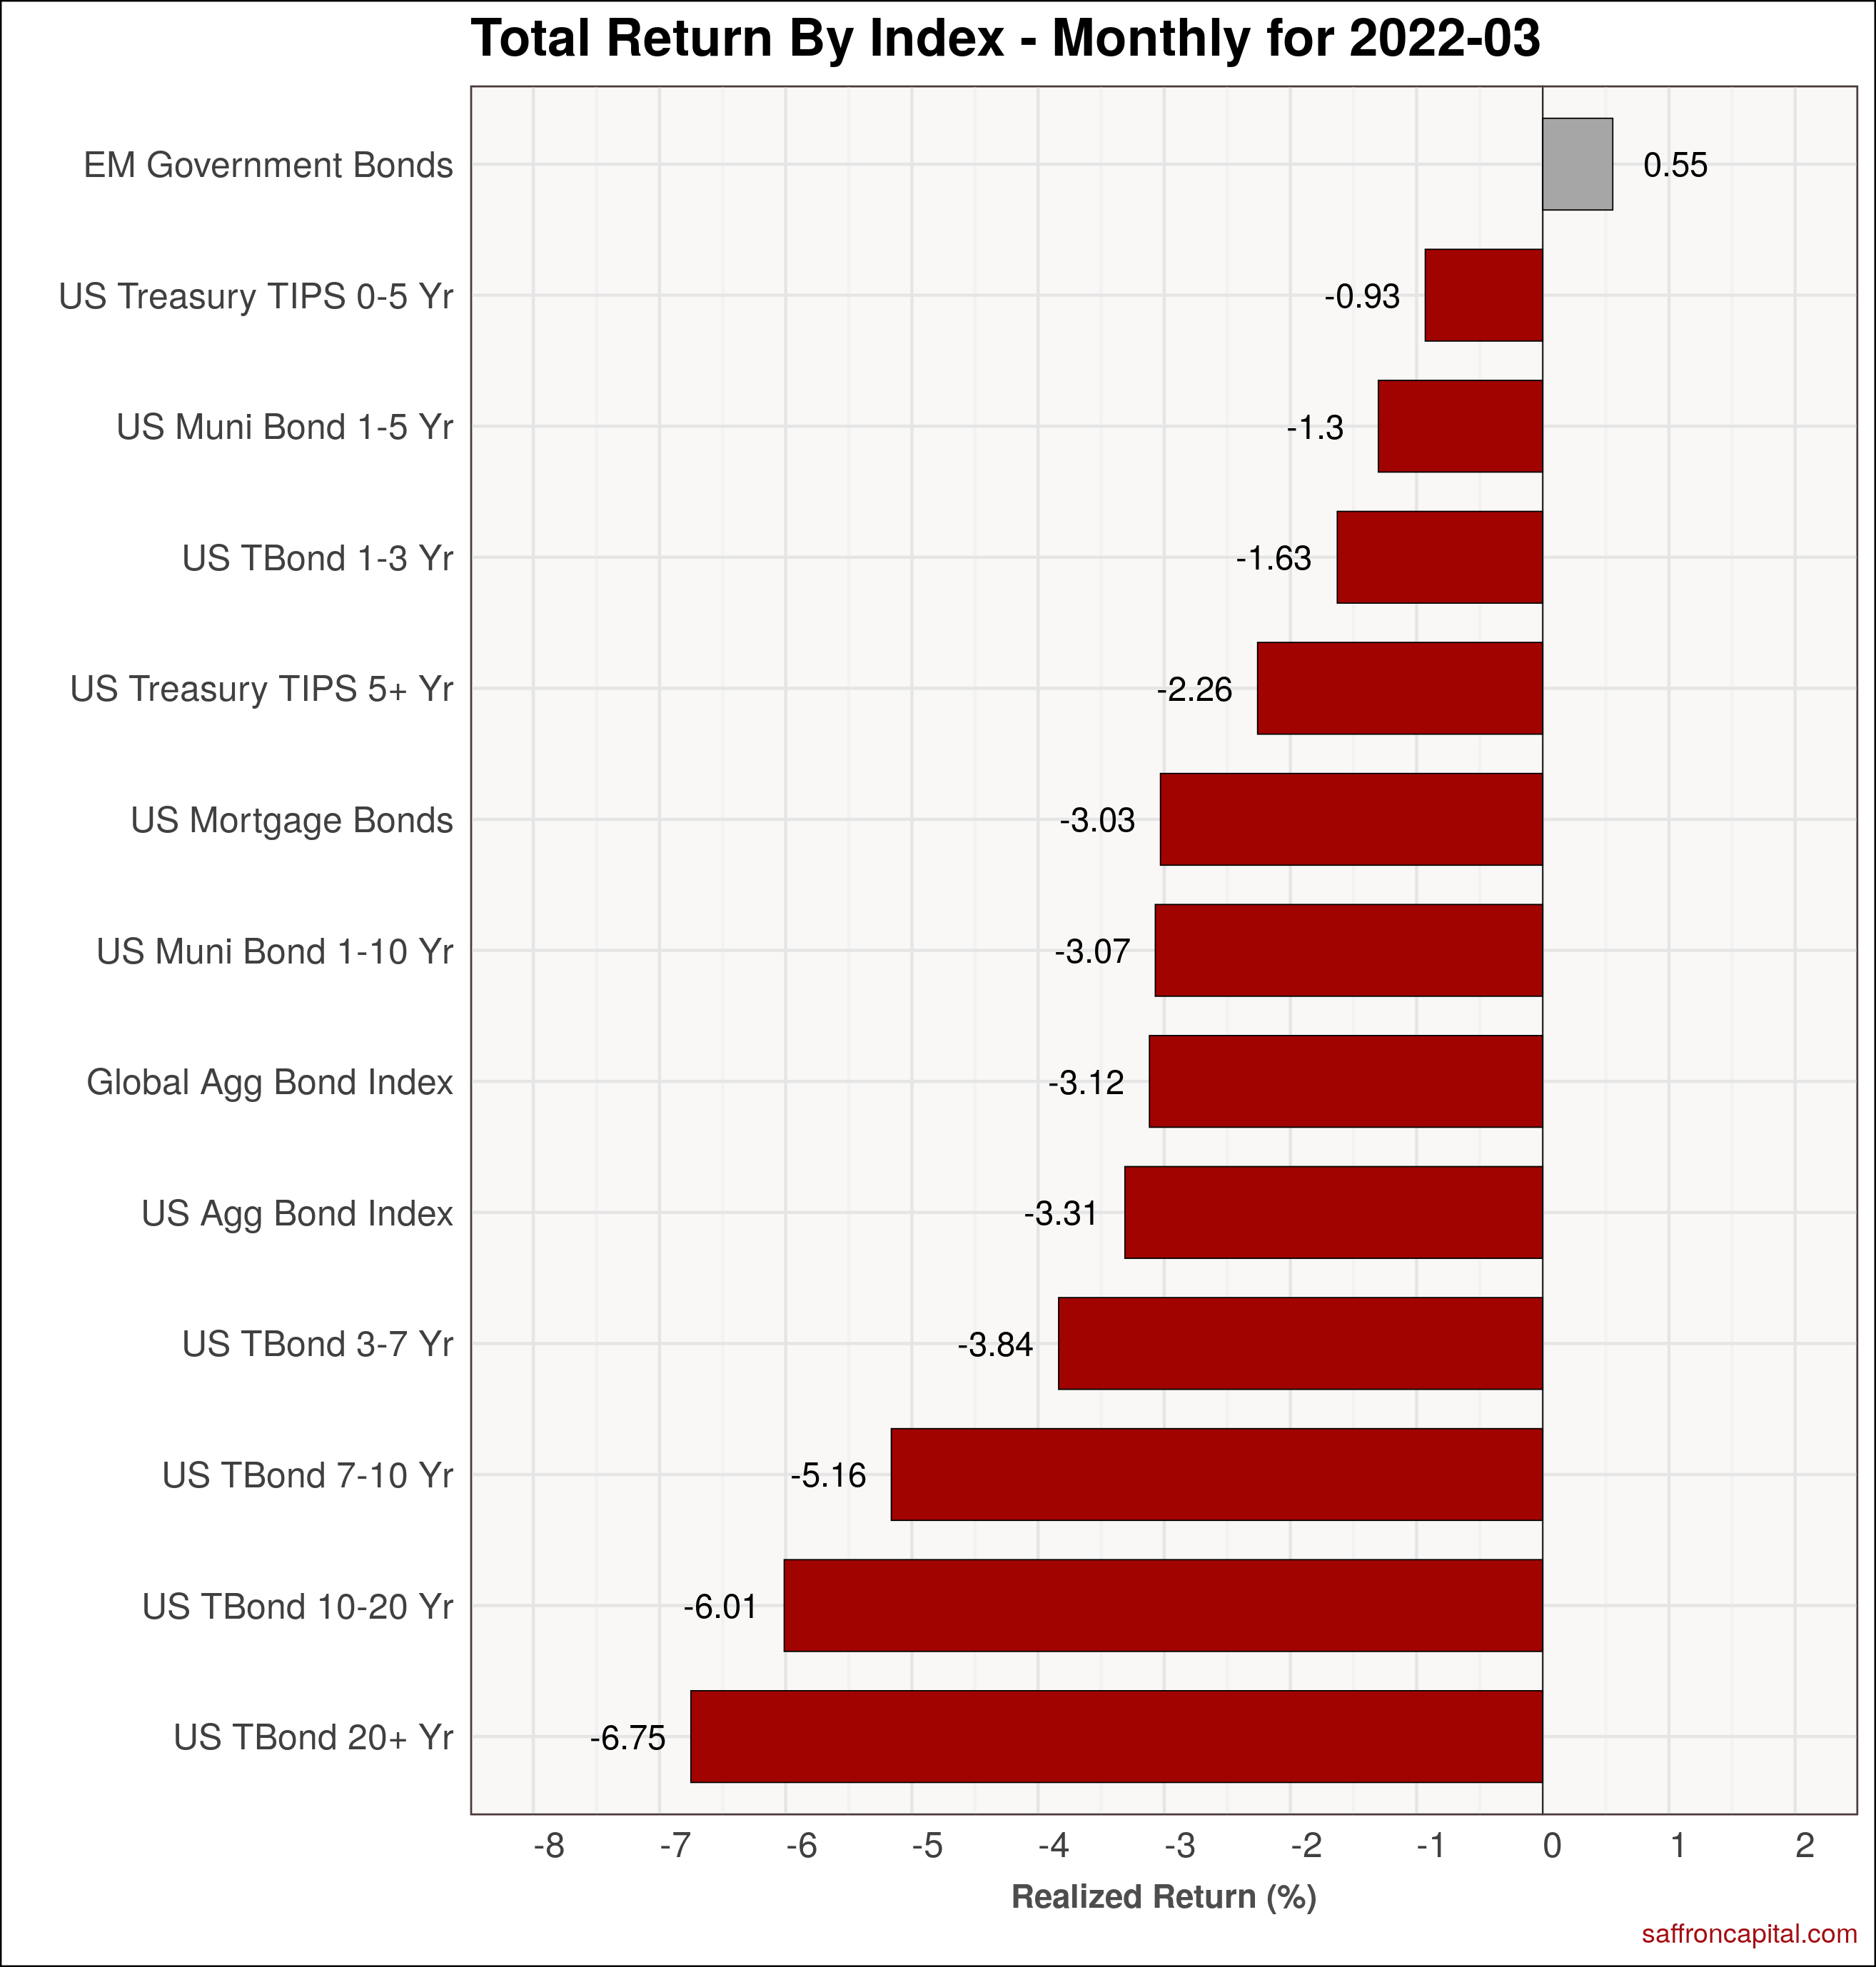
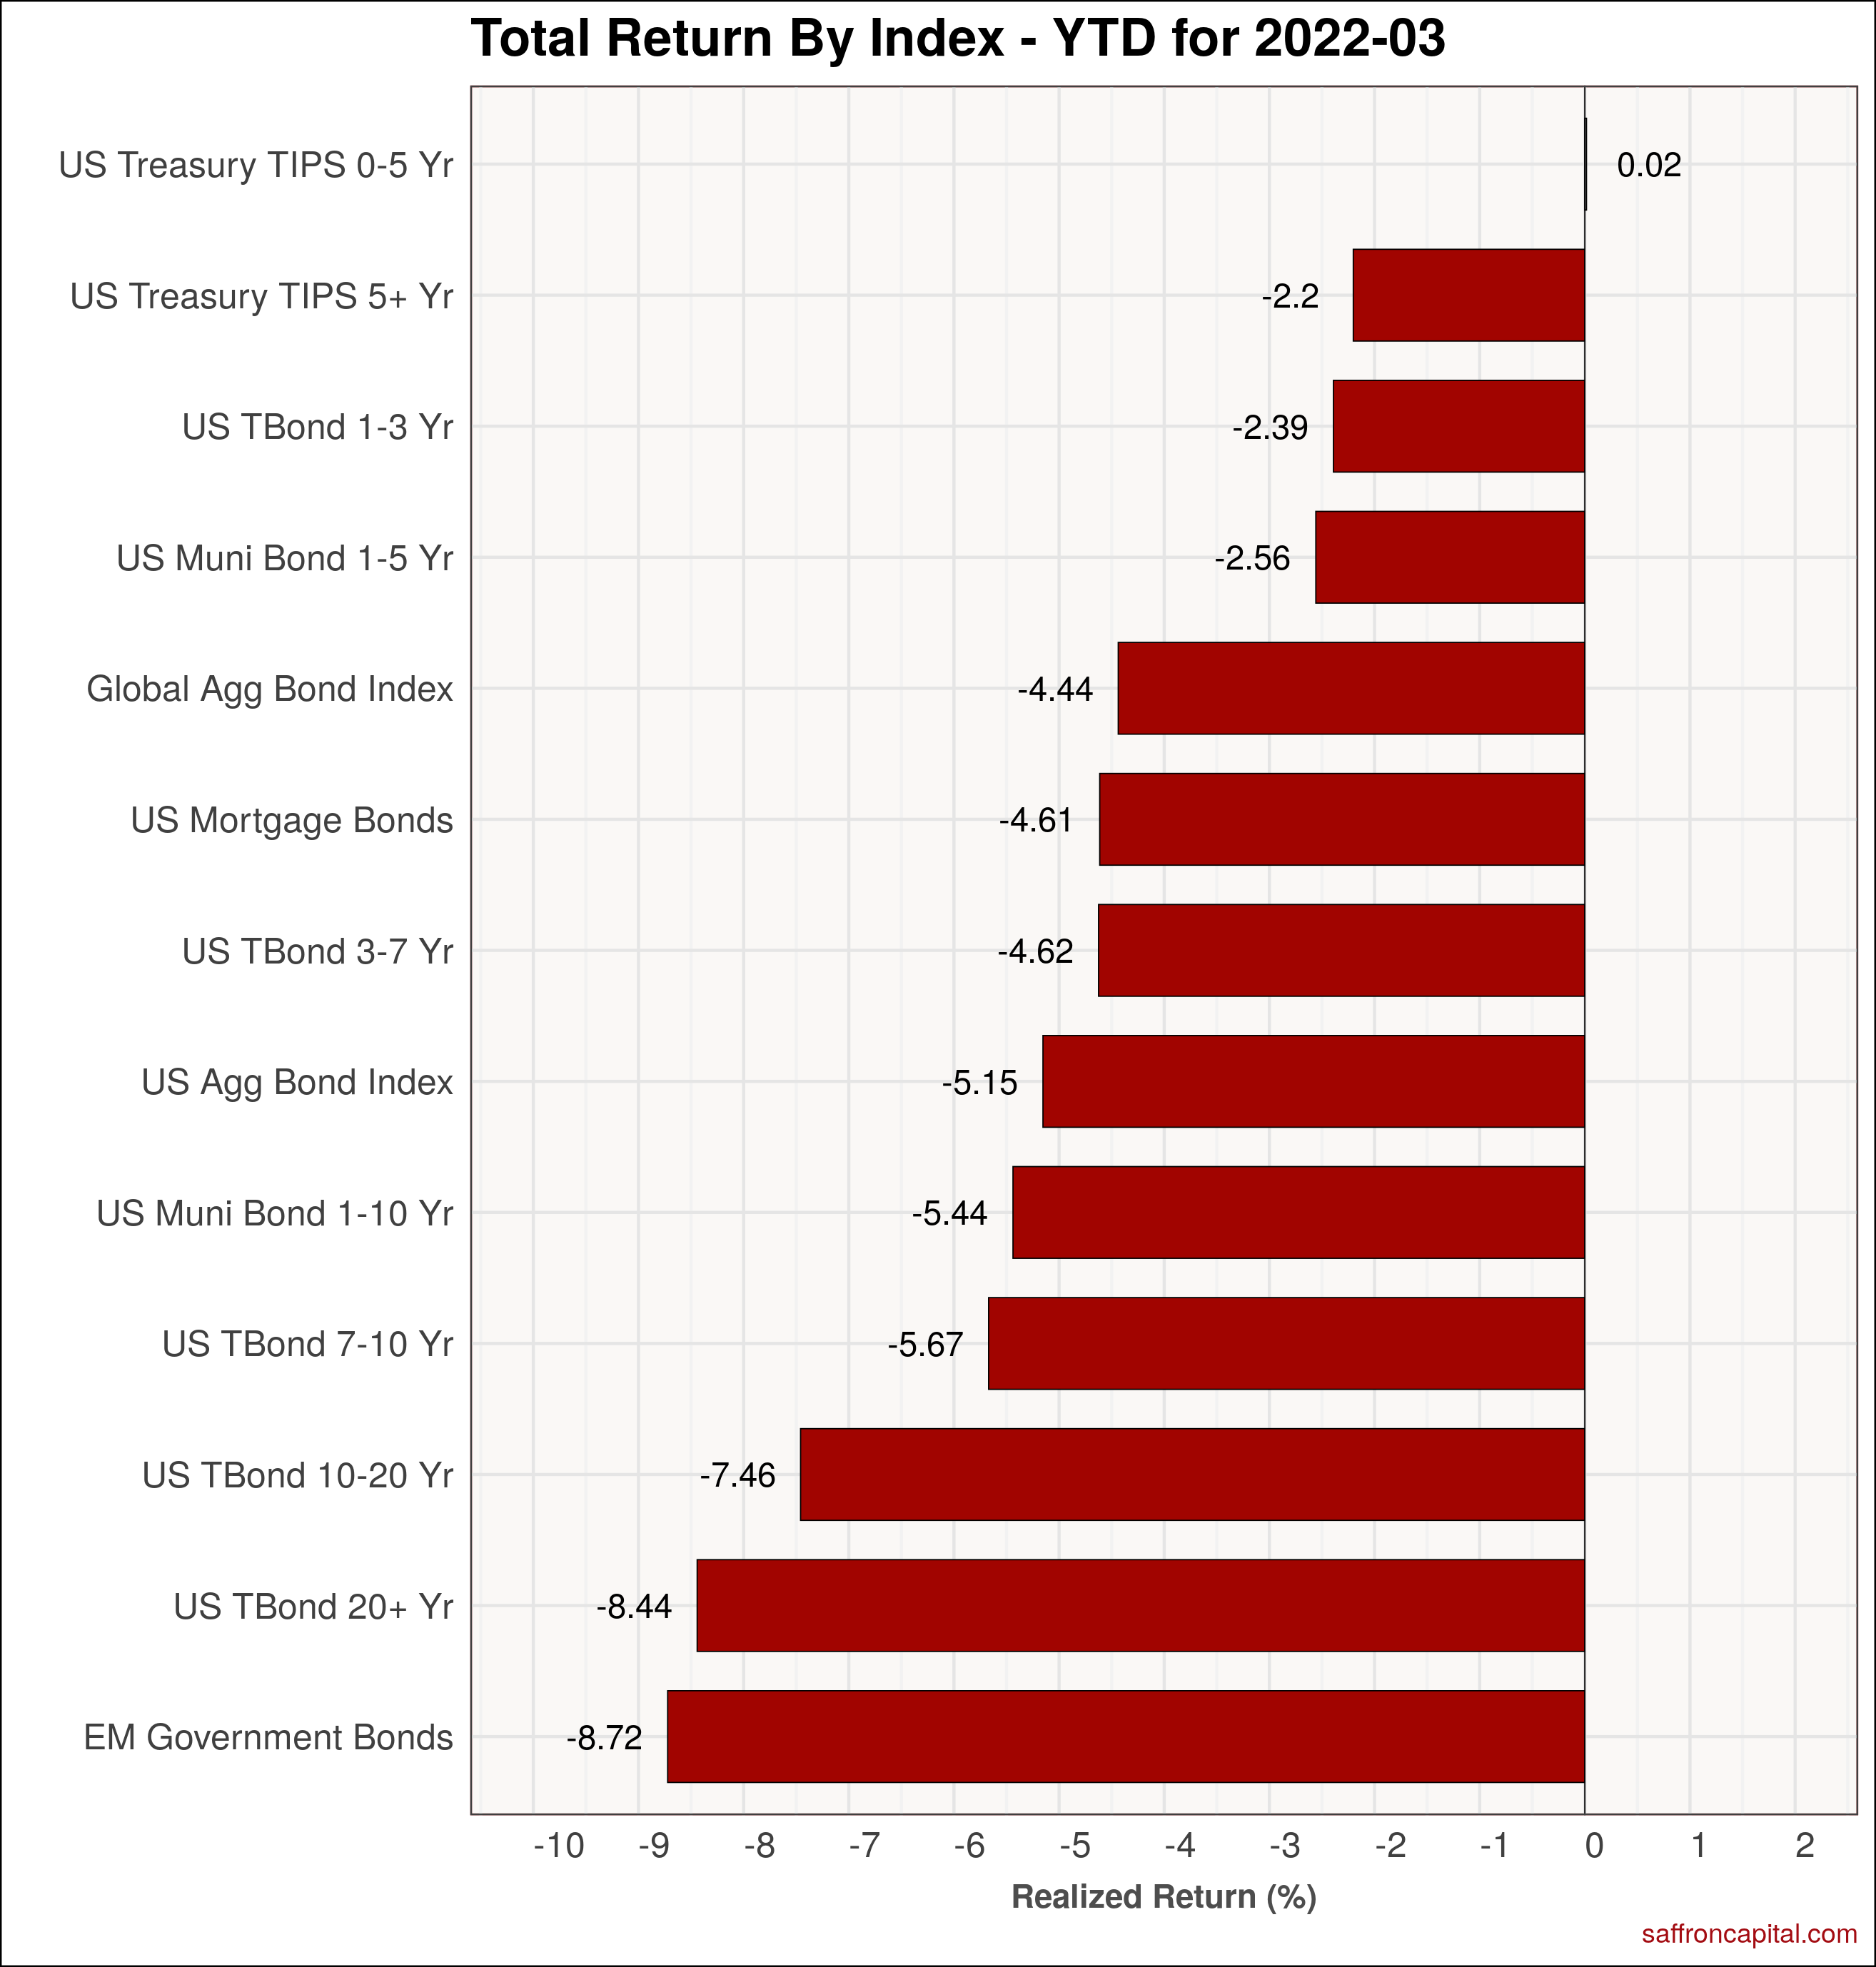
March returns were down for all government bond maturities, as seen by the Global Aggregate Bond Index (-3.12%) . Only emerging market government bonds (+0.55%) were spared from red ink. Since the first of the year, total returns across the yield curve varied. The 2-Year Treasury Note (-2.4%) and the 20-Year Bond (-8.4%) both lagged equities.
Click to enlarge
Corporate & Infrastructure Bonds
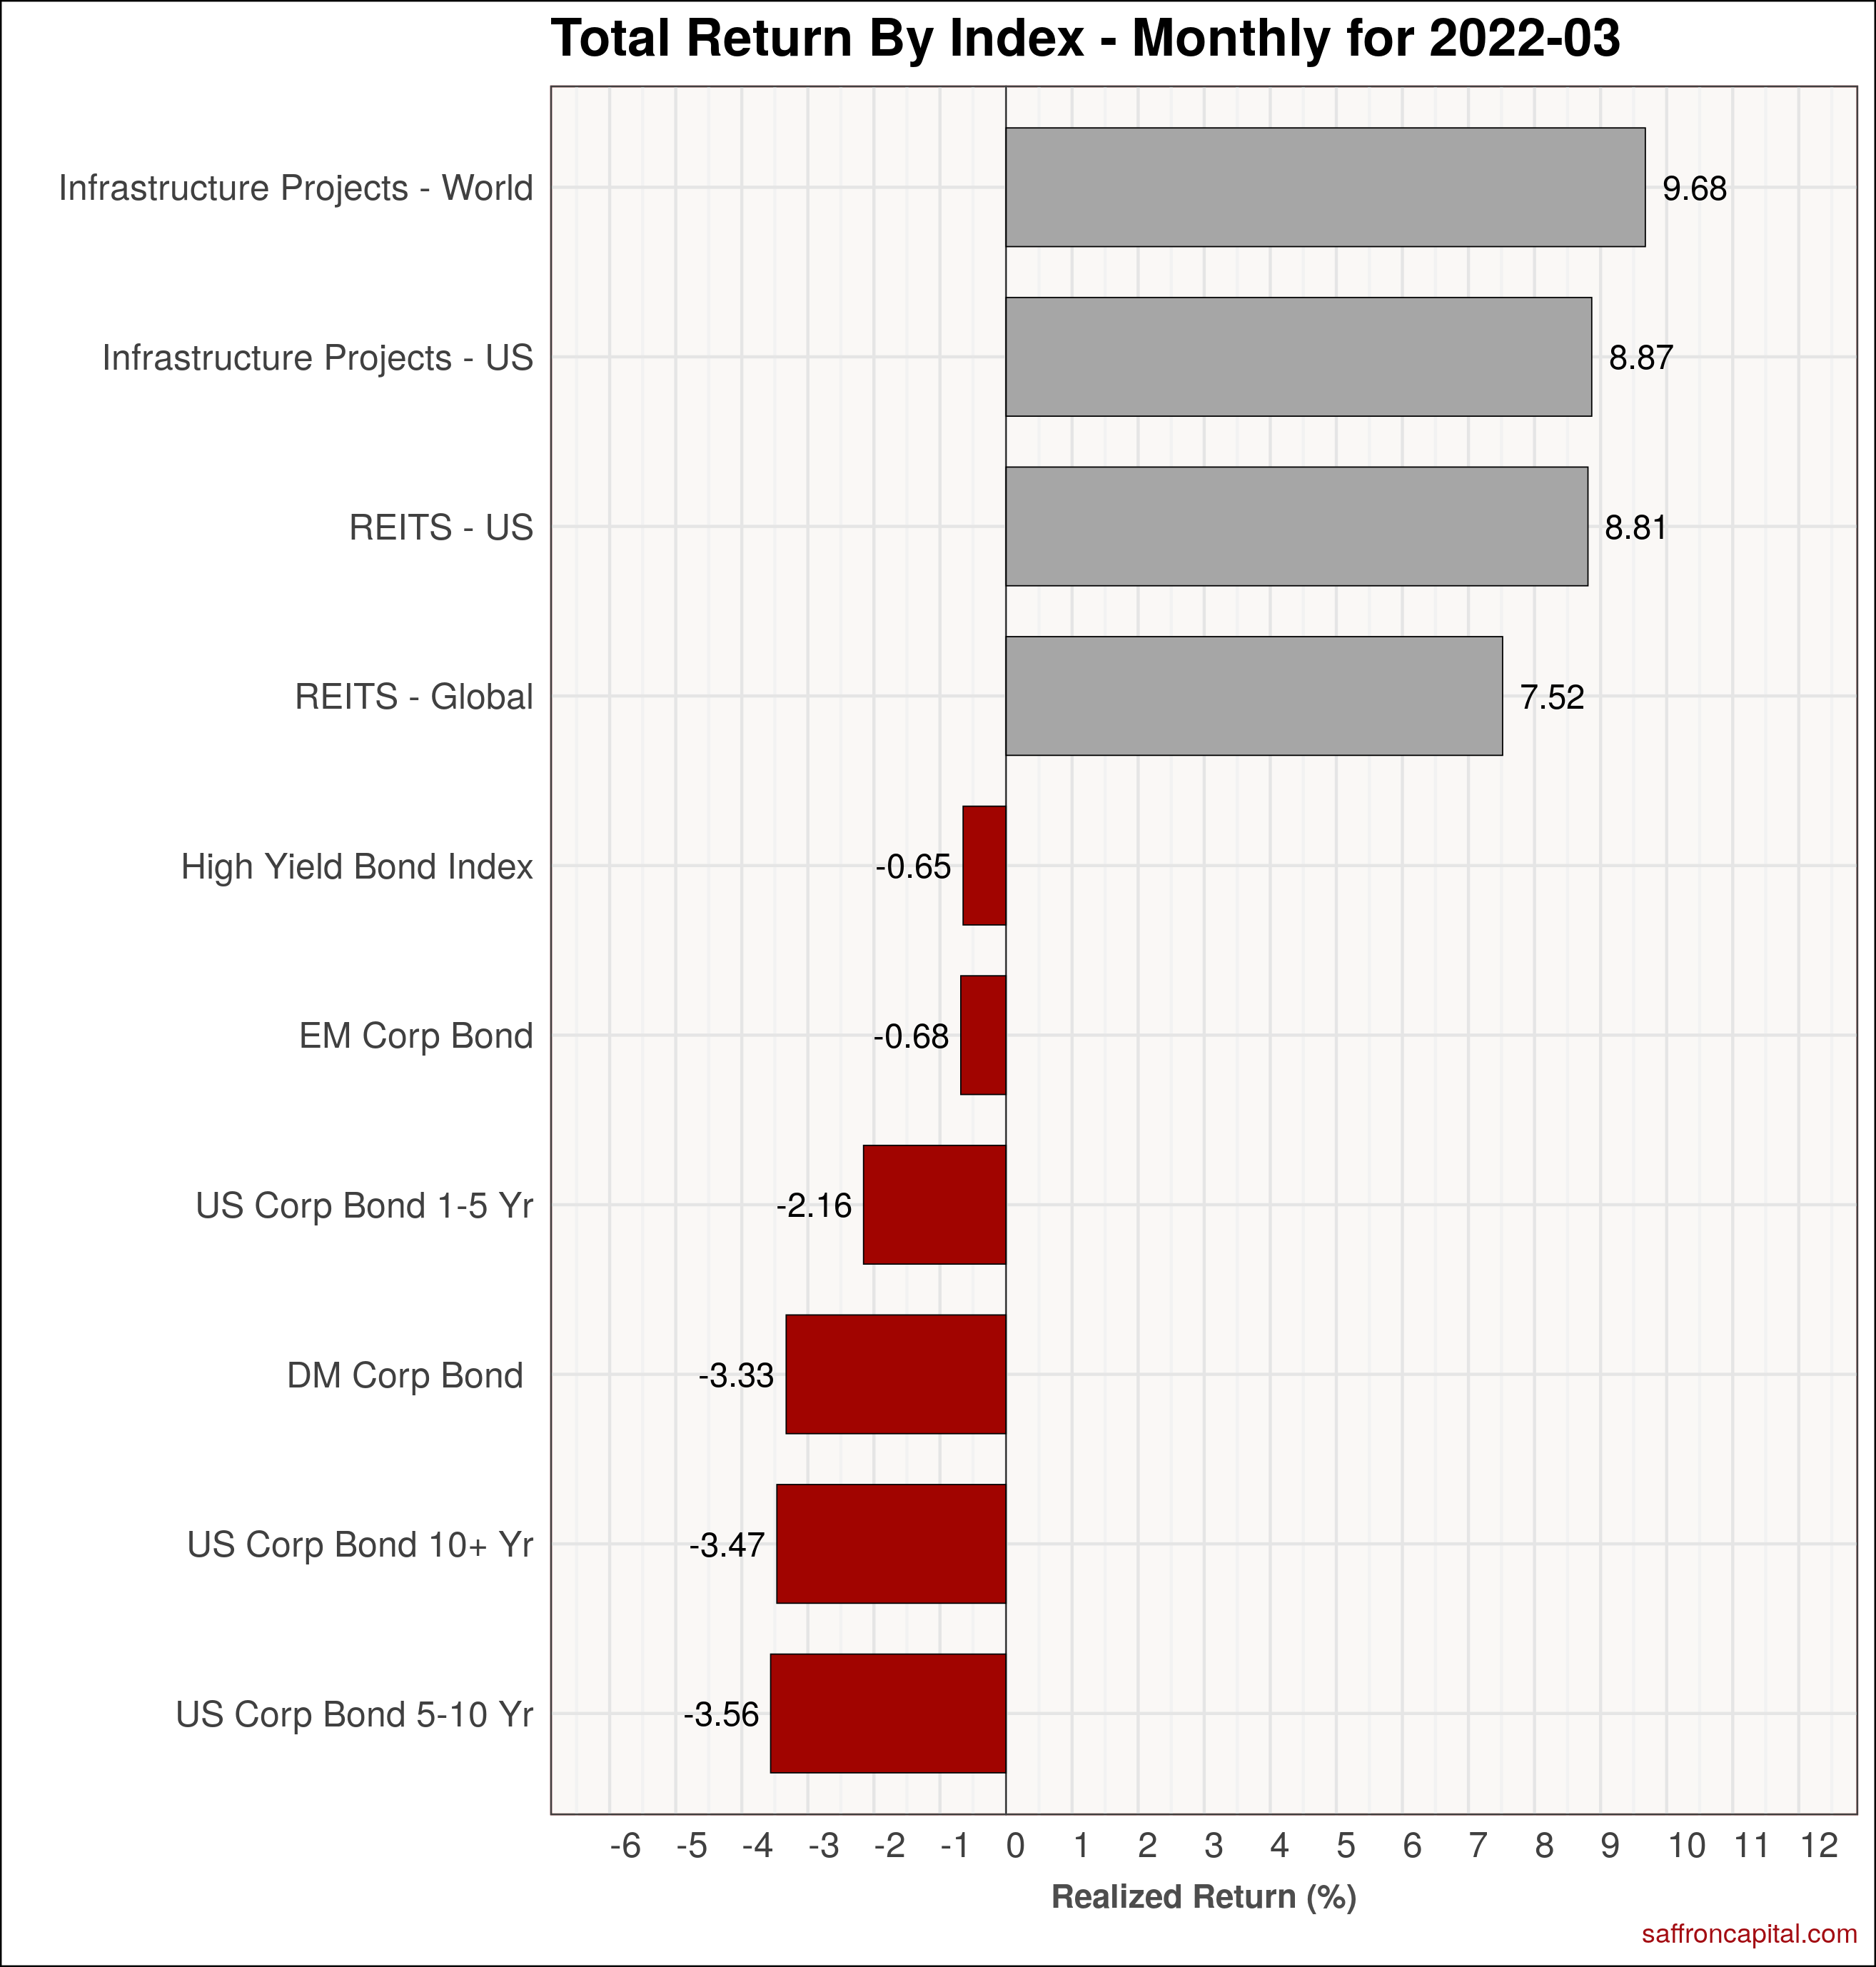
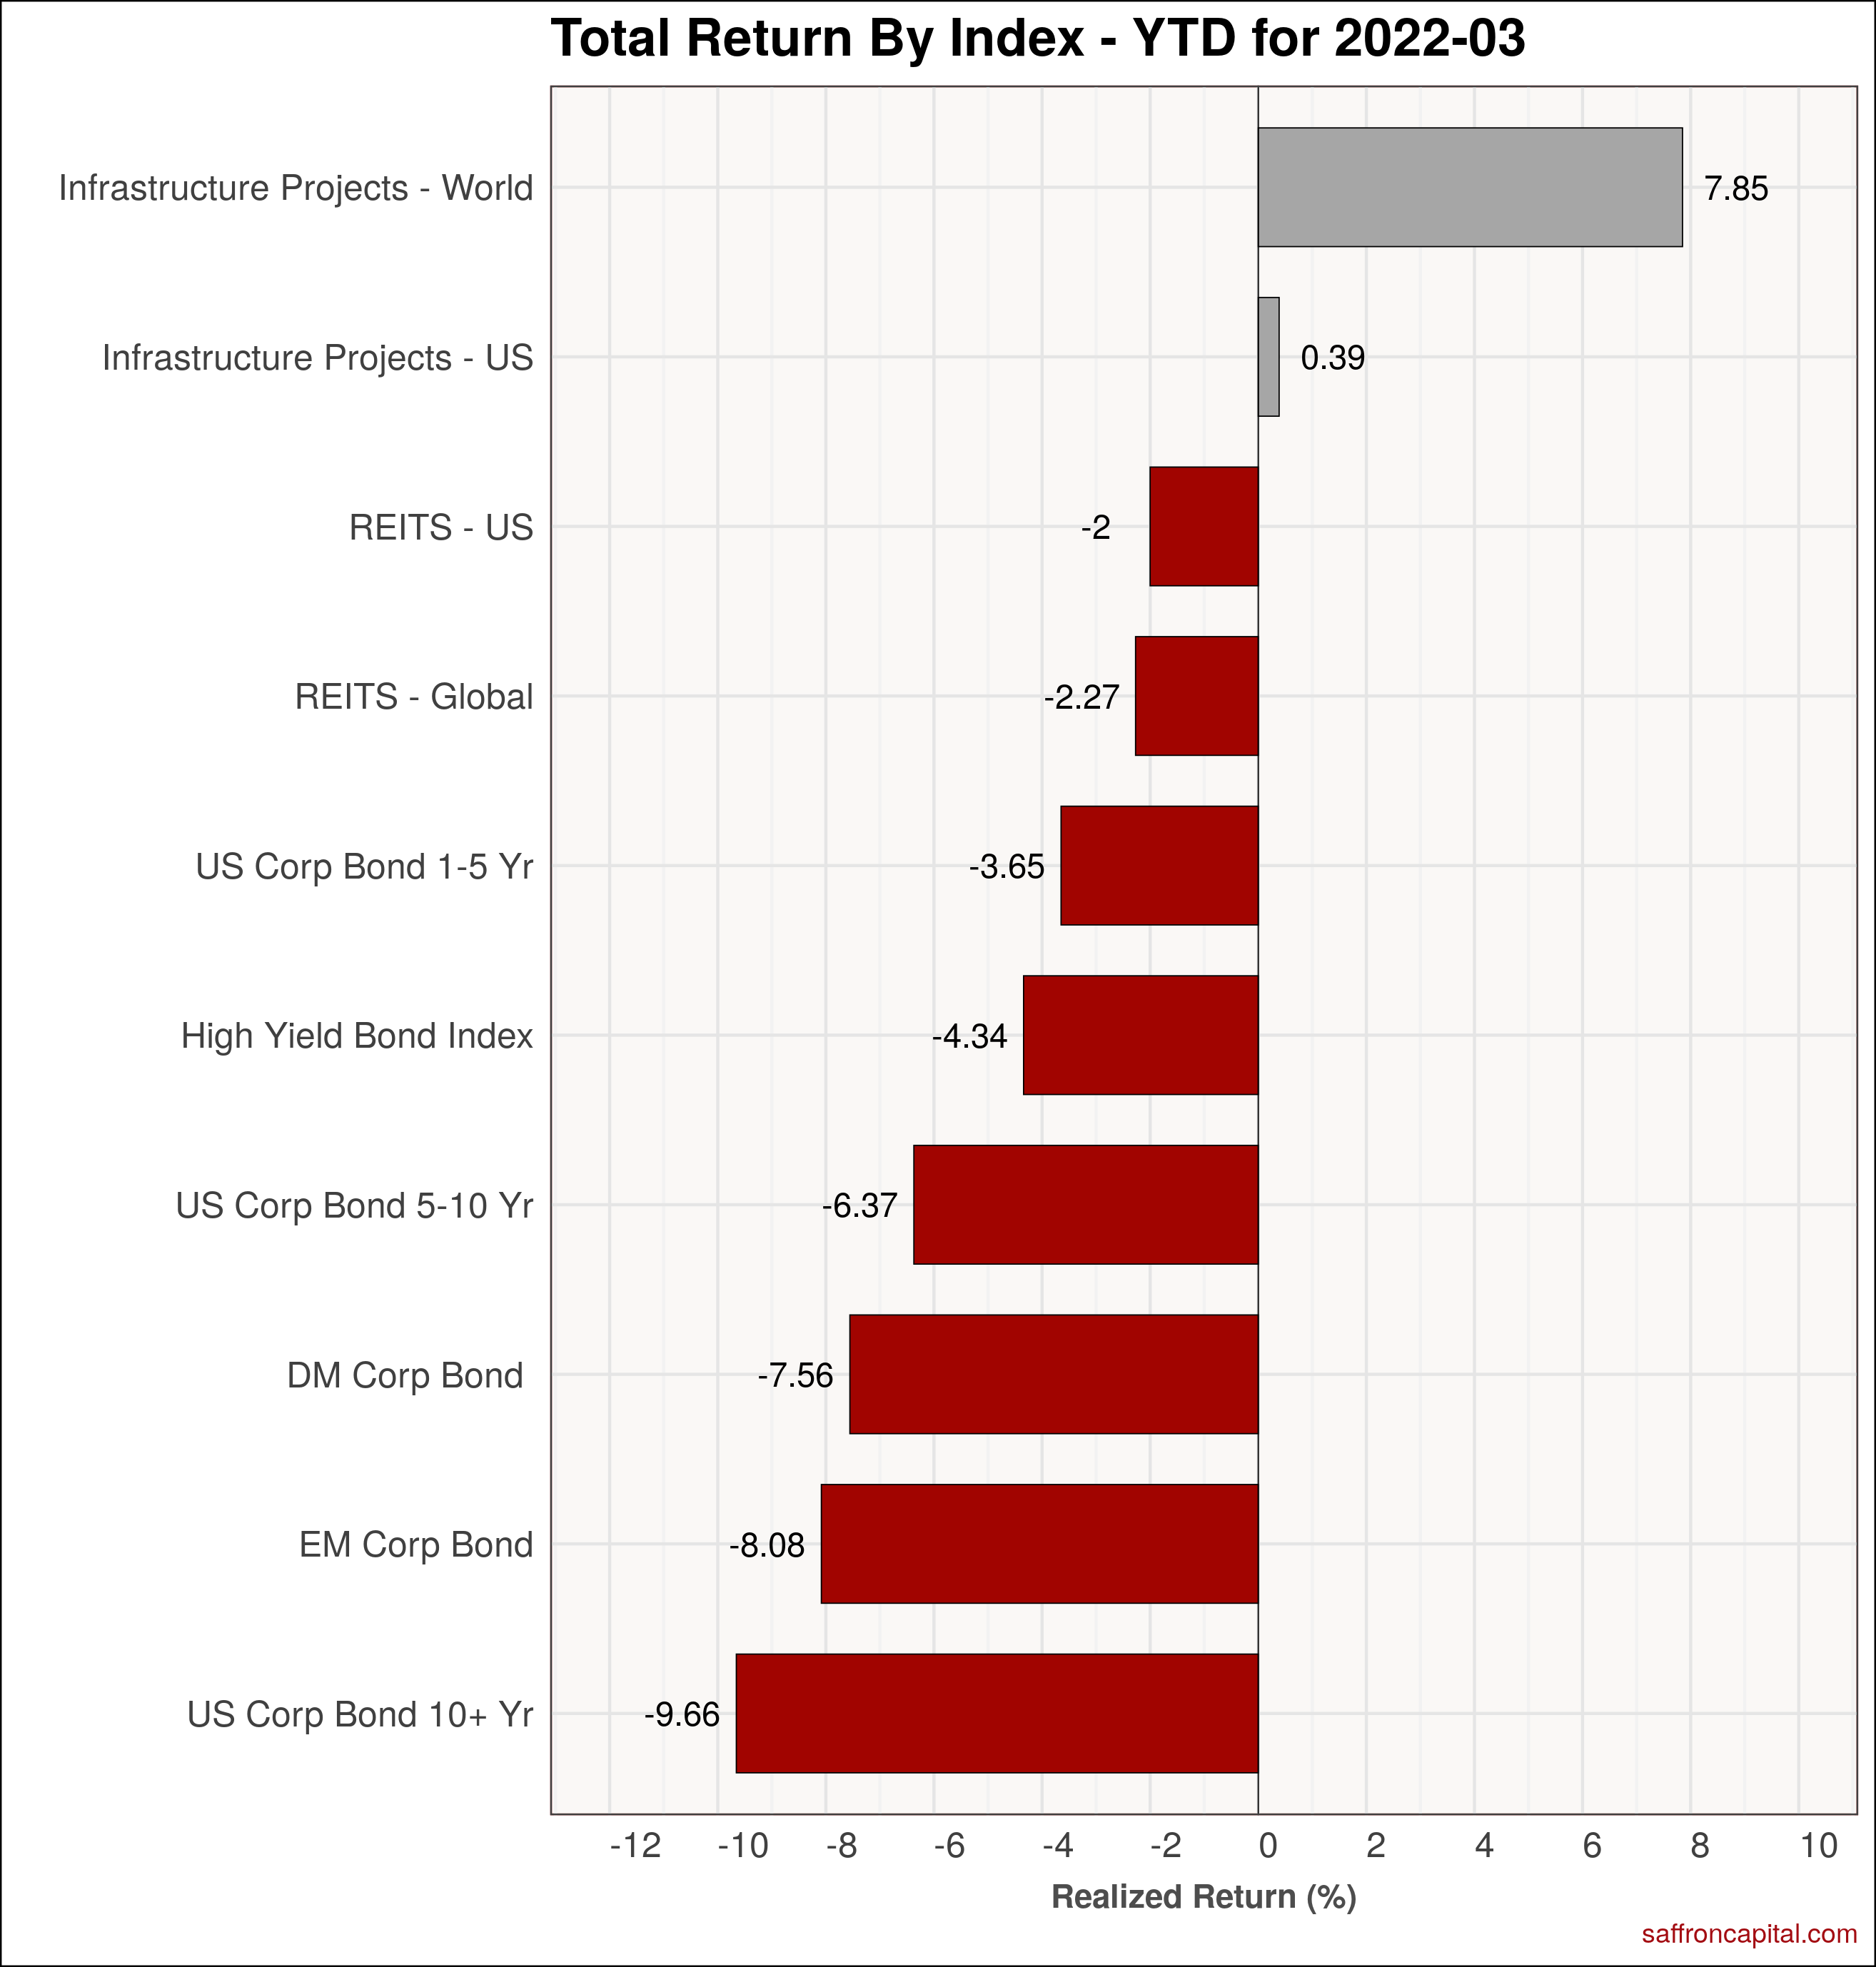
One a relative basis, corporate bonds did better with High Yields (-0.65%) down only modestly. US and global infrastructure project bonds (+8.9% and +9.7%) turned in strong returns. Year-to-date, World Infrastructure Projects (+7.85%) have done well, while US Infrastructure projects (+0.4%) lag international projects but have avoided red ink.
Click to enlarge
Commodities
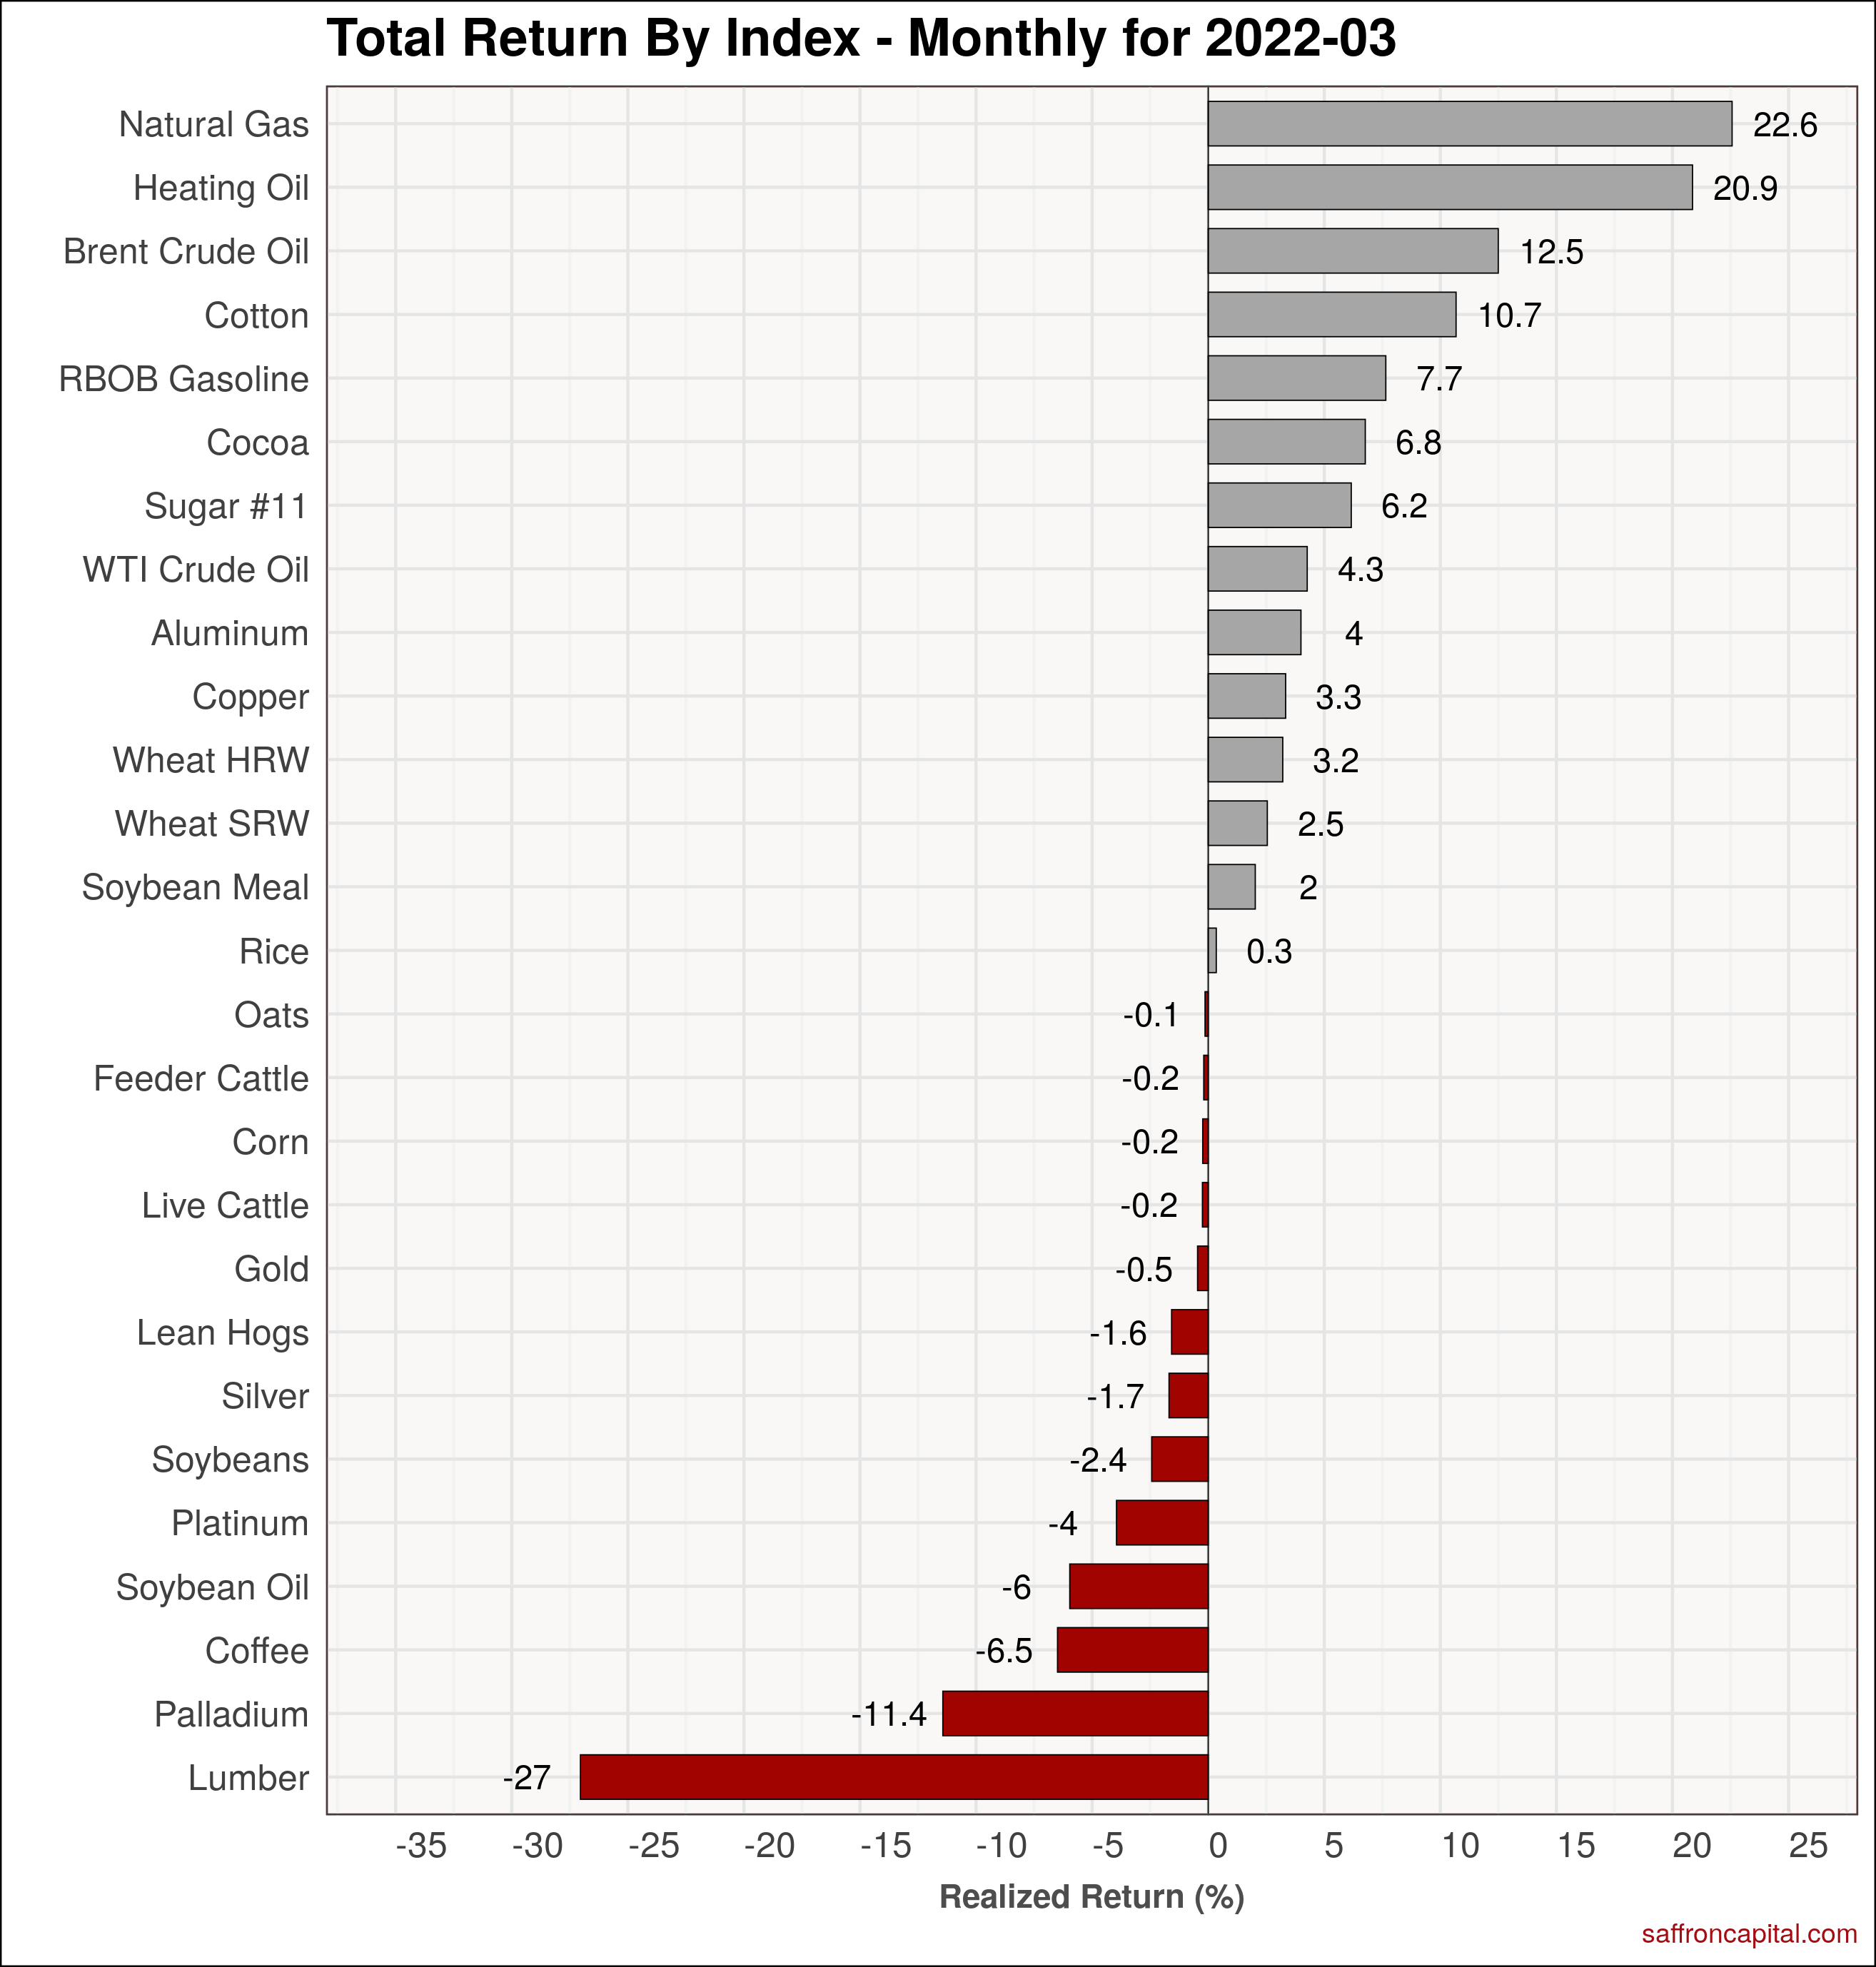
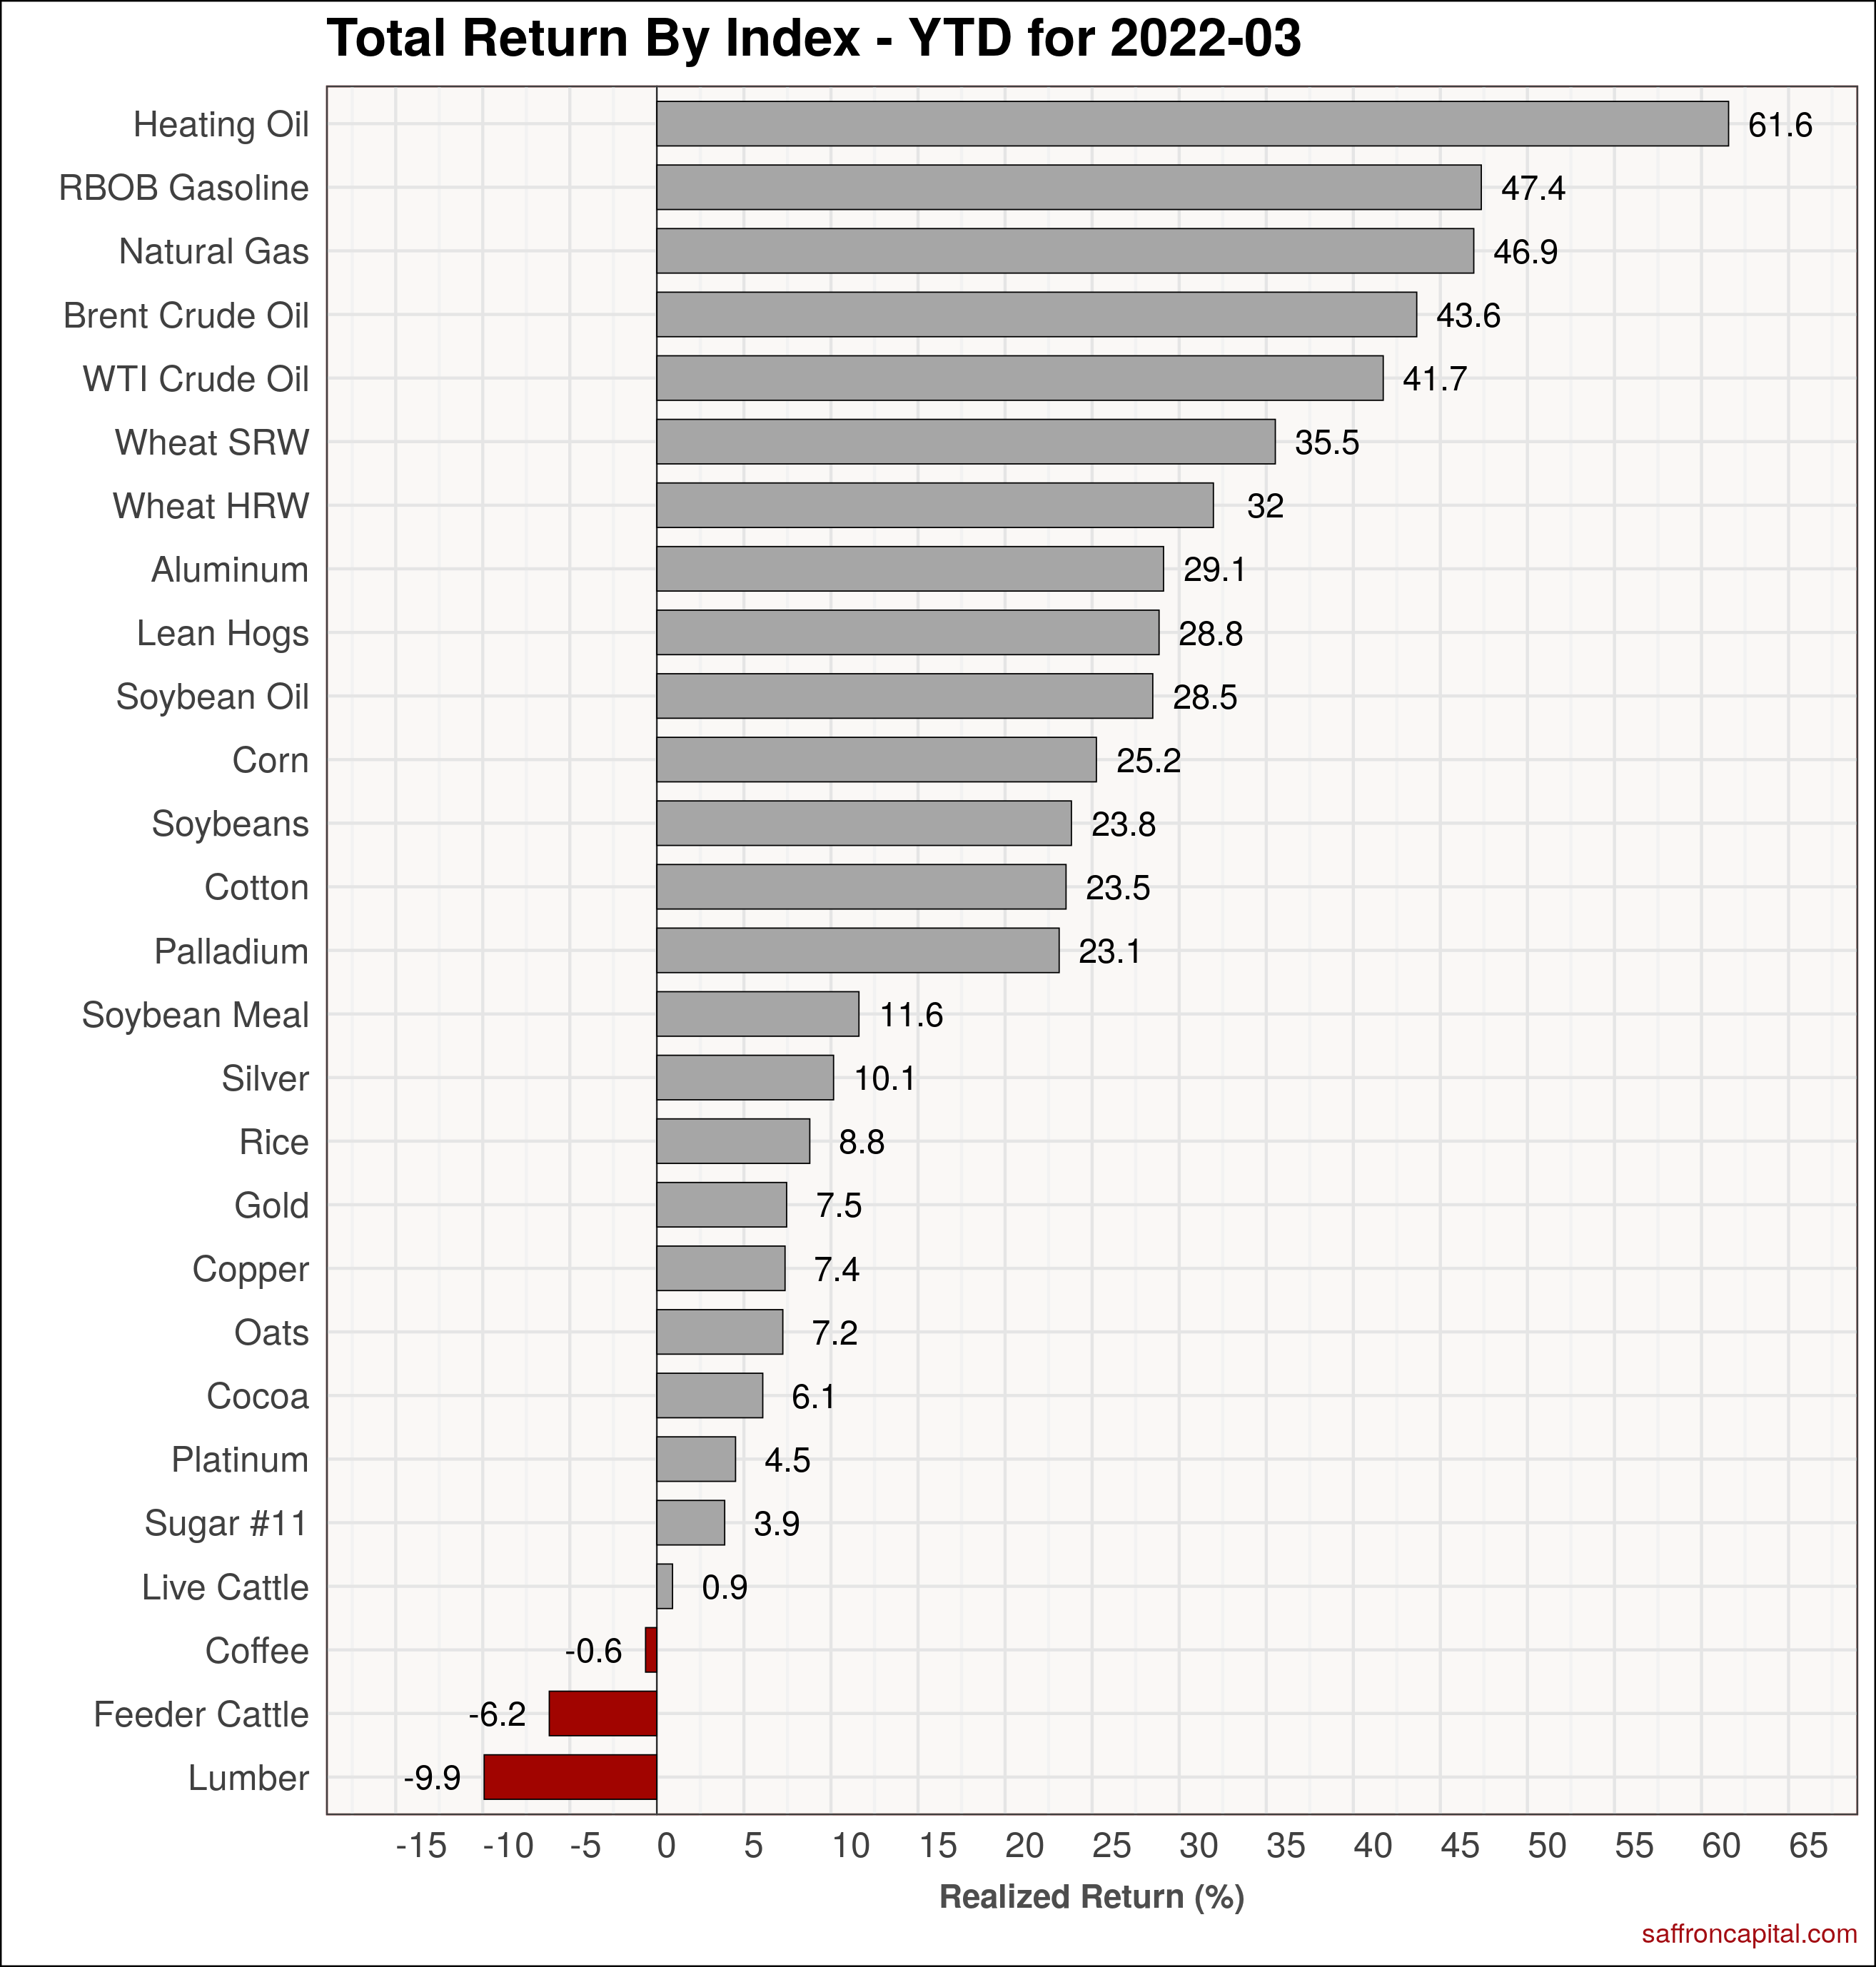
Next, the influence of Russia on markets is evident in the monthly return for natural gas (+22.6%), diesel/heating oil (+20.9%), aluminum (4.0%) and wheat (+3.02%). Lumber (-27%) has dropped as forward purchases for spring construction have abated. Since teh first of the year, heating oil (61.6%) and automotive gasoline (+47.4%) top the charts.
Click to enlarge
Currencies
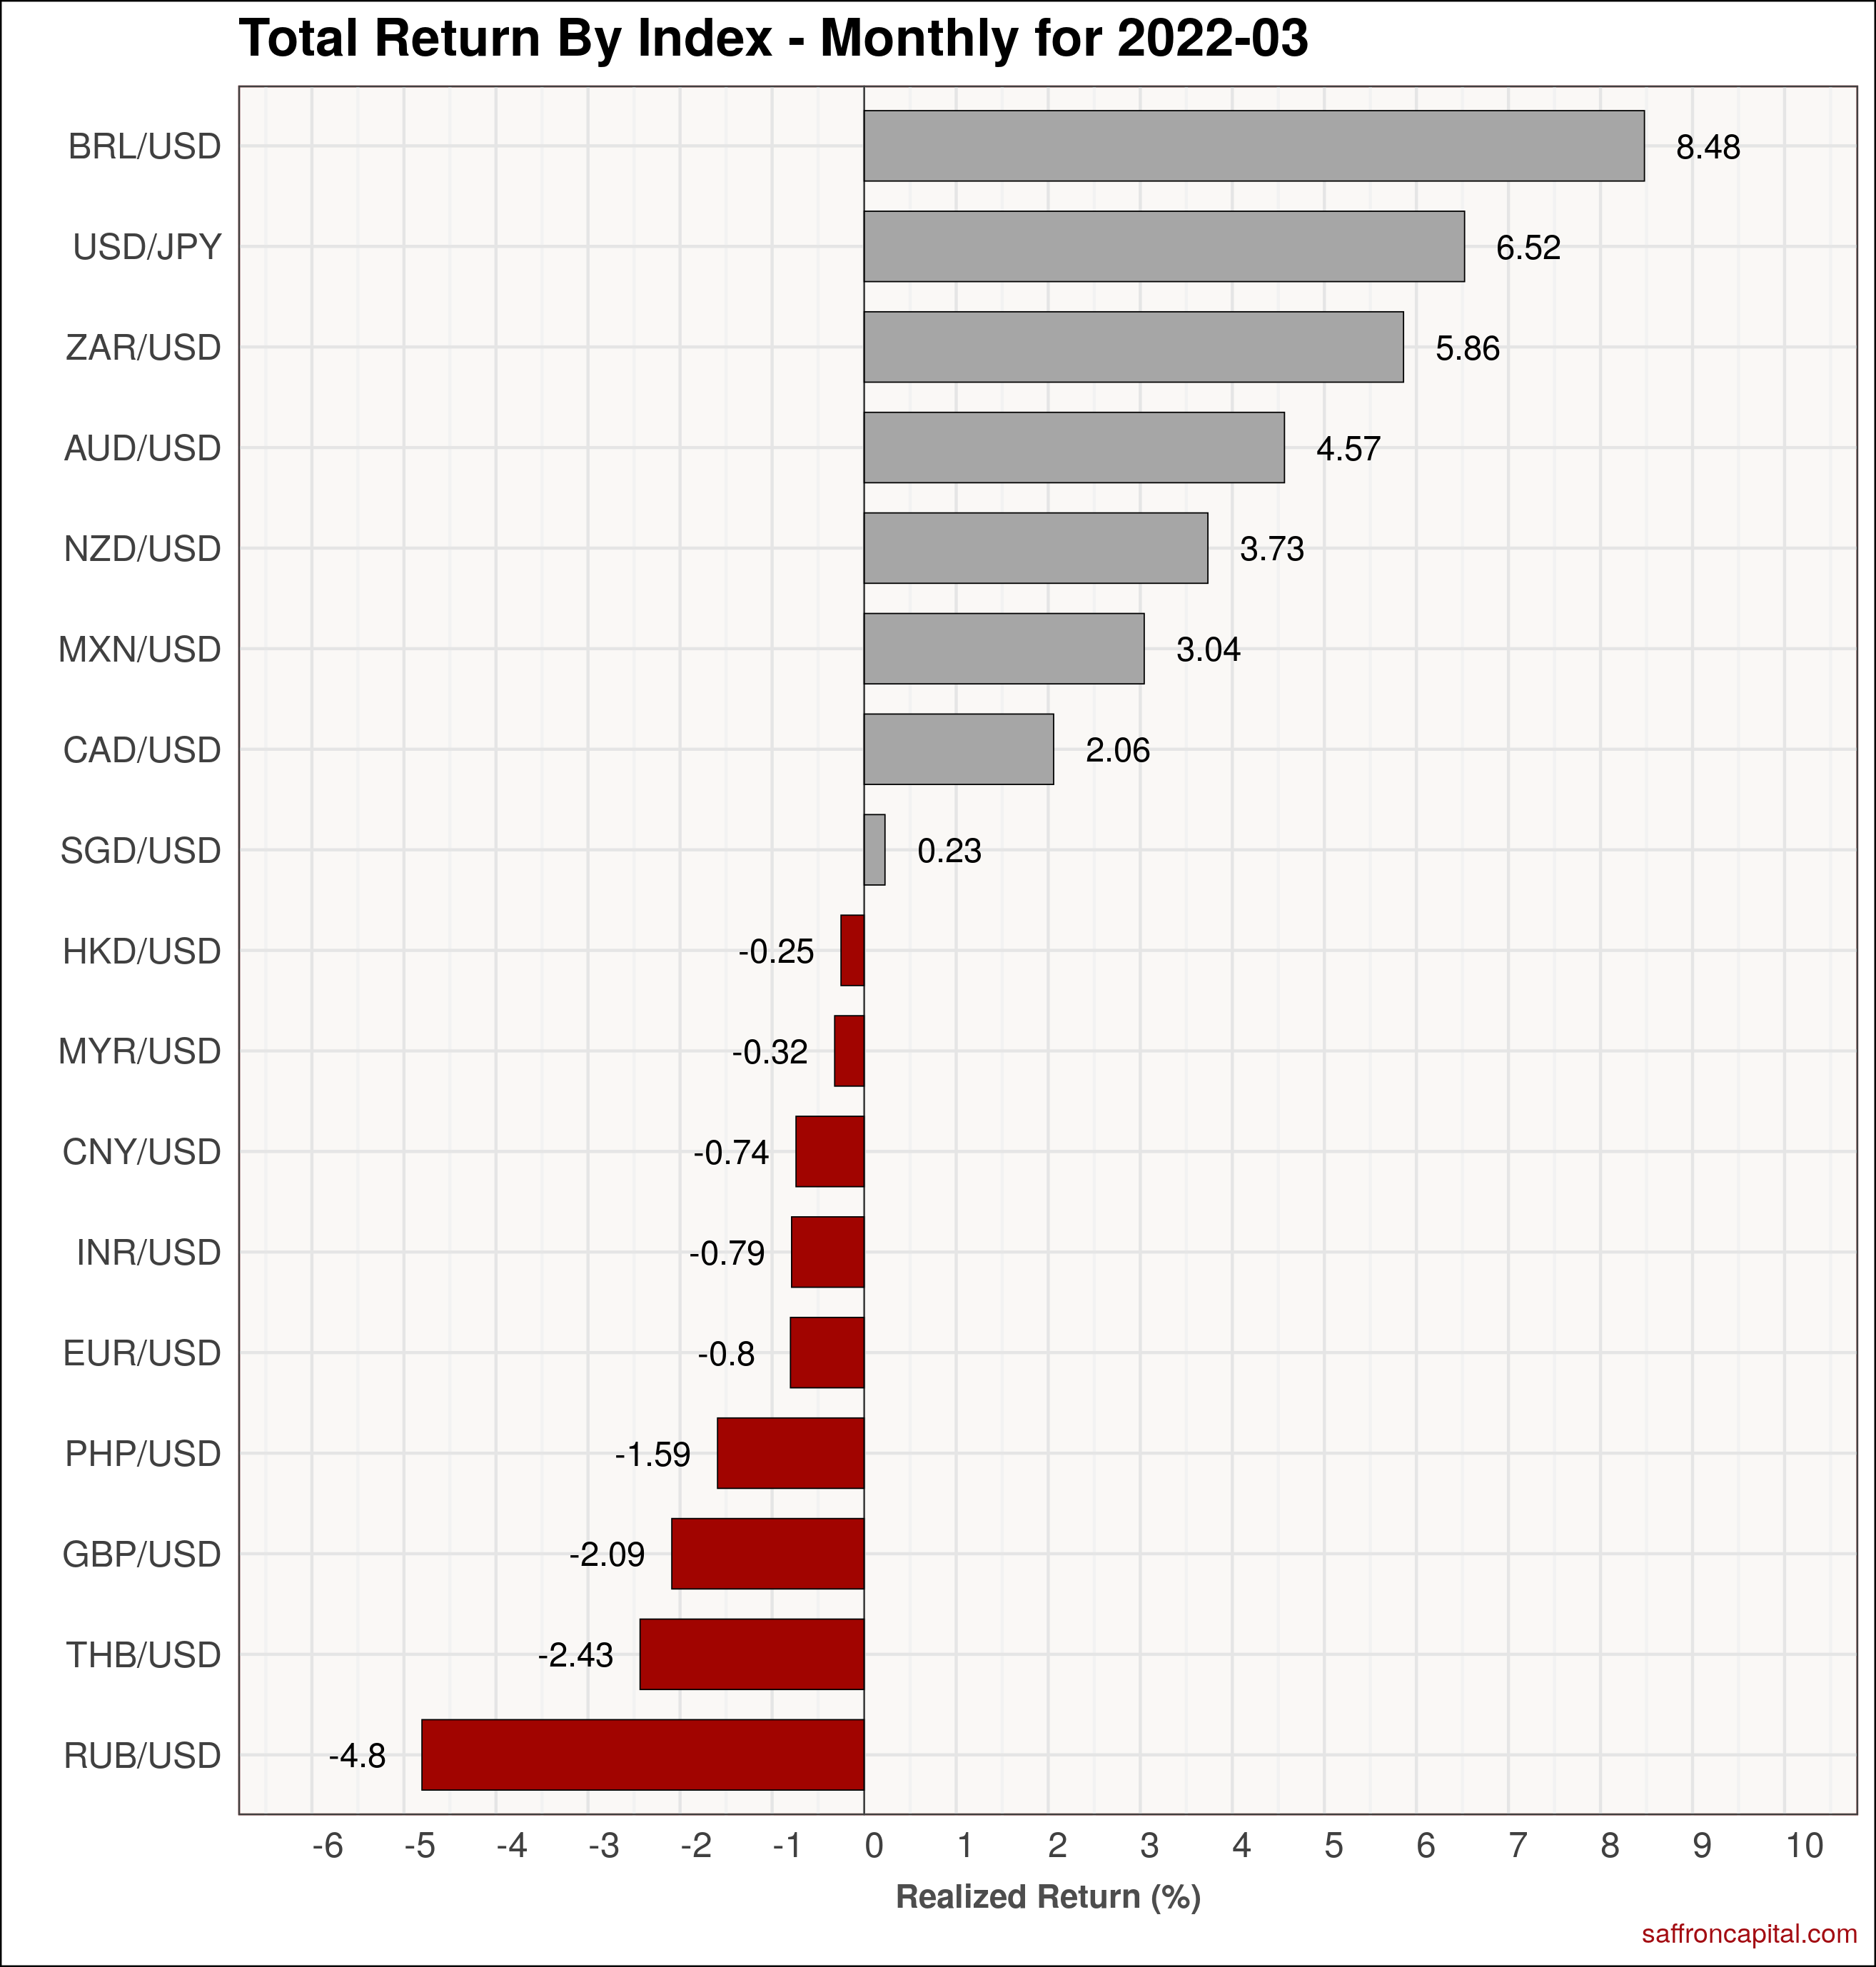
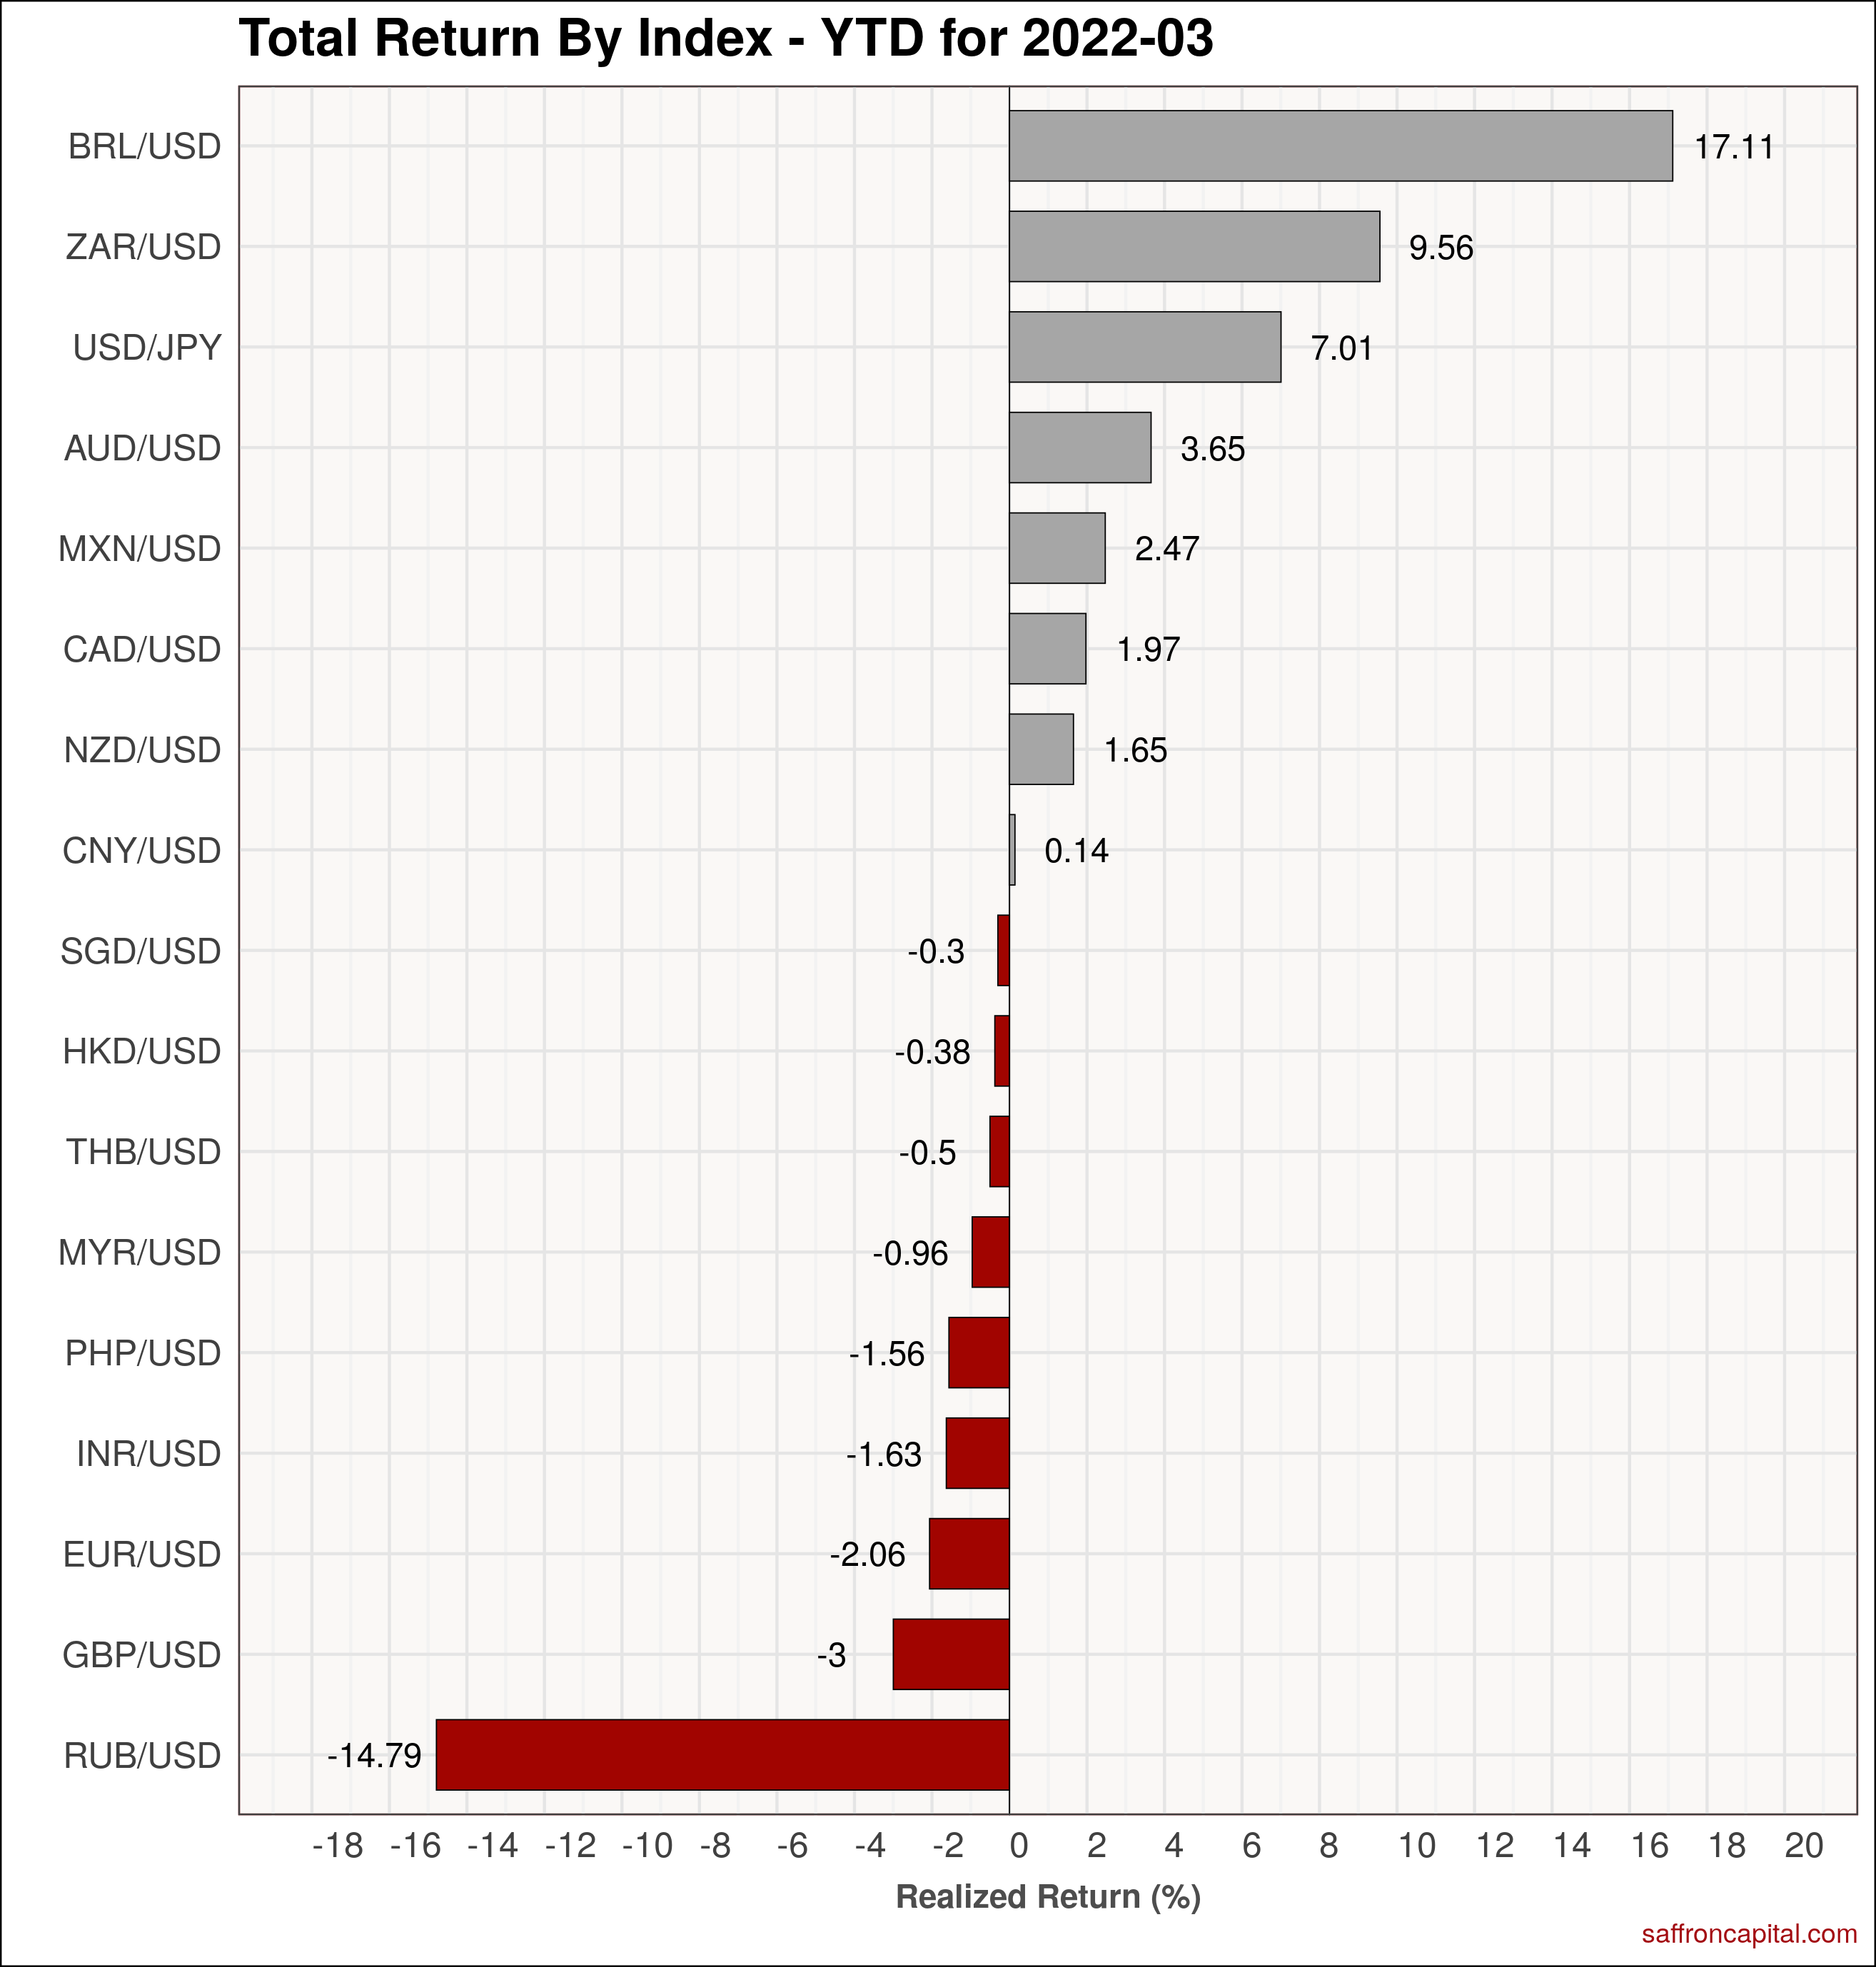
The Russian Ruble (-4.8%) was the currency that fell the most in March, while the Brazilian real (+8.5%) topped the chart for a this month. Since January, the Ruble (-14.5%) has fallen the most, while the Brazilian Real (+17.1%) has appreciated the most versus the US Dollar.


