The second quarter earnings season ((2Q.2022) has just begun. We share the latest earnings forecasts for the S&P 500 index.
Market Context
Return Profile
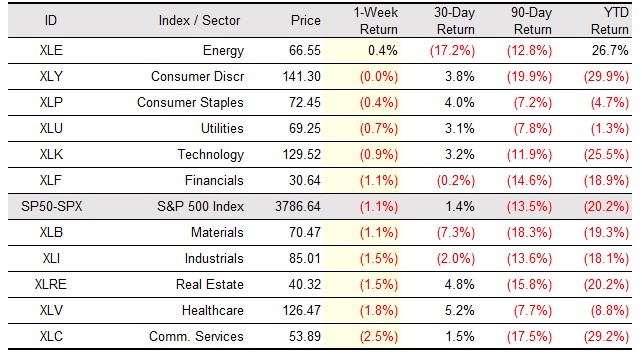
Prices and returns for the S&P 500 index are profiled at right. In the second quarter, the benchmark fell 10 out of 12 weeks. The year-to-date drawdown in stocks (-20.2%) is severe and consistent with the basic revaluation of assets. The strongest sectors at mid-year are Energy (+26.7%), Utility (-1.3%) and Consumer Staple (-4.7%) shares.
Index Prices and Returns
Click to enlarge
Investment Rankings - Model Portfolio for Adaptive ETF Trading
Risk Regime
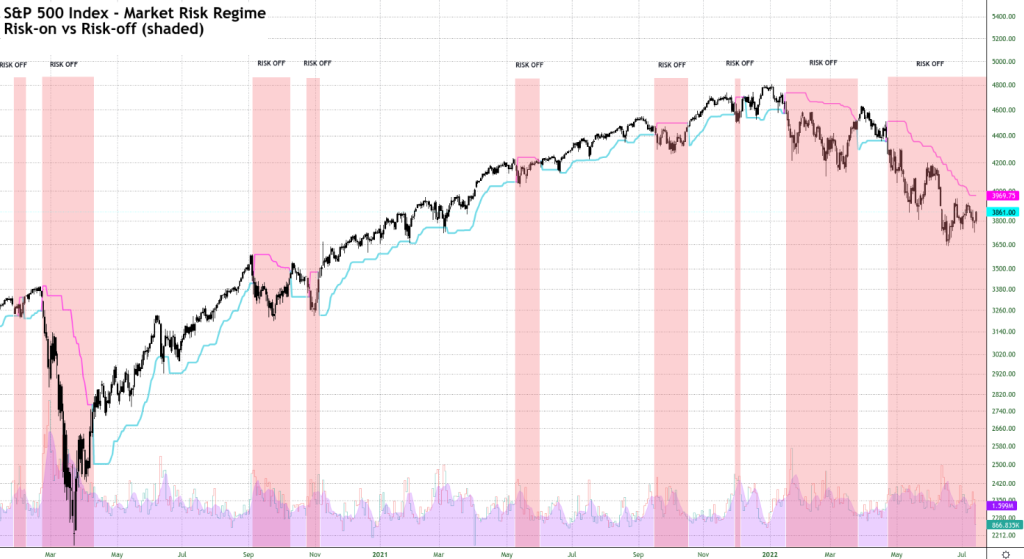
Every day, we confront the question “Is this a market to invest into?” Our objective answer uses a simple model to classify the market risk regime as `risk-off` or ‘risk-on.` The learning model uses a small number of economic indicators and time series data for the S&P 500 index. The current risk regime is risk-off, which favors the movement of funds out of risky assets and into cash for capital preservation (e.g. into money market accounts and short-term bonds). Risk-off strategies also includes structured bets to profit from falling index prices.
The plot below shows the recent risk-off events flagged by the model over time. The current risk-off period began in April 2022 and is longer than those of the recent past. In comparison, the risk-off regime of June 2008 exceeded 10 months.
Click to enlarge
Money Flows
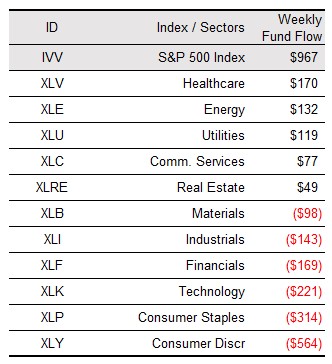
Money flow data is presented for Exchange Traded Funds (ETFs) over the last week. Growth sectors saw net outflow of $1,509 billion from the Communication Services, Consumer Staples, and Technology sectors. This was balanced by a large inflow of $967 billion into the S&P 500 Index fund. Meanwhile, an additional $547 billion was deposited into defensive sectors, including Healthcare, Energy, and Utility stocks. In total, the net movement of funds is a modest inflow of $5 billion for the week.
Money Flows, Exchange Traded Funds
Click to enlarge
Projected Earnings 2Q.2022
Earnings by Sector
A consensus forecast for annual earnings growth for the S&P 500 index in 2Q.2022 is 4.5%. The current estimate is down from 5.9% at the start of the quarter. The estimate is low when compared to the 9.3% earnings growth realized in 1Q.2022. If 4.5% is the actual growth rate of earnings for 2Q.2022, then it will be the the lowest growth rate since 4Q.2020 (+4.0%).
Typically, the consensus estimate underestimates actual earnings. The average error is as high as 6%. As a result, we anticipate a modest uplift in earnings growth above 4.5% as the actual results come in, similar to what we saw in 1Q.2022. Currently, less than 5% of the companies in the S&P 500 Index have reported.
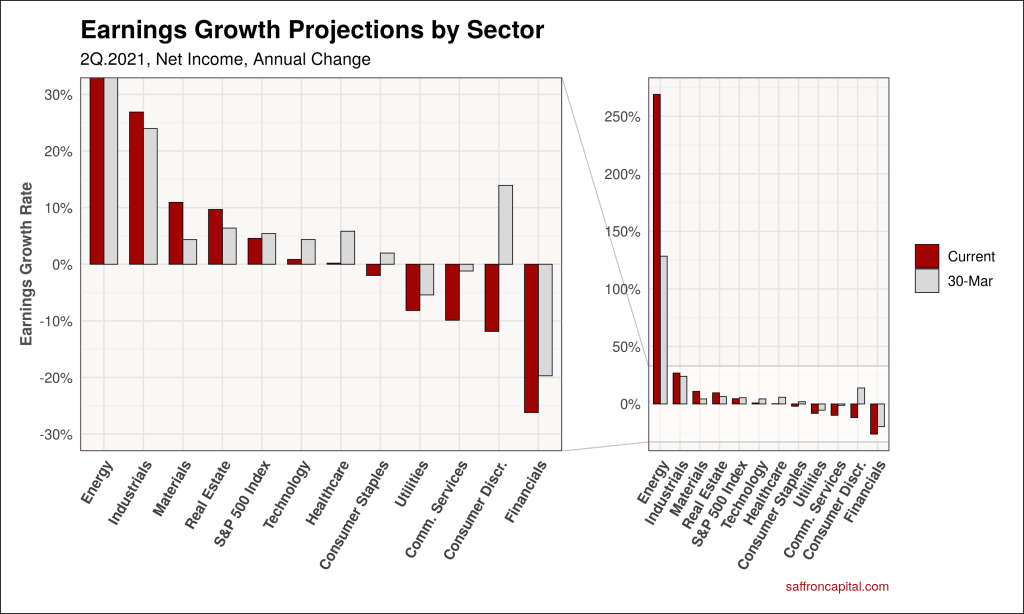
The sectors with the highest estimated earnings growth include the Energy (+269.0%), Industrial (+26.9%) and Material (+10.9%) sectors. Laggards include the Financial (-26.2%), Consumer Discretionary (-11.9%), and Communication Service (-9.9%) sectors.
The chart below shows changes in sector earnings estimates since March 30.
Click to enlarge
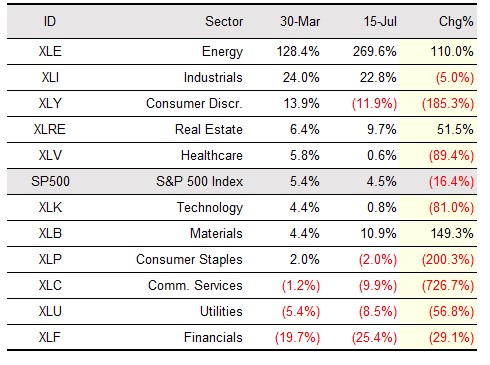
The data table at right also shows changes in growth projections by sector for the second quarter. The Energy (XLE), Materials (XLB), and Industrial (XLI) sectors have the largest positive changes in growth estimates. In contrast, Communication Services (XLC), Consumer Staples (XLP), and Consumer Discretionary (XLY) sectors had the largest declines in expected earnings growth.
At the index level, we see that earnings for the S&P 500 fell by 16.4% during the quarter. That is larger than the downward revision experienced in the first quarter.
Earnings Growth Rate By Sector, 2Q.2022
Click to enlarge
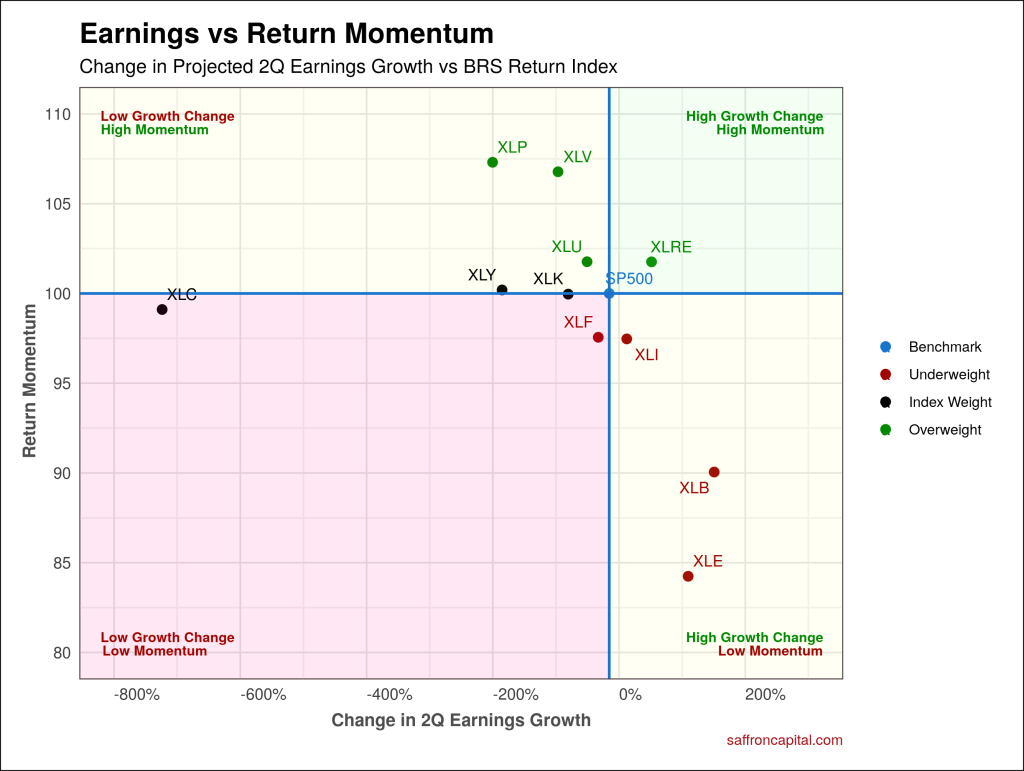
Sector Earnings vs Return Momentum
The next chart shows changes in earnings by sector versus returns by sector. Normally we see high return momentum in sectors with positive changes in earnings outlooks. Currently, that is not the case. Instead, we see high return momentum in defensive sectors like Consumer Staples (XLP), Healthcare (XLV) and Utilities (XLU). Surprisingly, investors are gravitating toward `safe haven` sectors with declining or low earnings growth. Equally surprising, we see low return momentum for high growth sectors like Energy (XLE) and Materials (XLB). This reflects the recent drop in commodity prices given increased recession fears. The result is a negative slope to the data, which is not typical. We don’t allocate funds to any sector at present given the risk-off market regime.
Click to enlarge
Using 2Q Earnings Projections To Assess Sector Value
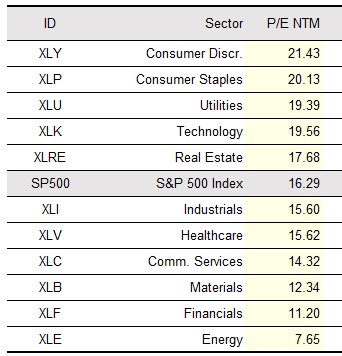
Next, we extend the sector earnings data to generate traditional value metrics to assess the relative value of the different market sectors. For example, the price/earnings (P/E) ratio uses earnings forecasts for the next twelve months (NTM) to compare the sector portfolios.
Value Metrics
Click to enlarge
The table at left lists the P/E NTM ratio for each sector. You quickly see that 6 of 11 sectors have discounted ratios or relative values versus index, while 5 sectors have relatively high P/E values. The average PE/E NTM for the S&P 500 Index over the last 5 and 10 years is 18.6 and 16.7. Hence, the index and many sectors now trade at a discount to the 10-year average.
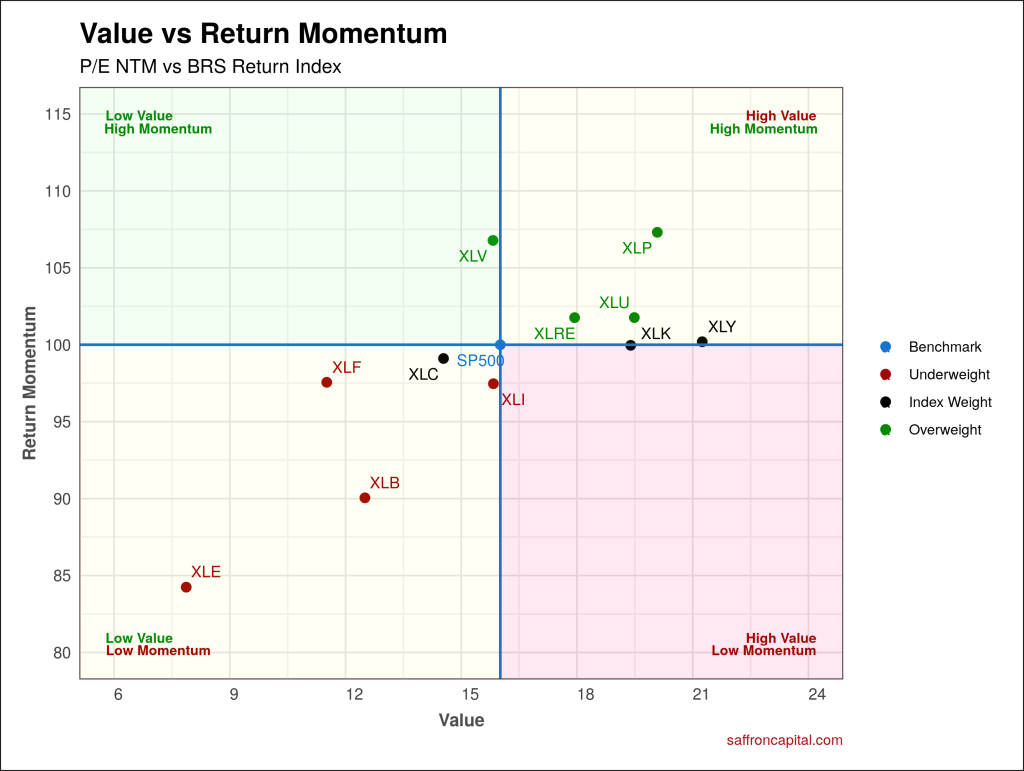
The next chart compares P/E ratios by sector to realized returns by sector. The chart shows that only one sector – Healthcare (XLV) – is attractive given low value relative to index and high return momentum. Meanwhile, again we see the defensive sectors – namely Consumer Staples (XLP), Utilities (XLU), and Real Estate (XLRE) – have high return momentum. The defensive sectors also trade at a premium to index given high relative value. Finally, we see that the lowest value
sectors – Energy (XLE), Materials (XLB), and Financials (XLF) – also have low return momentum. The result is a positively sloped chart, which is not typical. Again, we don’t allocate funds to any sector until the market risk regime shifts back to risk-on.
Click to enlarge
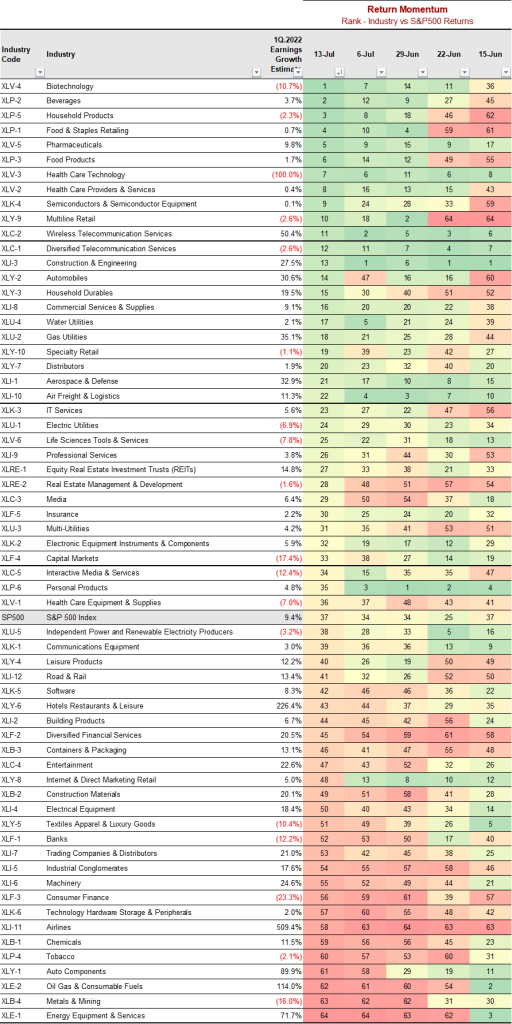
Industry Return Rankings and Earnings Forecasts, 2Q.2022
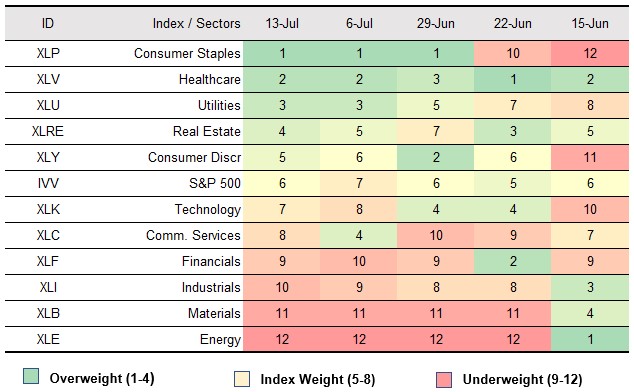
The table below consolidates our second quarter net income forecasts for 505 companies by industry. We use the GICS industry classification to create the industry portfolios. We then rank the industries using return momentum. Our model portfolio rankings over time are also provided to show which industries have persistent return strength or weakness.
Click to enlarge
Looking Ahead
During the upcoming week, 73 S&P 500 companies are scheduled to report results for the second quarter. Looking further ahead, analysts expect earnings growth of 9.1% for 3Q.2022, and 9.0% for 4Q.2022. For all of 2022, analysts predict earnings growth of 9.9%. These are significant growth rates and highlights the importance of the second quarter earnings releases. First, actual earnings will validate if the second half estimates are reasonable. Perhaps more important, they will refocus investors on company, industry, and sector fundamentals when attention has been dominated by macro market issues.
See the Signals
Contact us if you have questions about this report and how our model portfolios can help you. Looking to improve investment performance with real-time risk management? Contact us here.
Important Notice
Saffron Capital provides capital market research and insight reporting for informational and educational purposes only. The report does not constitute a solicitation to buy or sell securities. We only provide investment advice to people or entities subject to an advisory agreement, a client-approved plan for investing, and strategies for capital preservation.
Caution Regarding Forward-Looking Statements Any opinion about future events (such as market and economic conditions, company performance, security returns, or future security offerings) are forward-looking statements. Forward-looking statements, by definition, involve risk or uncertainties and do not reflect actual knowledge about the future. Forward projections are valid inputs in any planning or investment process. However, they are not a guarantee of future returns or investment performance.


