March 2023 Returns and Asset Performance
April 2, 2023
ETF Fund Flows
May 18, 2023Major Asset Classes
April 2023
Performance Comparison
Introduction
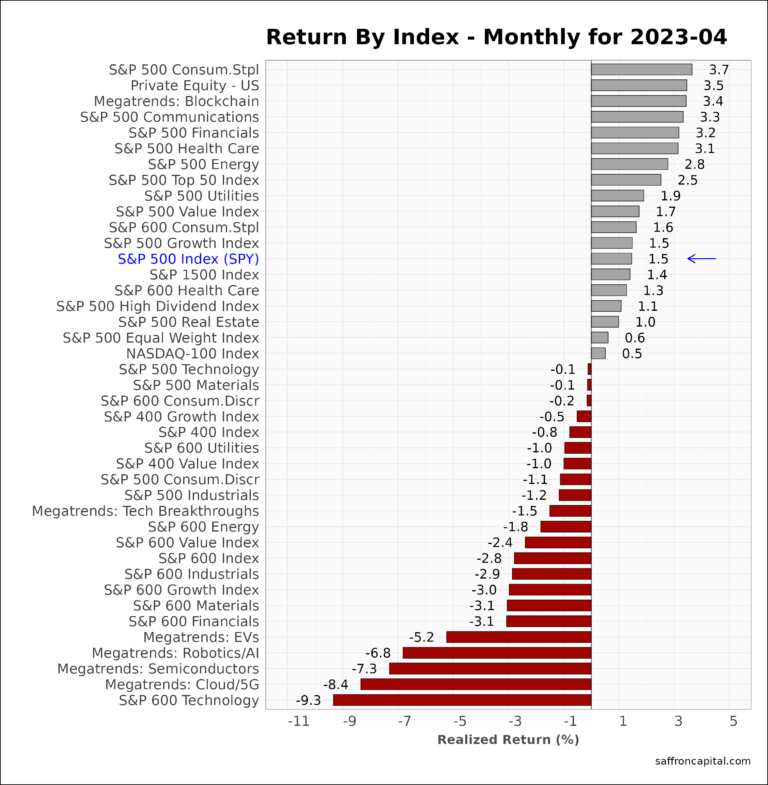
April 2023 market returns were favorable for large cap stocks, but were less rewarding for many other asset classes. For example, total returns for the S&P 500 Index (+1.5%) and international large cap stocks (+2.8%) beat the NASDAQ-100 index (-0.1%) and emerging market (-0.4%) equities. Losses were most evident in megatrend sectors like cloud computing (-8.4%), semiconductors (-7.3%), AI/robotics (-6.8%), and electric vehicles (-5.2%). Meanwhile, returns for the Aggregate Treasury Bonds Index (-0.58%) were lackluster, as were the returns for Corporate Bonds (+0.2%). Finally, the US Dollar Index (-1.8%) fell in April, supporting positive returns in precious metals, notably platinum (+9.5%), as well as foods, including Sugar, (+21.3%), Coffee (+11.3%) and Cocoa (+8.2%).
The following analysis provides a visual record of April 2023 returns across and within the major asset classes. The report is provided to facilitate portfolio performance benchmarking.
US Equities
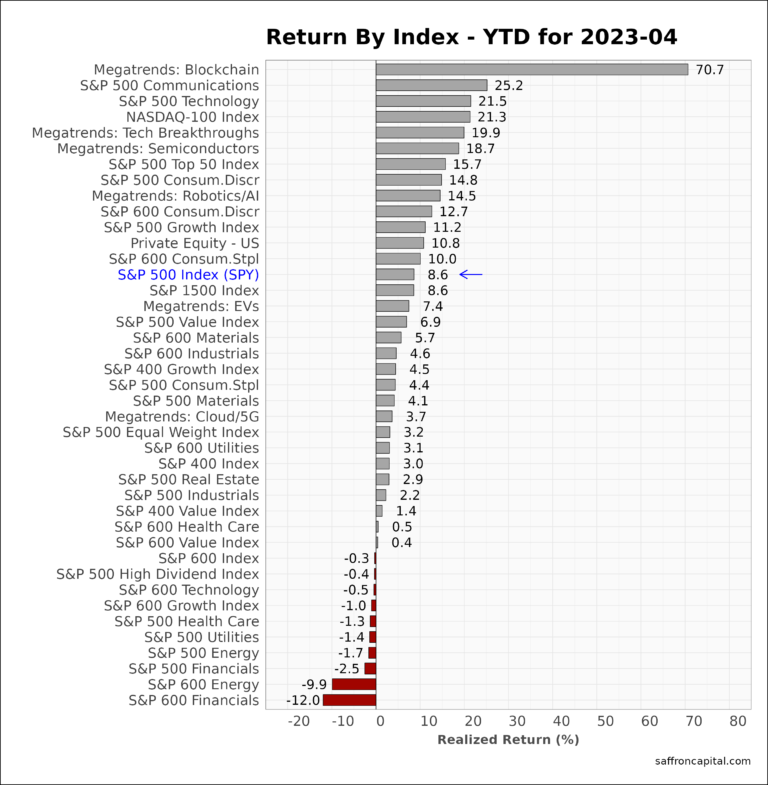
Top sector performers in April were large cap Consumer Staples (+3.7%), Communications (+3.3%), Financials (+3.2%), and Healthcare (3.1%). At the same time, large cap value (+1.7%) outperformed large cap growth (+1.5%). Small cap Technology (-9.3%), Financials (-3.1%), and Materials (-3.1%) were the weakest sectors. Year-to-date, the S&P 500 index (+8.6%) continues to perform well, thanks to strong returns in large cap Communications (+25.2%), Technology (+21.45%) and Consumer Discretionary (+14.8%) sectors. Small cap sectors have been the most disadvantaged asset group year to date given tighter lending conditions and this is evident in the red ink below.
Developed Market Equities
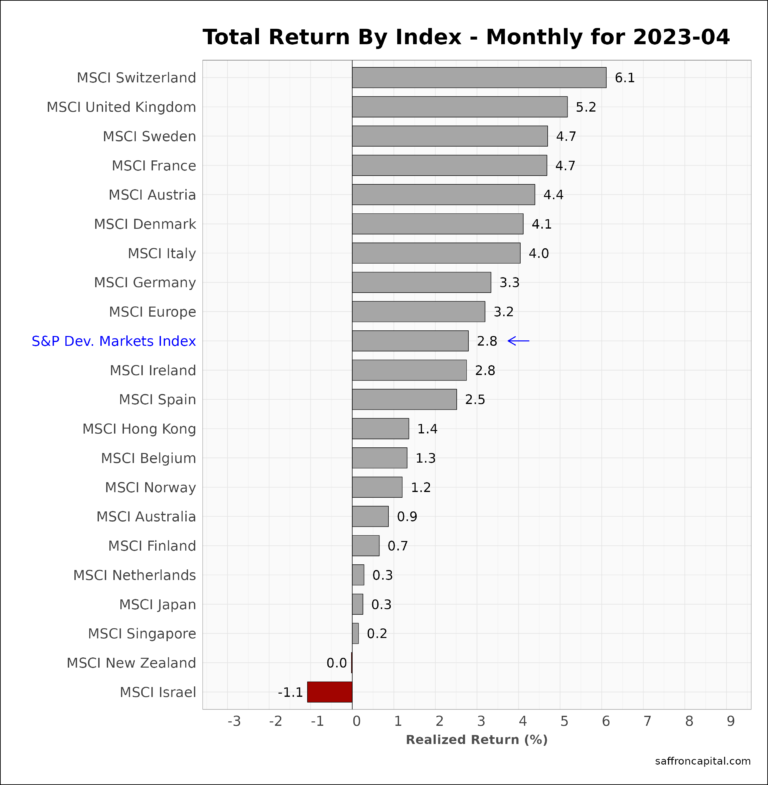
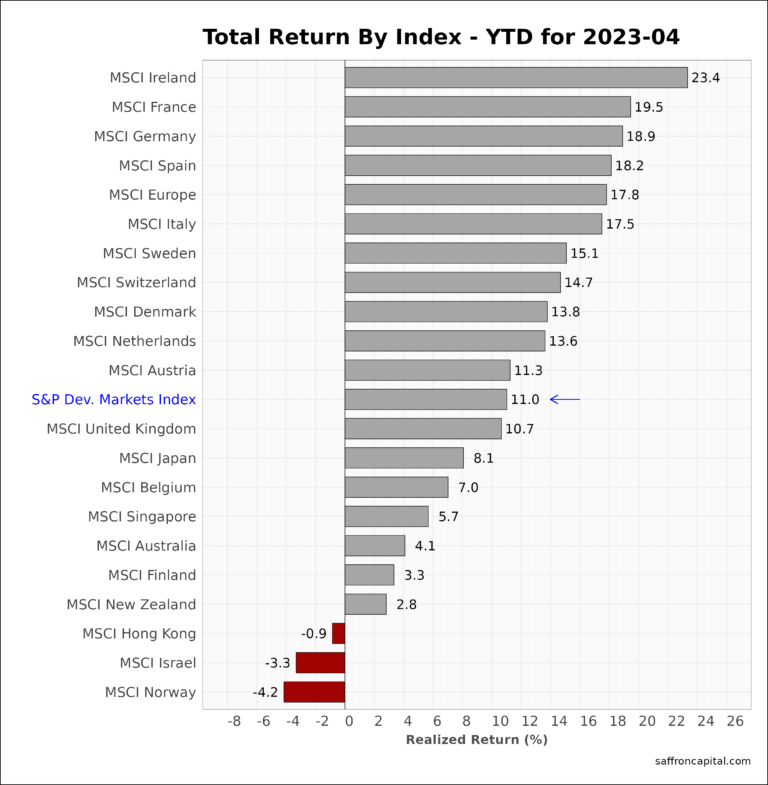
international developed markets (+2.8%) continue to beat US equities for the third month straight. Specifically, the MSCI Europe index (+3.2%) easily beat US equities given strong returns in Switzerland (+6.1%), the UK (+5.2%) and Sweden (+4.7%). The weakest developed markets were in Israel (-1.1%), New Zealand (0%), and Singapore (+0.2%). Year-to-date, the Developed Markets Index (+11.0%) now leads US equities by 240 basis points, and benefits from strong returns in Ireland (+23.4%), France (+19.5%) and Germany (+18.9%).
Click to enlarge
Emerging Market Equities
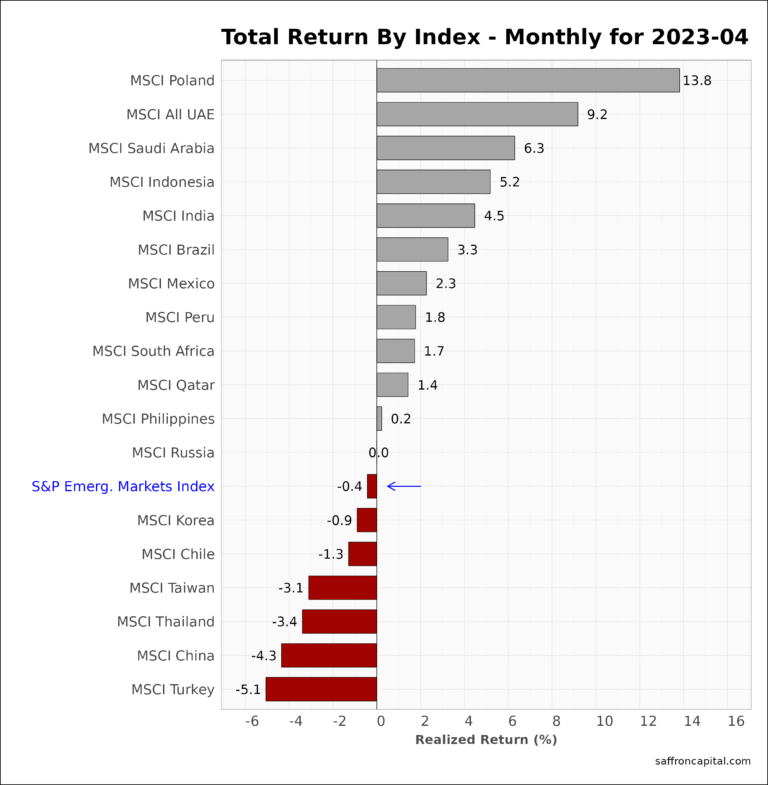
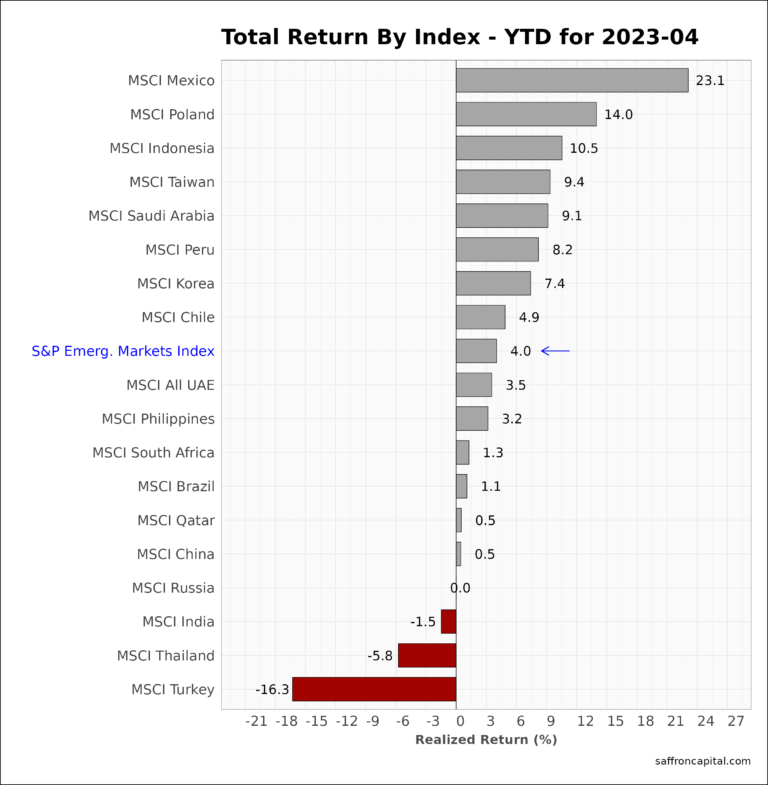
April 2023 returns for the S&P Emerging Markets Index (-0.4%) trailed the US and other developed markets. However, strong returns were realized in Poland (+13.8%), the UAE (+9.2%) and Saudi Arabia (+6.3%). The weakest performers were Turkey (-5.1%), China (-4.3%) and Thailand (-3.4%). The rapid growth economies of India (+4.5%), Brazil (3.3%) and Mexico (+2.3%) also performed well. Year-to-date performance for emerging markets (+4.0%) reflects broadly divergent results. Mexico continues to lead (+23.1%), followed by Poland (+14.0%) and Indonesia (+10.5%). Indian shares for the year (-1.5%) are yet to match their prior high water mark.
Government Bonds
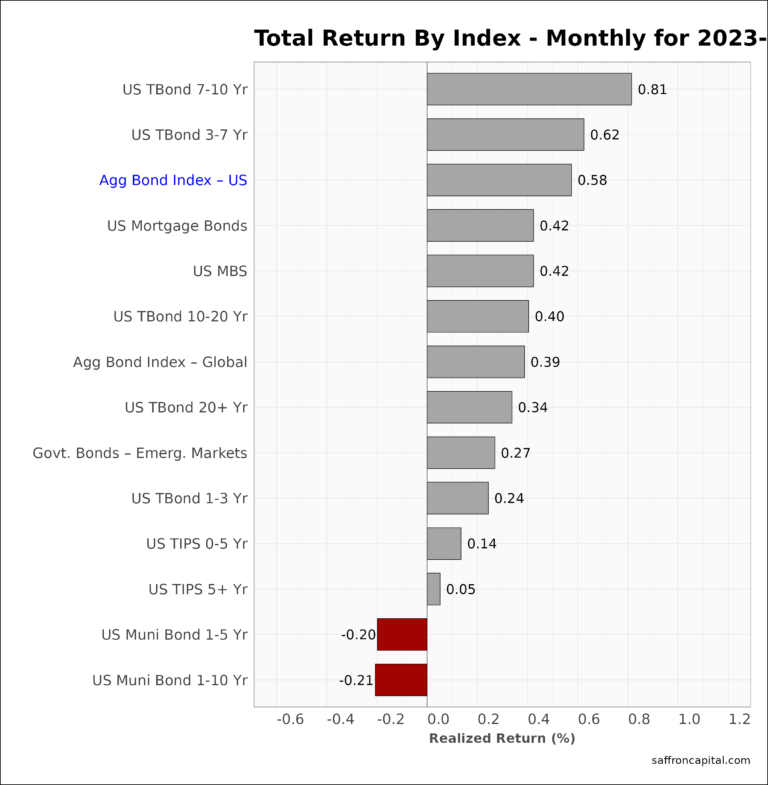
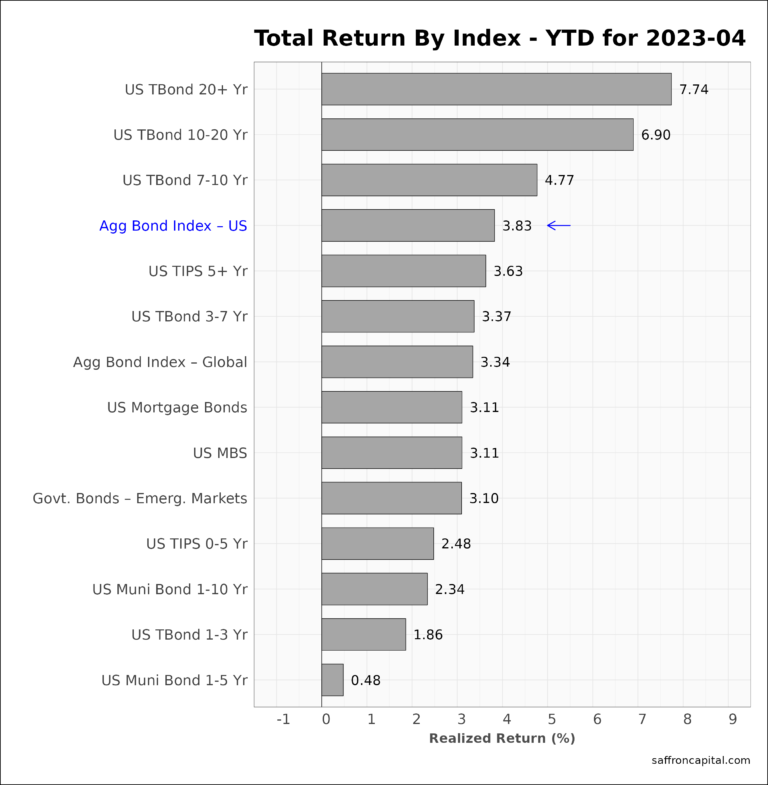
April price returns for government bonds (+0.58) with 7-10 year bonds (+0.81%) at the top of the leader board. Meanwhile, the global Aggregate Bond Index (+0.39%) lagged US Treasuries. Since the start of the year, the US aggregate index (+3.83%) has lagged equities, but long-duration bonds (7.74%) have proven to have competitive returns. It is also worth noting the international sovereign bonds (+3.34%) lag US Treasuries total returns by 49 basis pointsApril
Corporate & Infrastructure Bonds
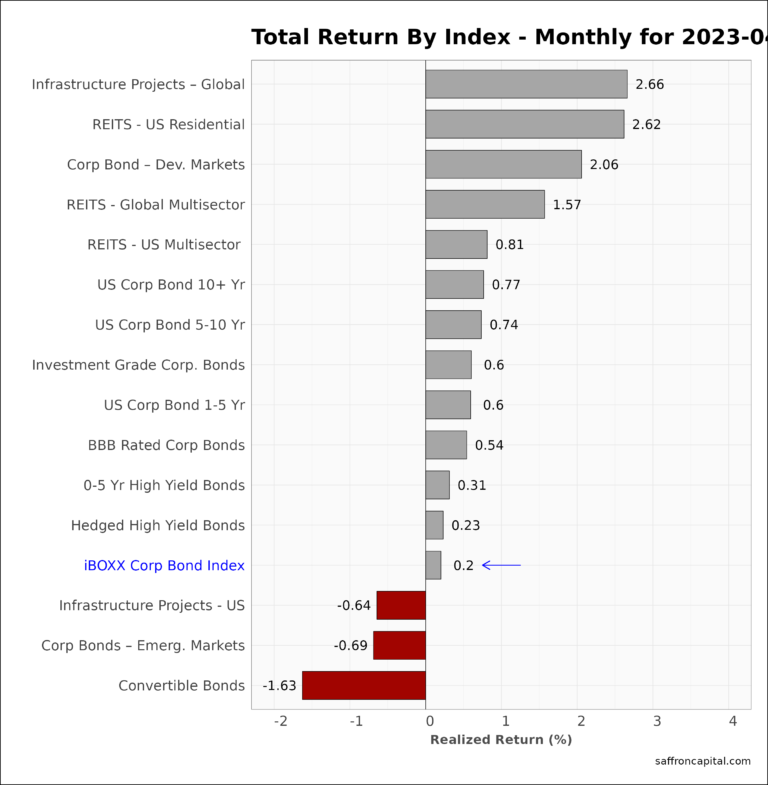
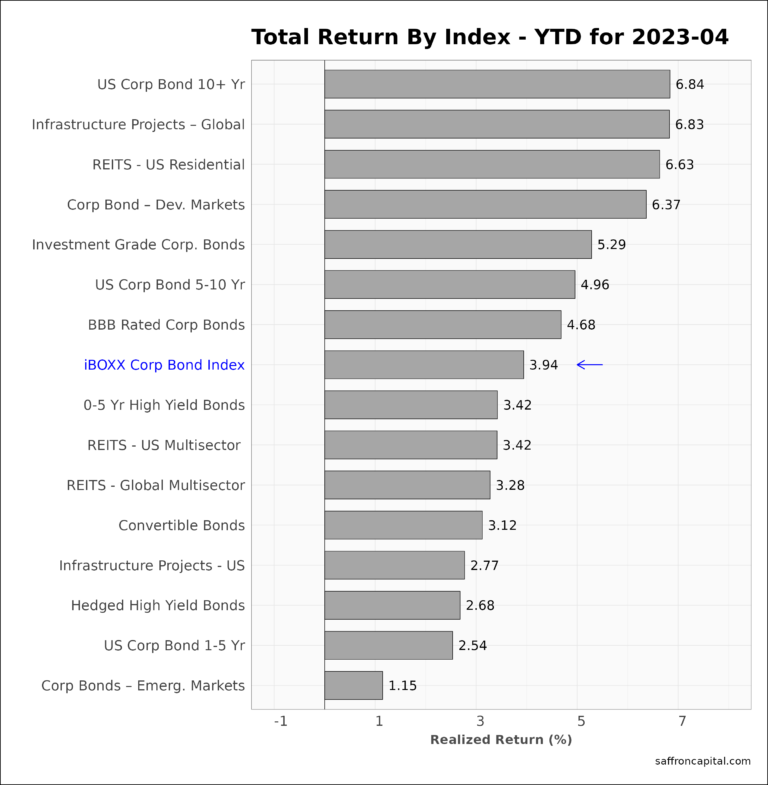
The iBoxx Corporate Bond Index (+0.2%) had modest returns in April. Global infrastructure project bonds (+2.66%) and US Residential REITS (+2.62%) were the exceptions. Meanwhile, losses were evident in Convertible Bonds (-1.63%) and Emerging Market Corporate Bonds (-0.69%). On a year to date basis, the best home among the corporate bond assets have been long-duration bonds (+6.84%), Global Infrastructure Bonds (+6.83%) and US Residential REITS (+6.63%).
Commodities
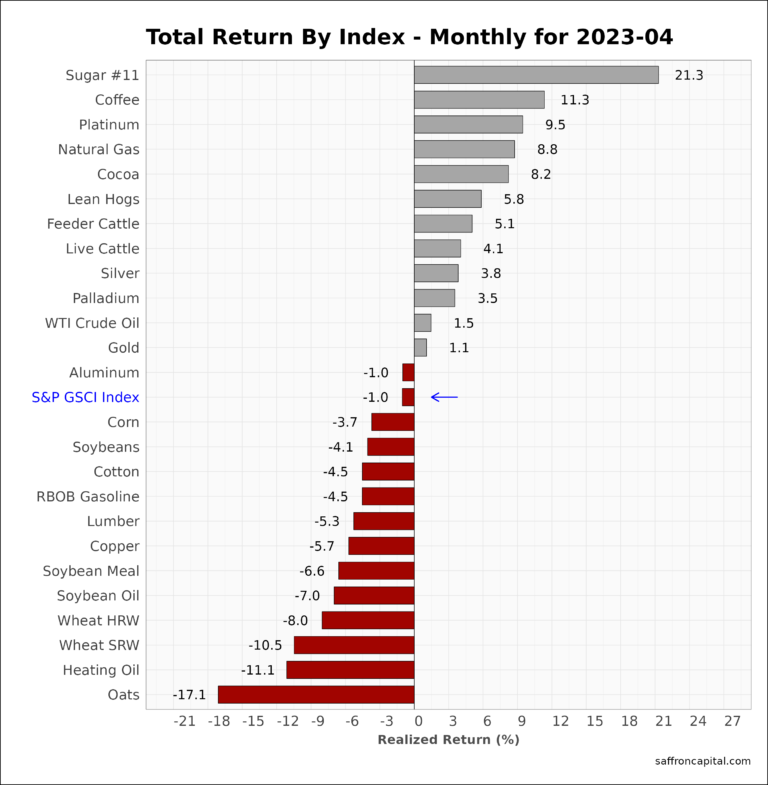
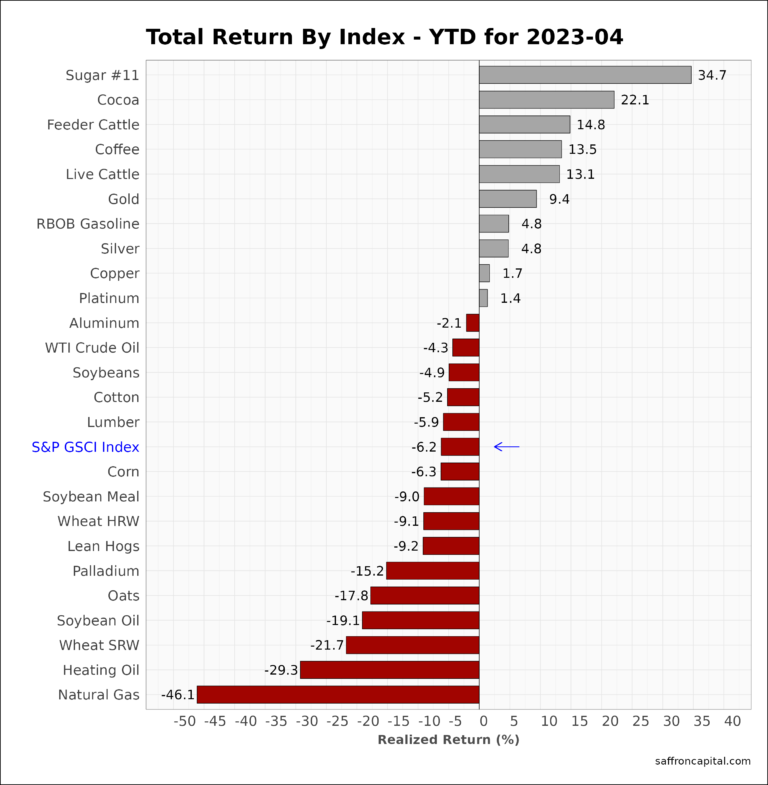
April 2023 returns for the S&P GSCI index (-1.0%) masked the wide range of results across the commodity complex. For example, Sugar (+21.3%) prices increased significantly, as prices for Coffee (+11.3%) and Platinum (+9.5%). Weak prices for Lumber (-5.3%) at this point in the year do not bode well for the US economy and housing sector . The weakest commodities in April included Oats (-17.1%), Heating Oil (-11.1%) and Spring Red Wheat (-10.5%). Year to date, Sugar (+34.7%) has had the highest returns, while Natural Gas (-46.1%) has had the weakest price performance.
Currencies
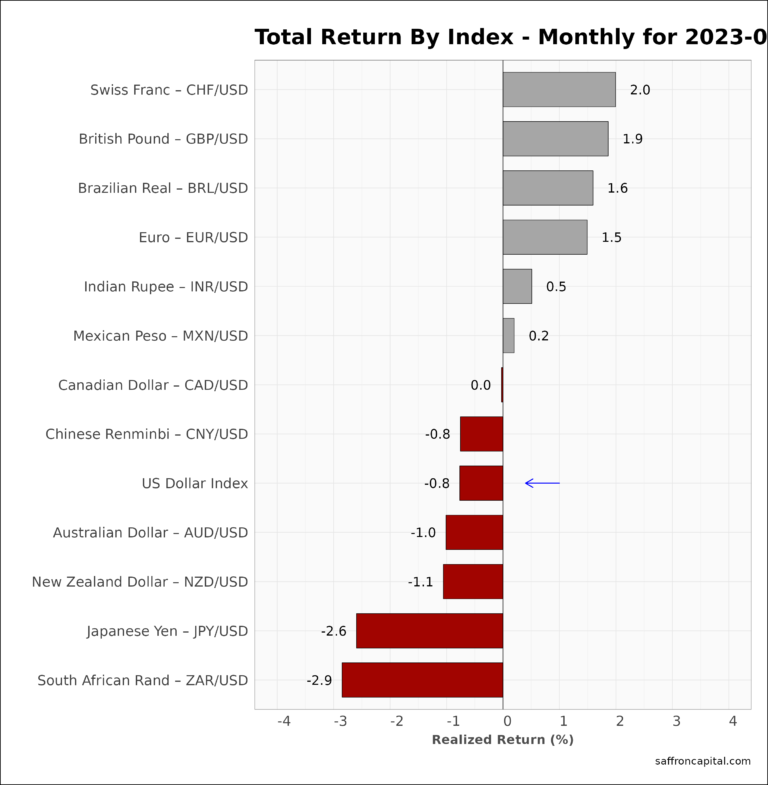
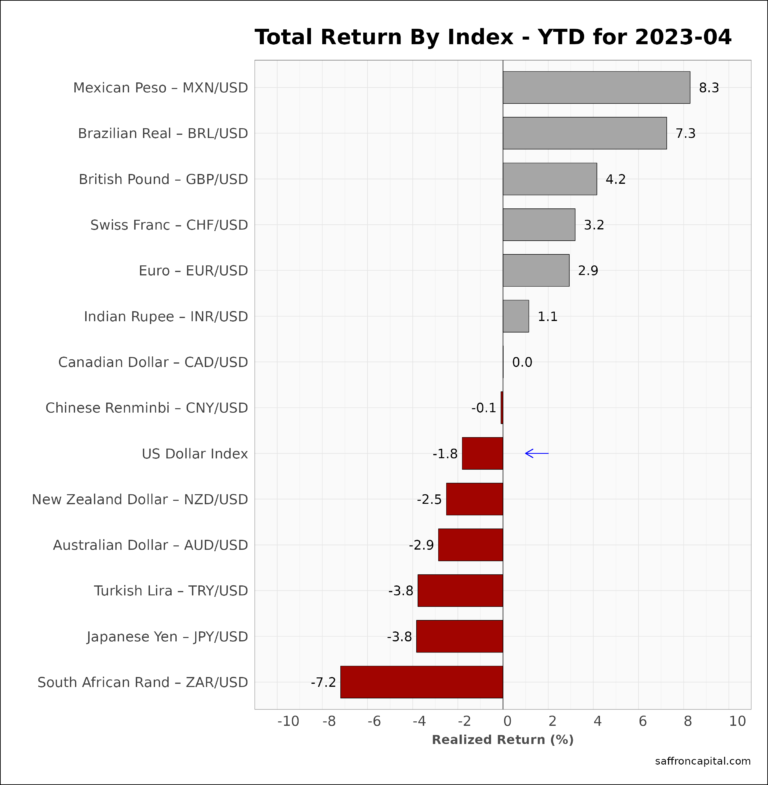
US Dollar (-0.8%) weakness resumed in parallel with declining US interest rates. Currency gains were strongest for the Swiss Franc (+2.0%), which tops the list for the second month running, followed by the British Pound (+1.9%). The Japanese Yen (-2.6%) and the South African rand (-2.9%) were the weakest of the major currencies in April. The year-to-date leader board includes the Mexican Peso (+8.3%), Brazilian Real (+7.3%) and British Pound (+4.2%).
Have questions or concerns about the performance of your portfolio? Looking for a risk-optimized portfolio strategy to grow and protect your savings? Whatever your needs are, we are here to help. Schedule a meeting here.


