August 2023 returns were negative, ending a 5 month stock market rally. At one point, the S&P 500 index was down -5.5%, but ended the month down -1.8%. The primary driver of returns was higher borrowing costs , which weighed on the market as the yield on 10-year Treasuries climbed to 4.35%, its highest level since November 2007.
Diving deeper, the best performer in the S&P 500 index was Arista Networks (+26%, ANET) as AI investors pivoted toward AI enablers like cloud computer centers. In contrast, the worse index performer was SolarEdge Technologies (-33%, SEDG) given weak sales and lower sales guidance.
Moving to fixed income markets, prices were under pressure with long duration bonds (-3.14%) down significantly. In comparison, the iBOXX corporate bond index (+0.18%) was up marginally, while bonds for US infrastructure project (-3.54%) fared the worse.
Finally, commodity prices (+0.5%) were unchanged on average, but outliers are evident. Natural Gas (+5.1%) and diesel fuel (+5.1%) lead the markets, while pork (-20.7%) and wheat (-13.9%) had sharp declines.
The following analysis provides a visual record of August 2023 returns across the major asset classes.
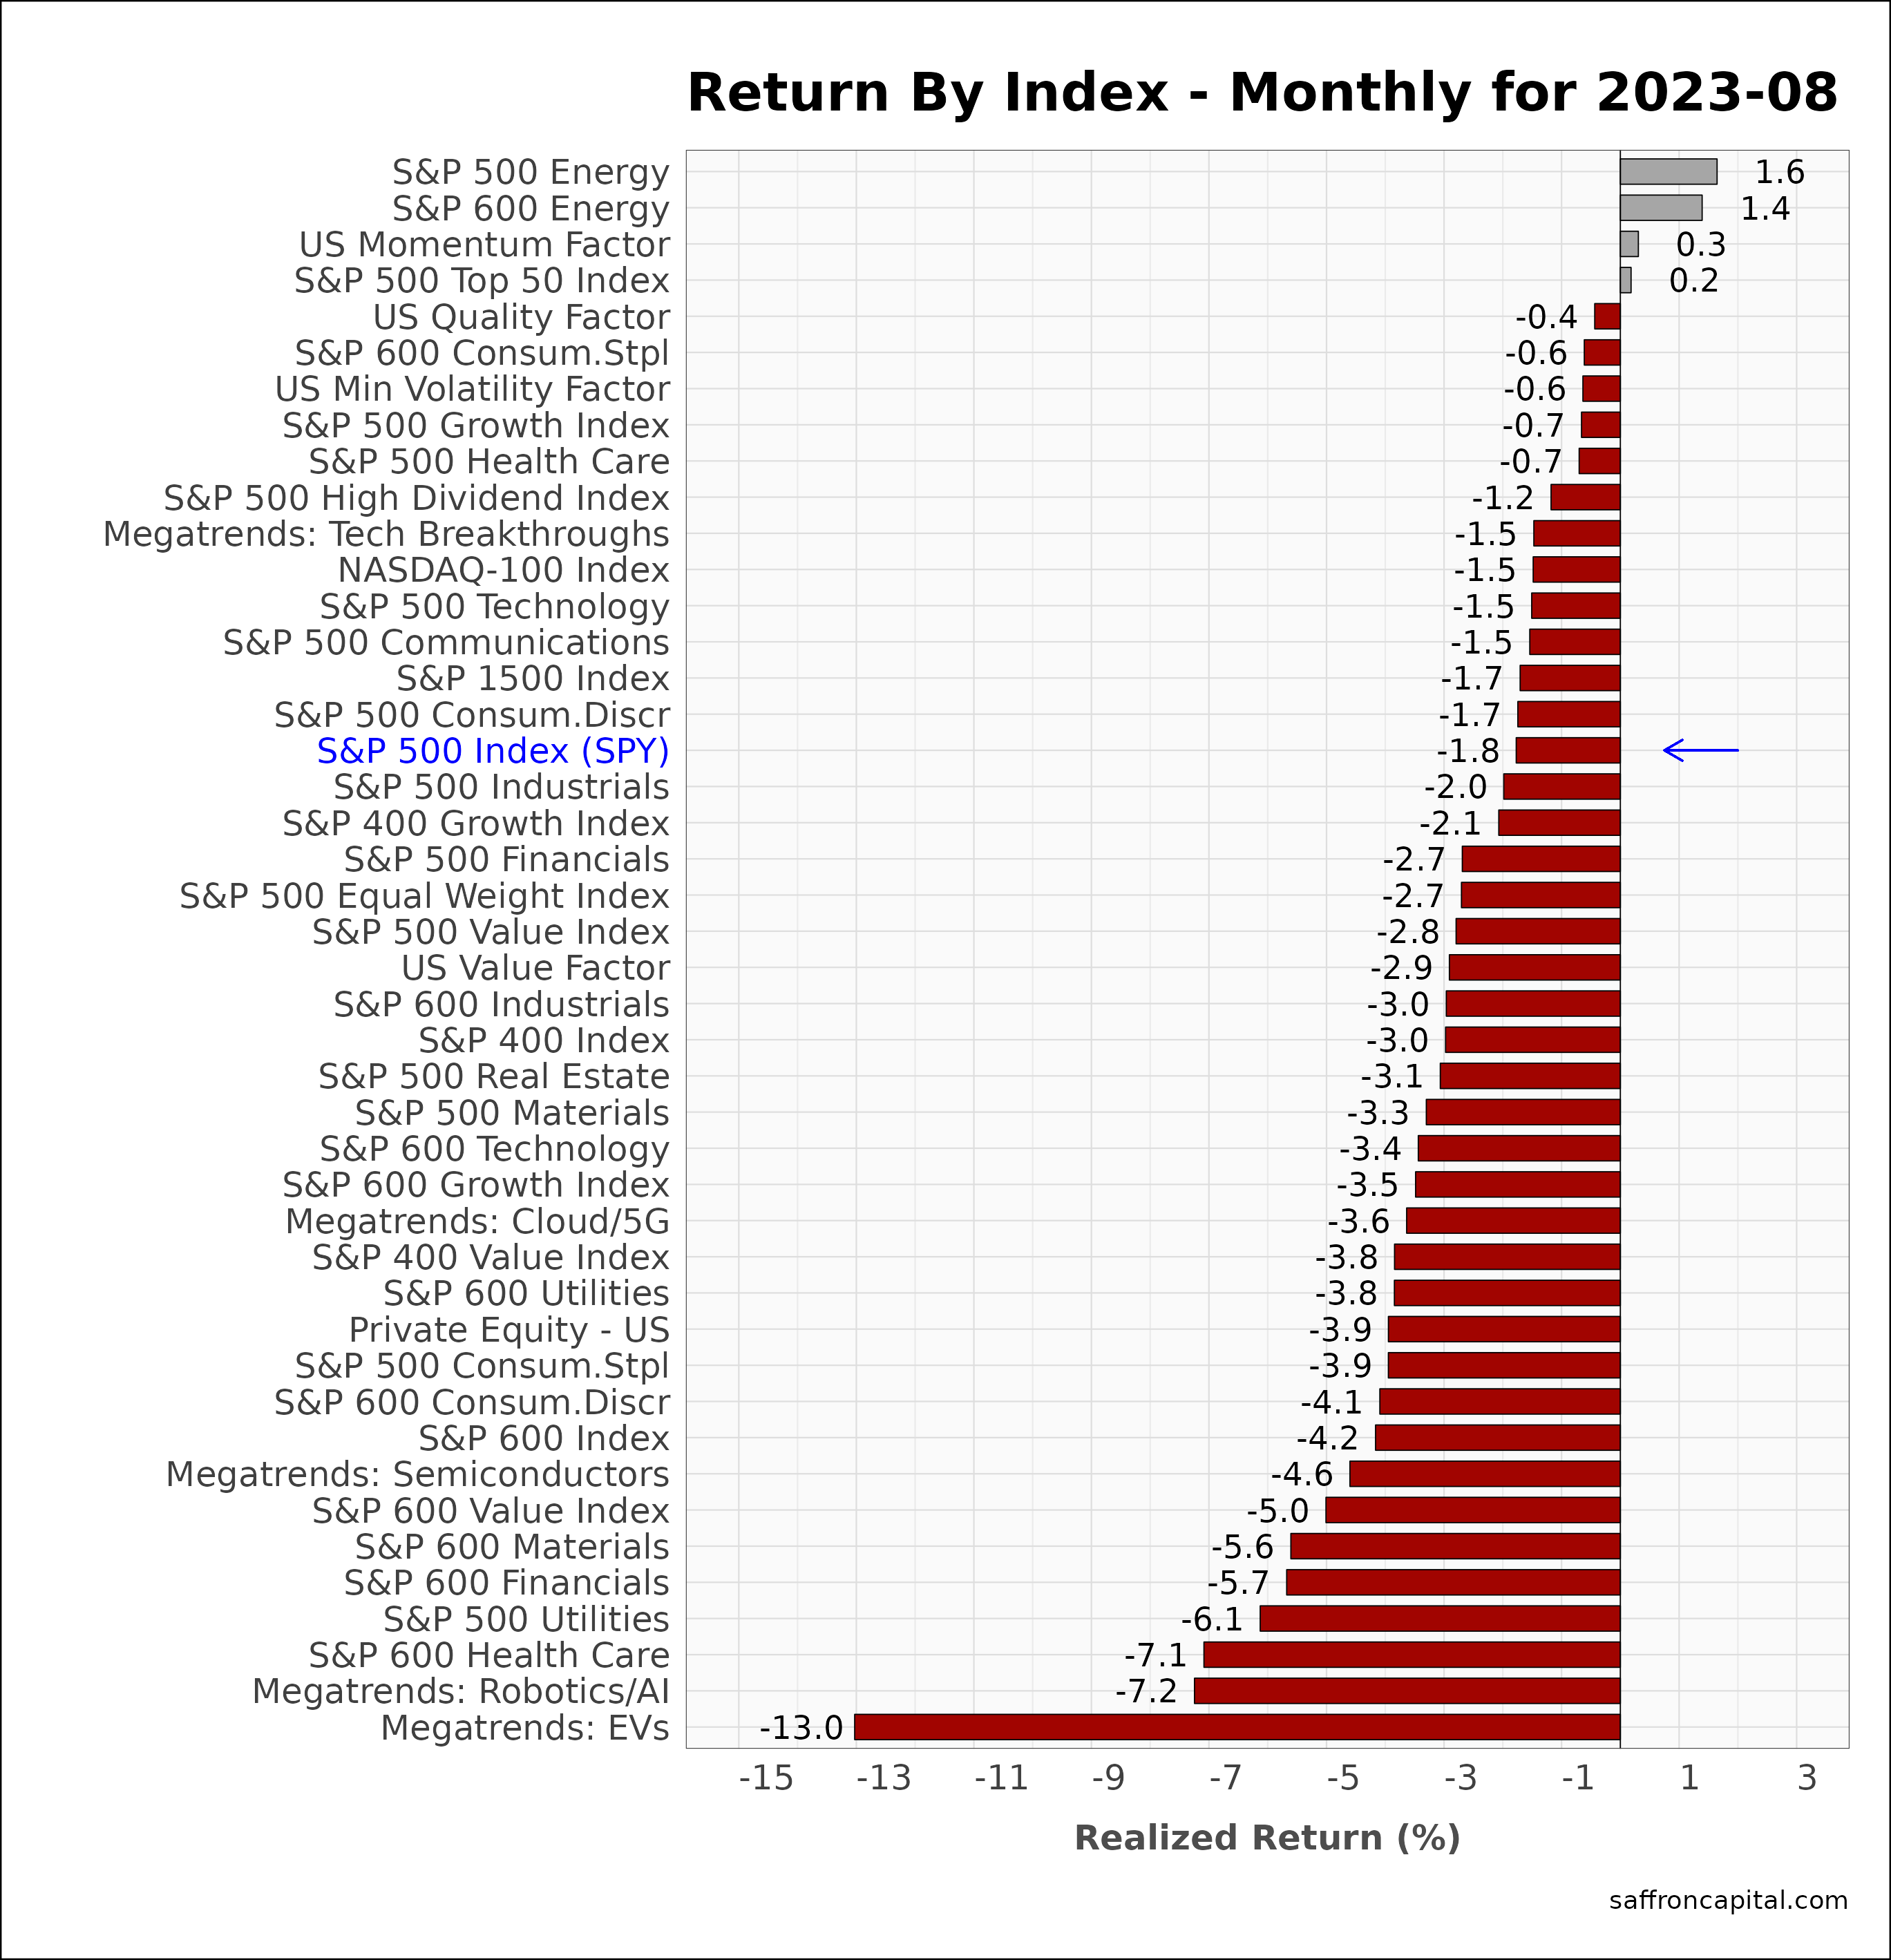
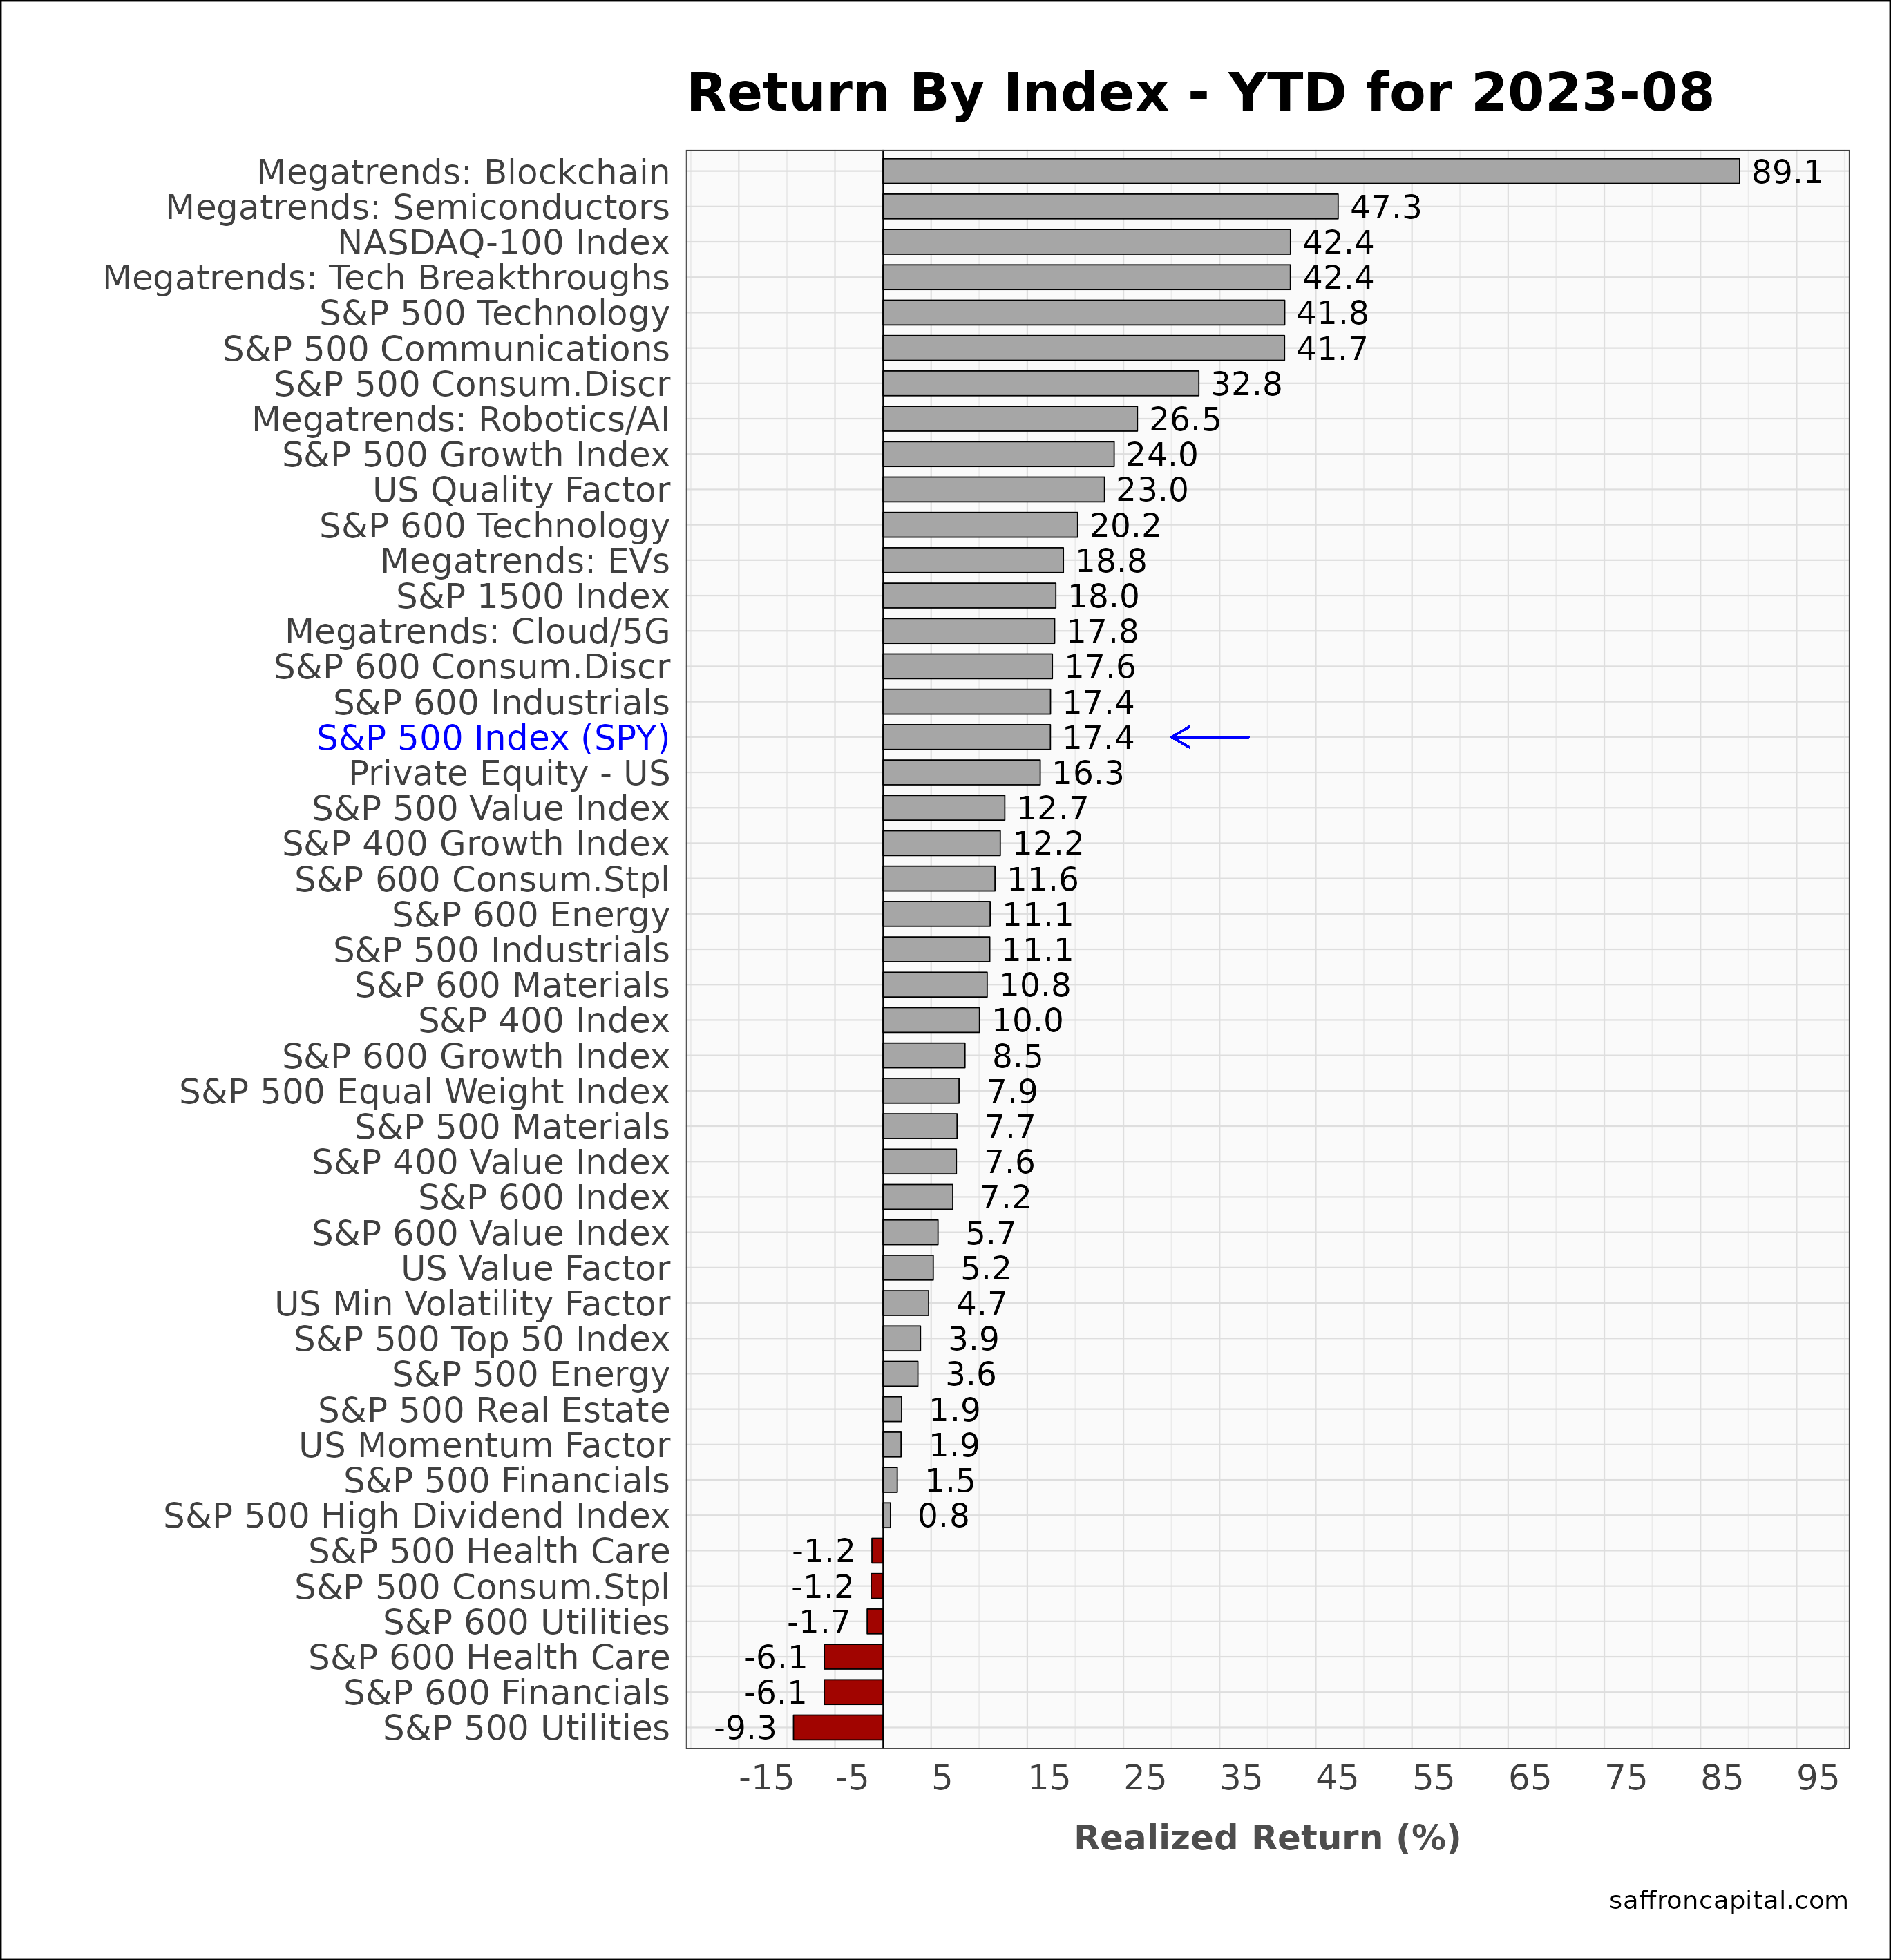
US Equities
Red ink hit nearly ever tracked index in August with the exception of large- and small-cap Energy (+1.6% and +1.4%), the Momentum Factor Portfolio (+0.3%), and the mega-cap top 50 index (0.2%). Notable laggards included Electric Vehicles (-13.0%), Robotics/AI (-7.2%), and small-cap Health Care (-7.1%). On a year to date basis, the S&P 500 index is up +17.4% while the NASDAQ 100 index is up an astounding 42.4%.
Click to enlarge
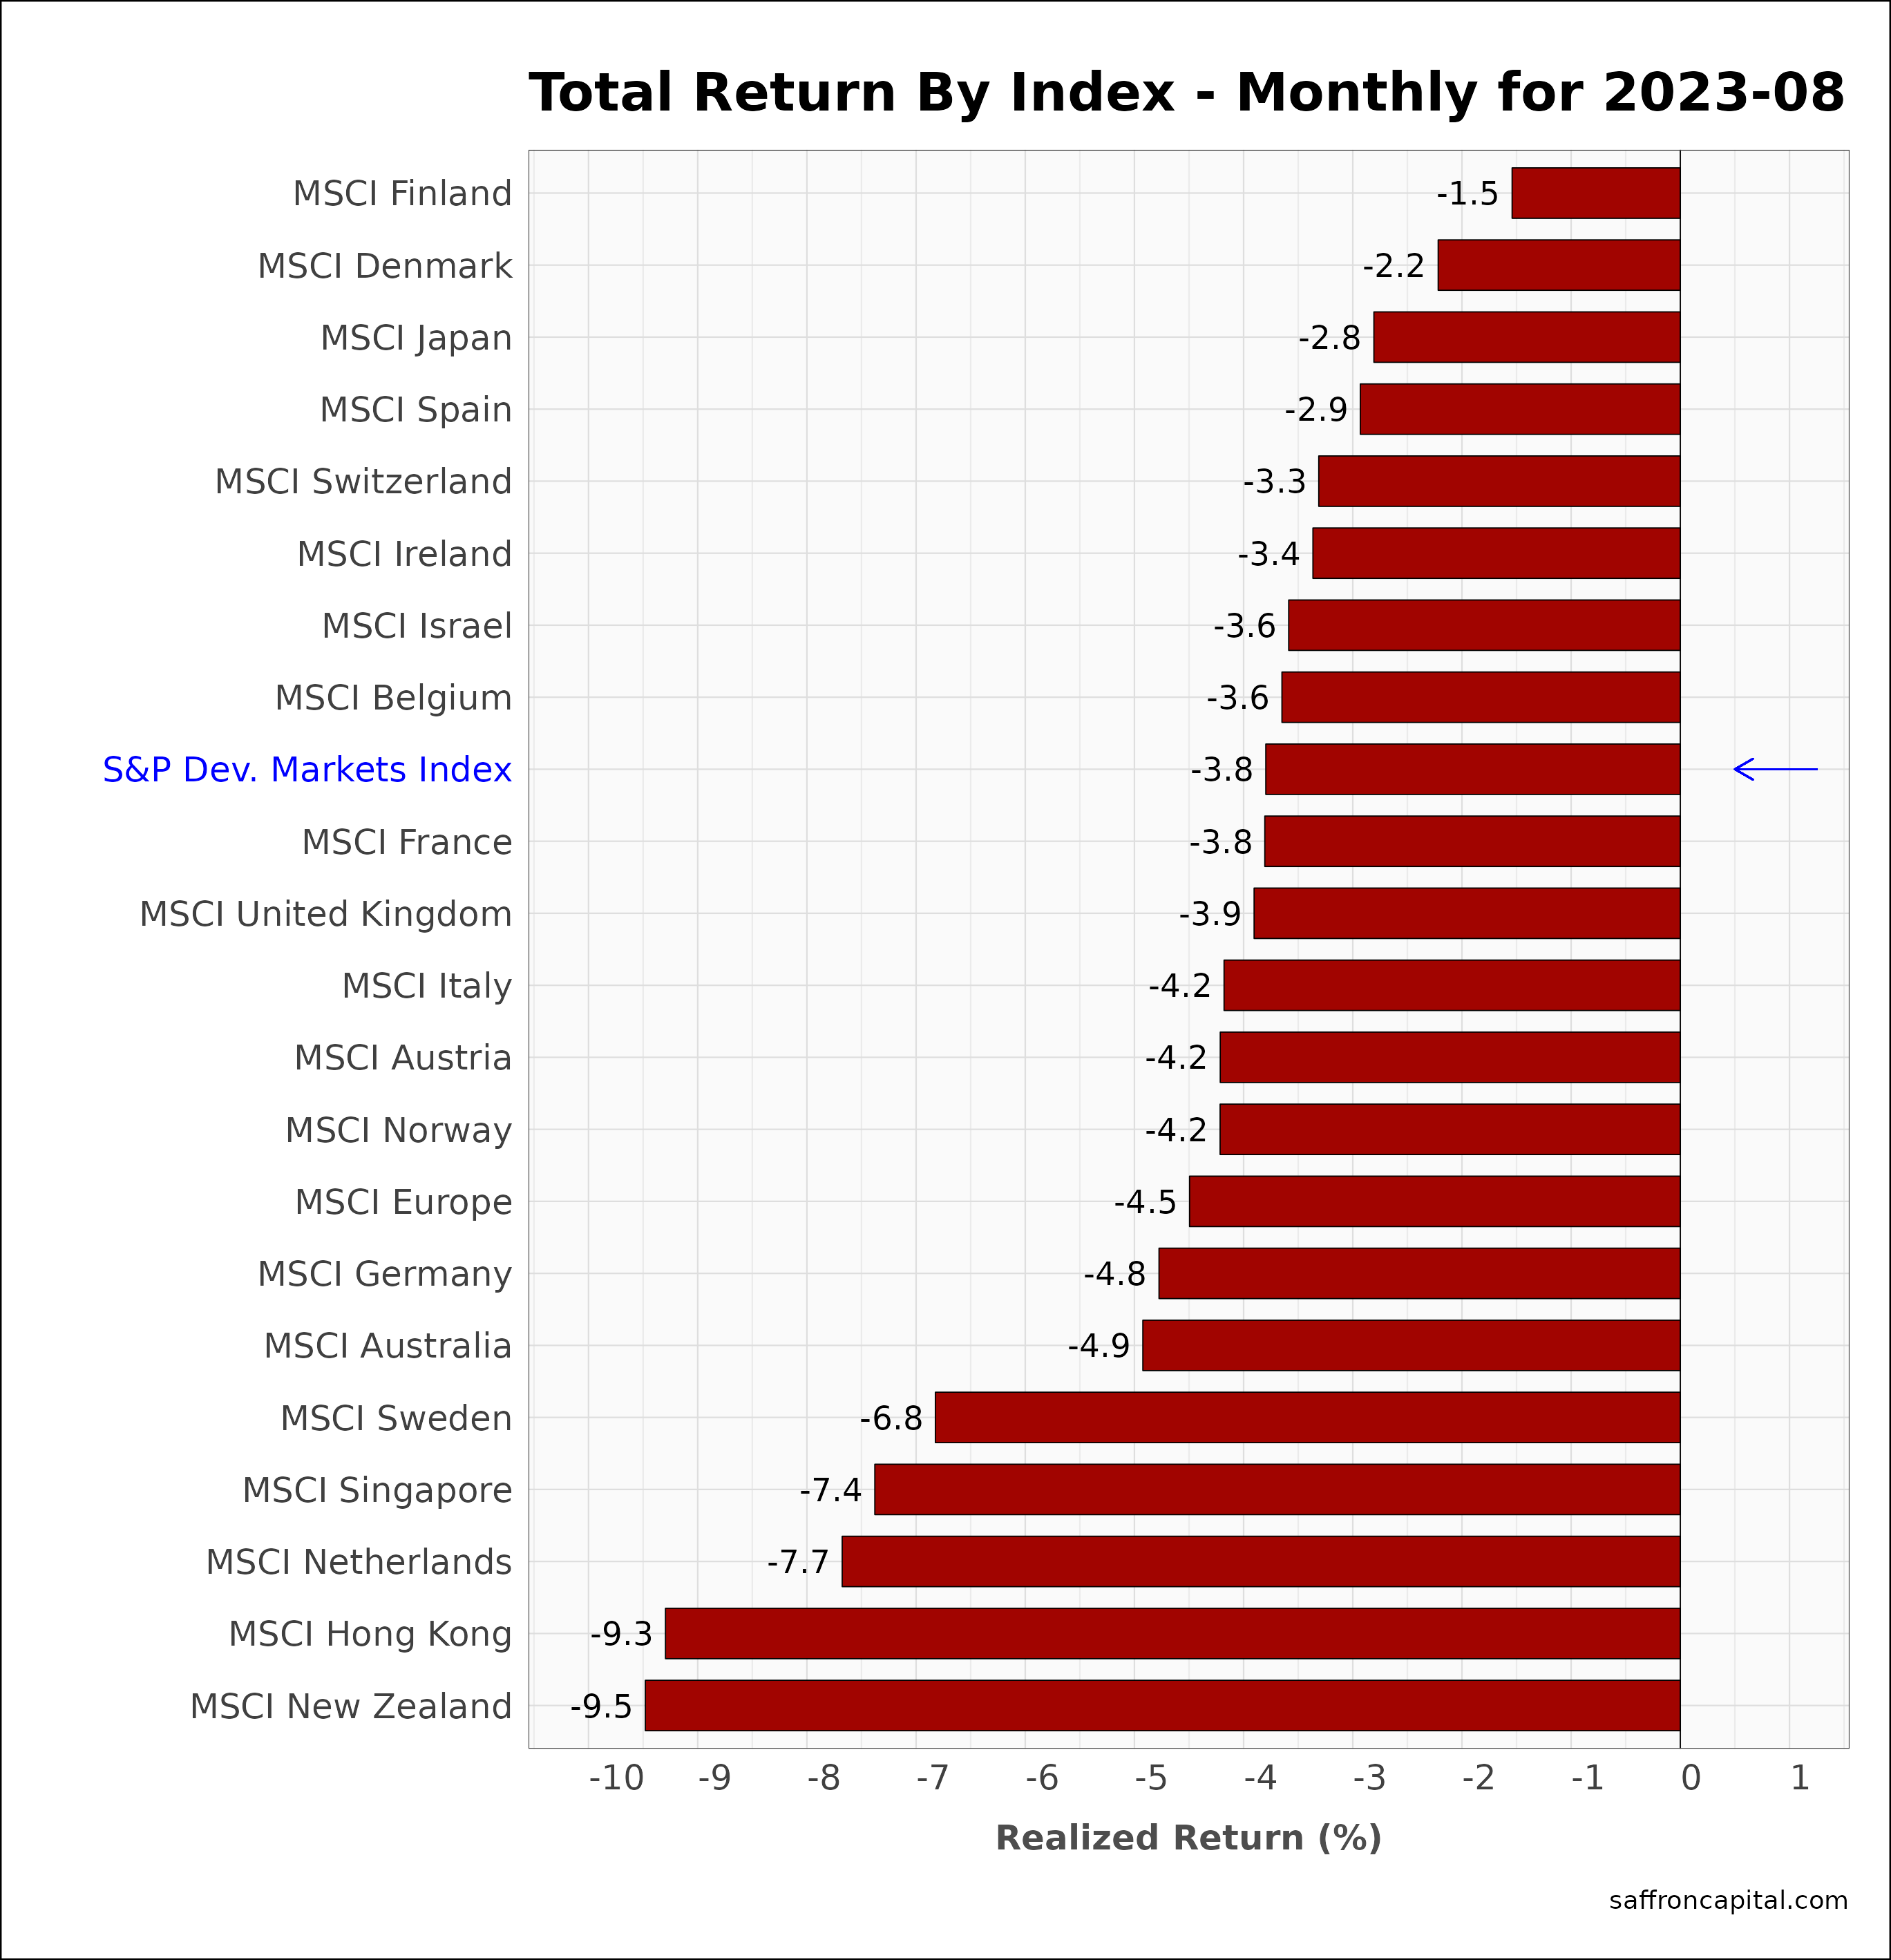
Developed Market Equities
International developed markets (-3.8%) followed US stocks down mid month, but failed to rally as strong at the end of the month. Top MSCI index performers with the least red ink include Finland (-1.5%), Denmark (-2.2%), and Japan (-2.8%). Large European indices trailed the S&P Developed Markets Index, with the Dutch market (-7.7%) falling the most. Since January, Developed Markets (+10.1) are lagging US shares by 730 basis points. Ireland (+27.9%), Italy (+22.1%) and Spain (+19.3%) lead the pack, with Hong Kong (-12.2%) presenting the weakest results year-to-date.
Click to enlarge
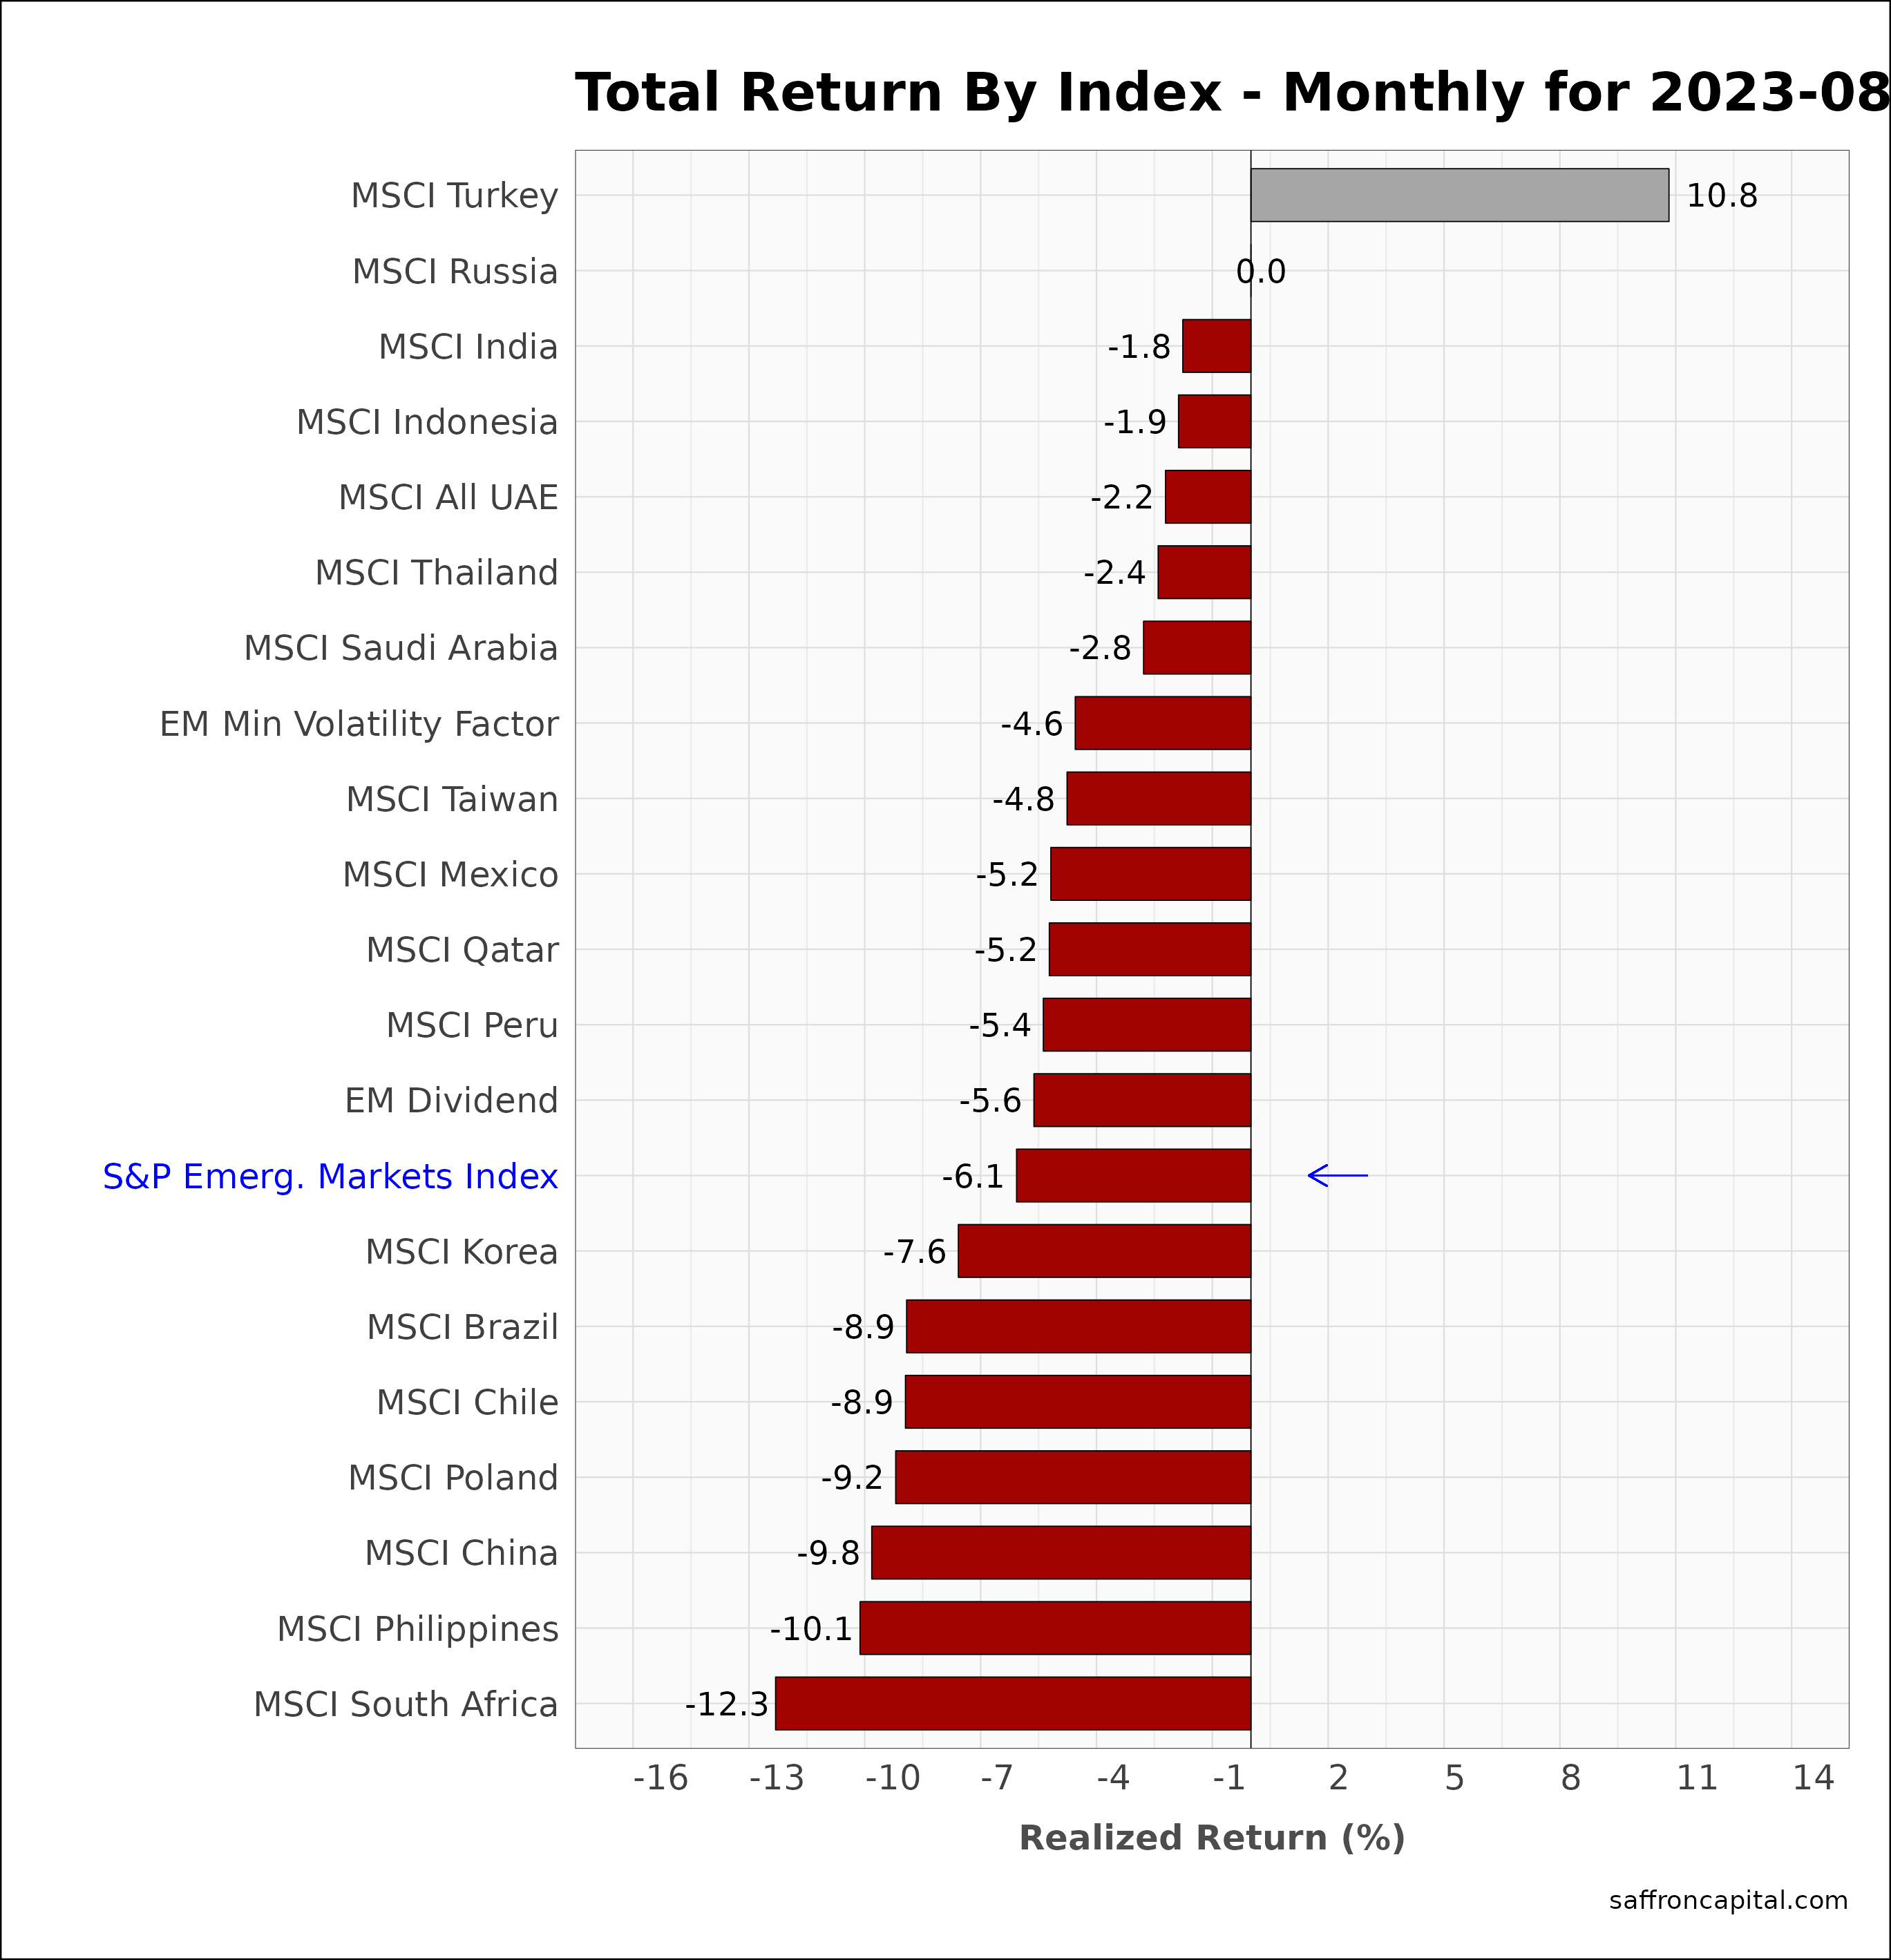
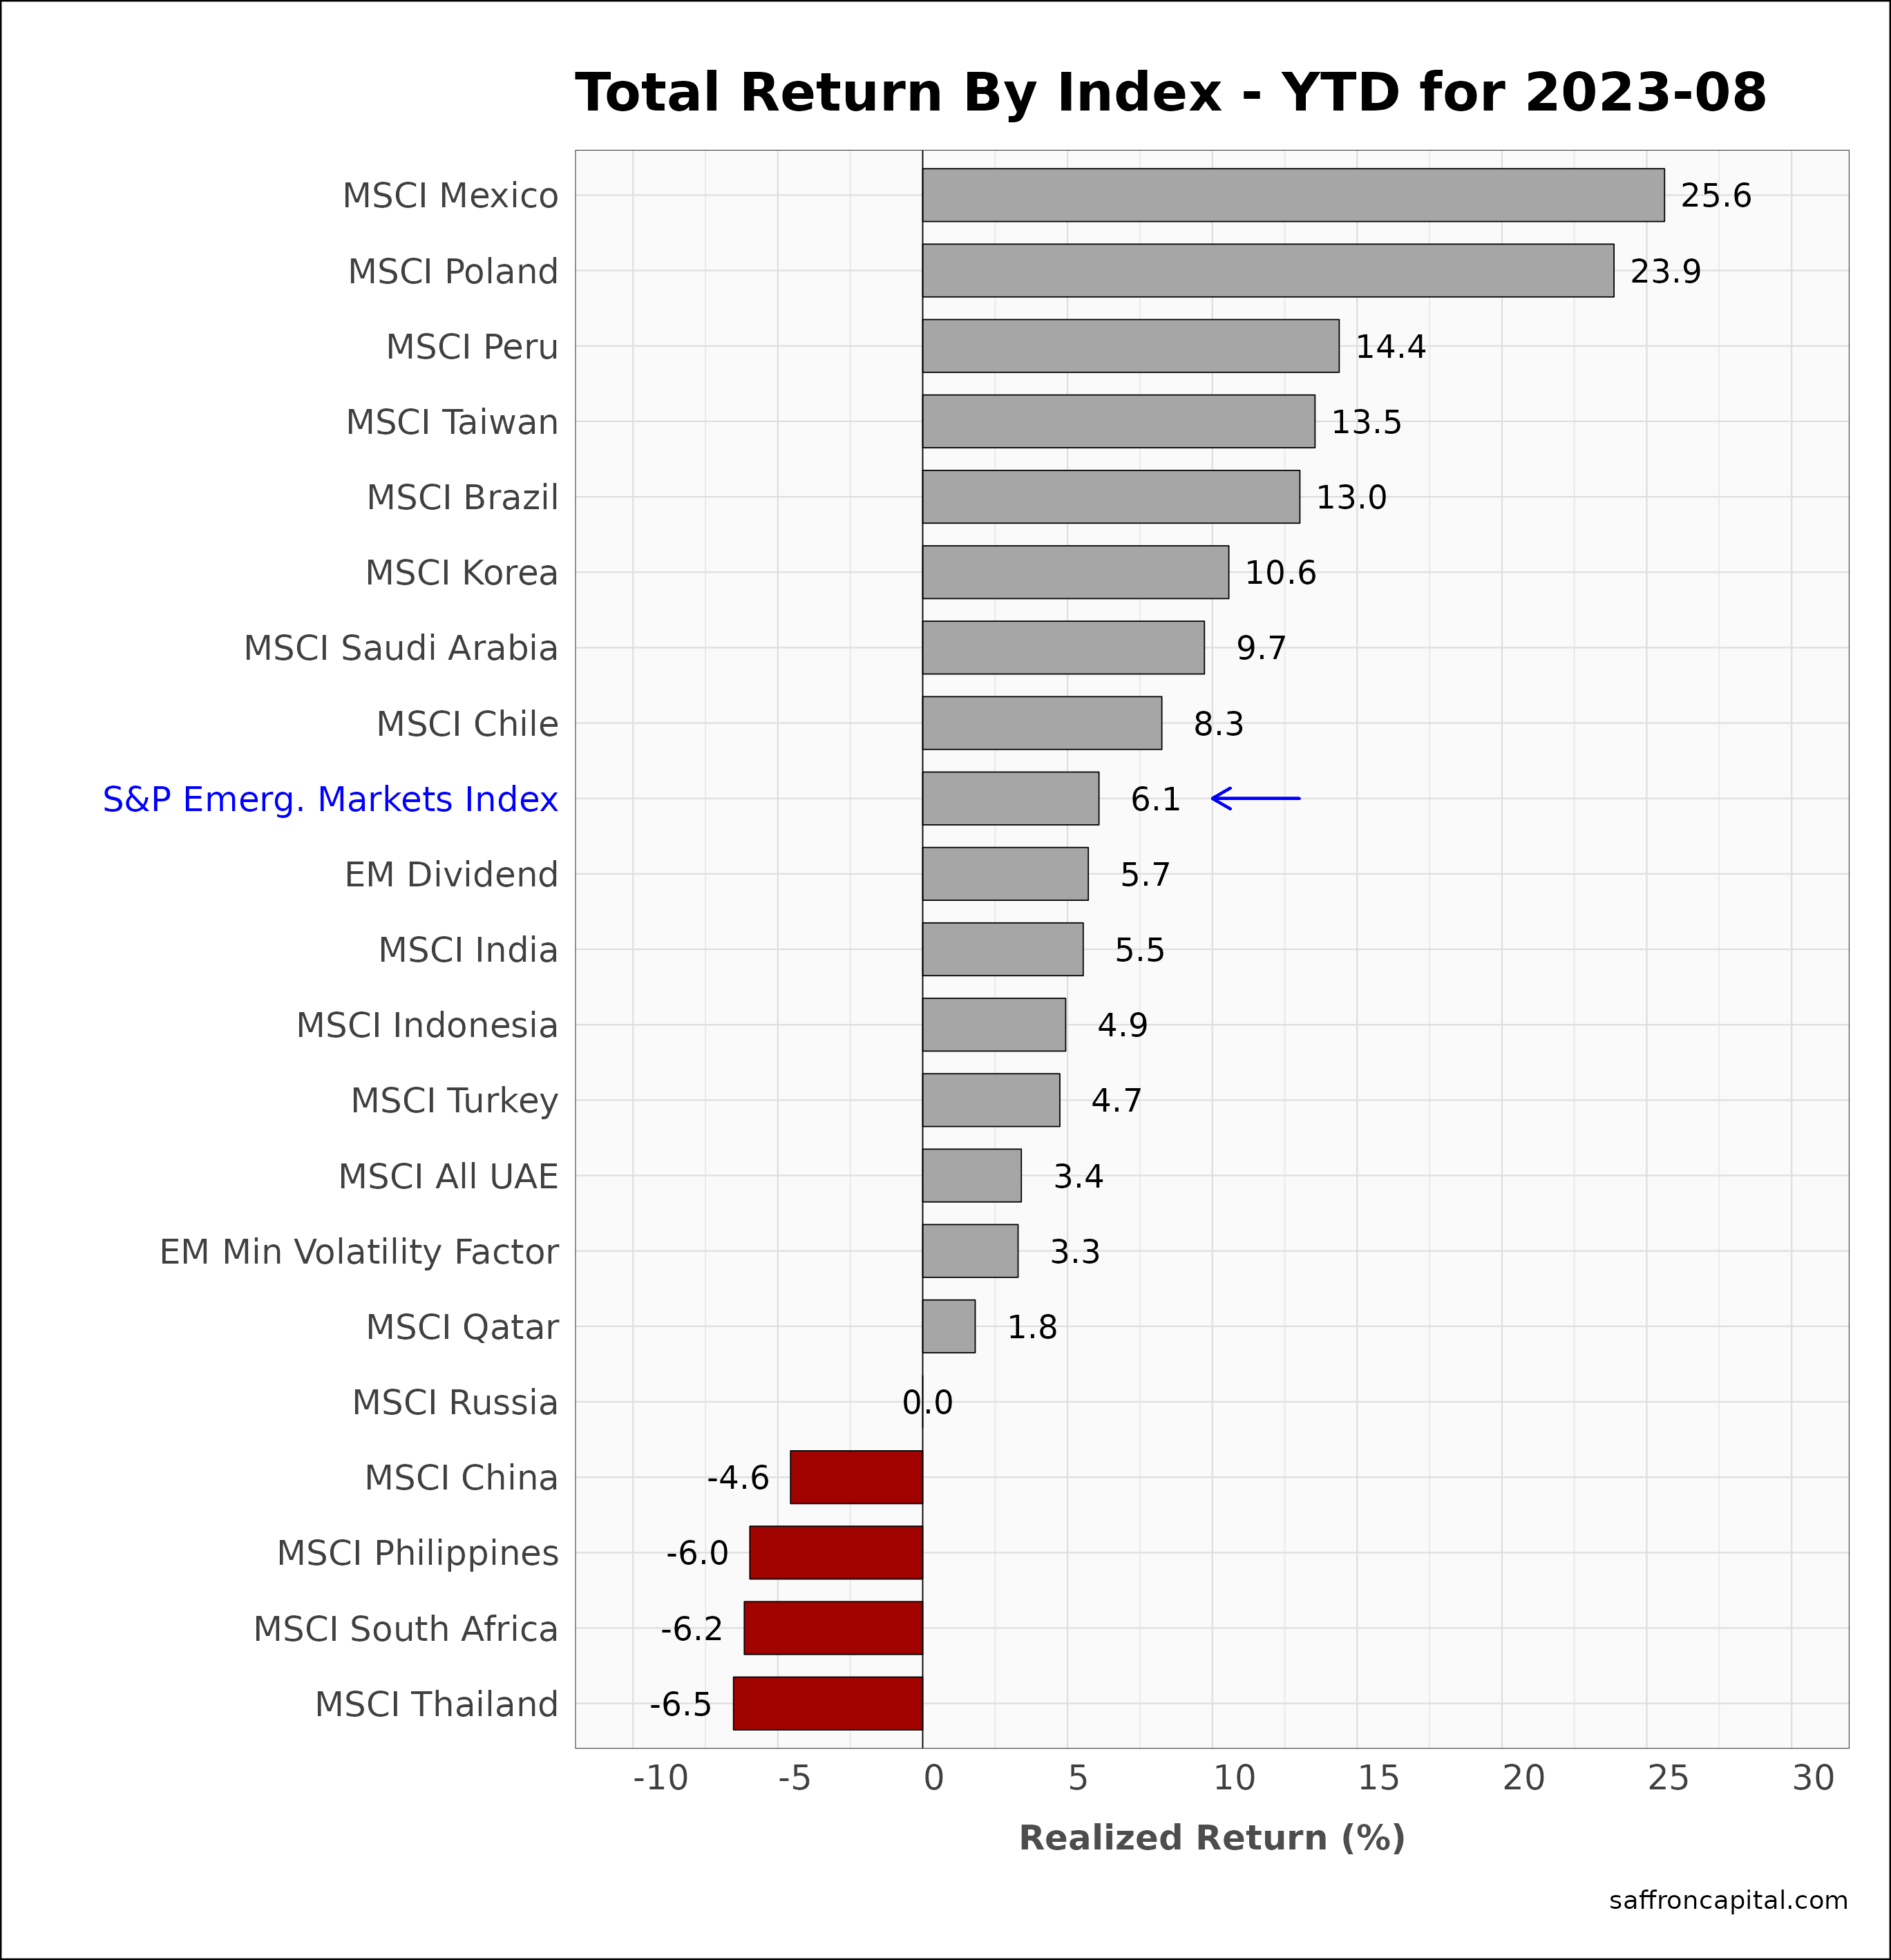
Emerging Market Equities
August 2023 returns for the S&P Emerging Markets Index (-6.1%) suffered on dollar strength, unde-performing the US and the developed markets. For instance, strong monthly returns were realized again in Turkey (+10.8%), but all other emerging markets were down in August, including China (-9.8%), Taiwan (-4.8%), and India (-1.8%). In comparison, year-to-date performance for emerging markets (+6.1%) continues to be lead by Mexico (+25.6%), Poland (+23.9%), and Peru (+14.4%).
Click to enlarge
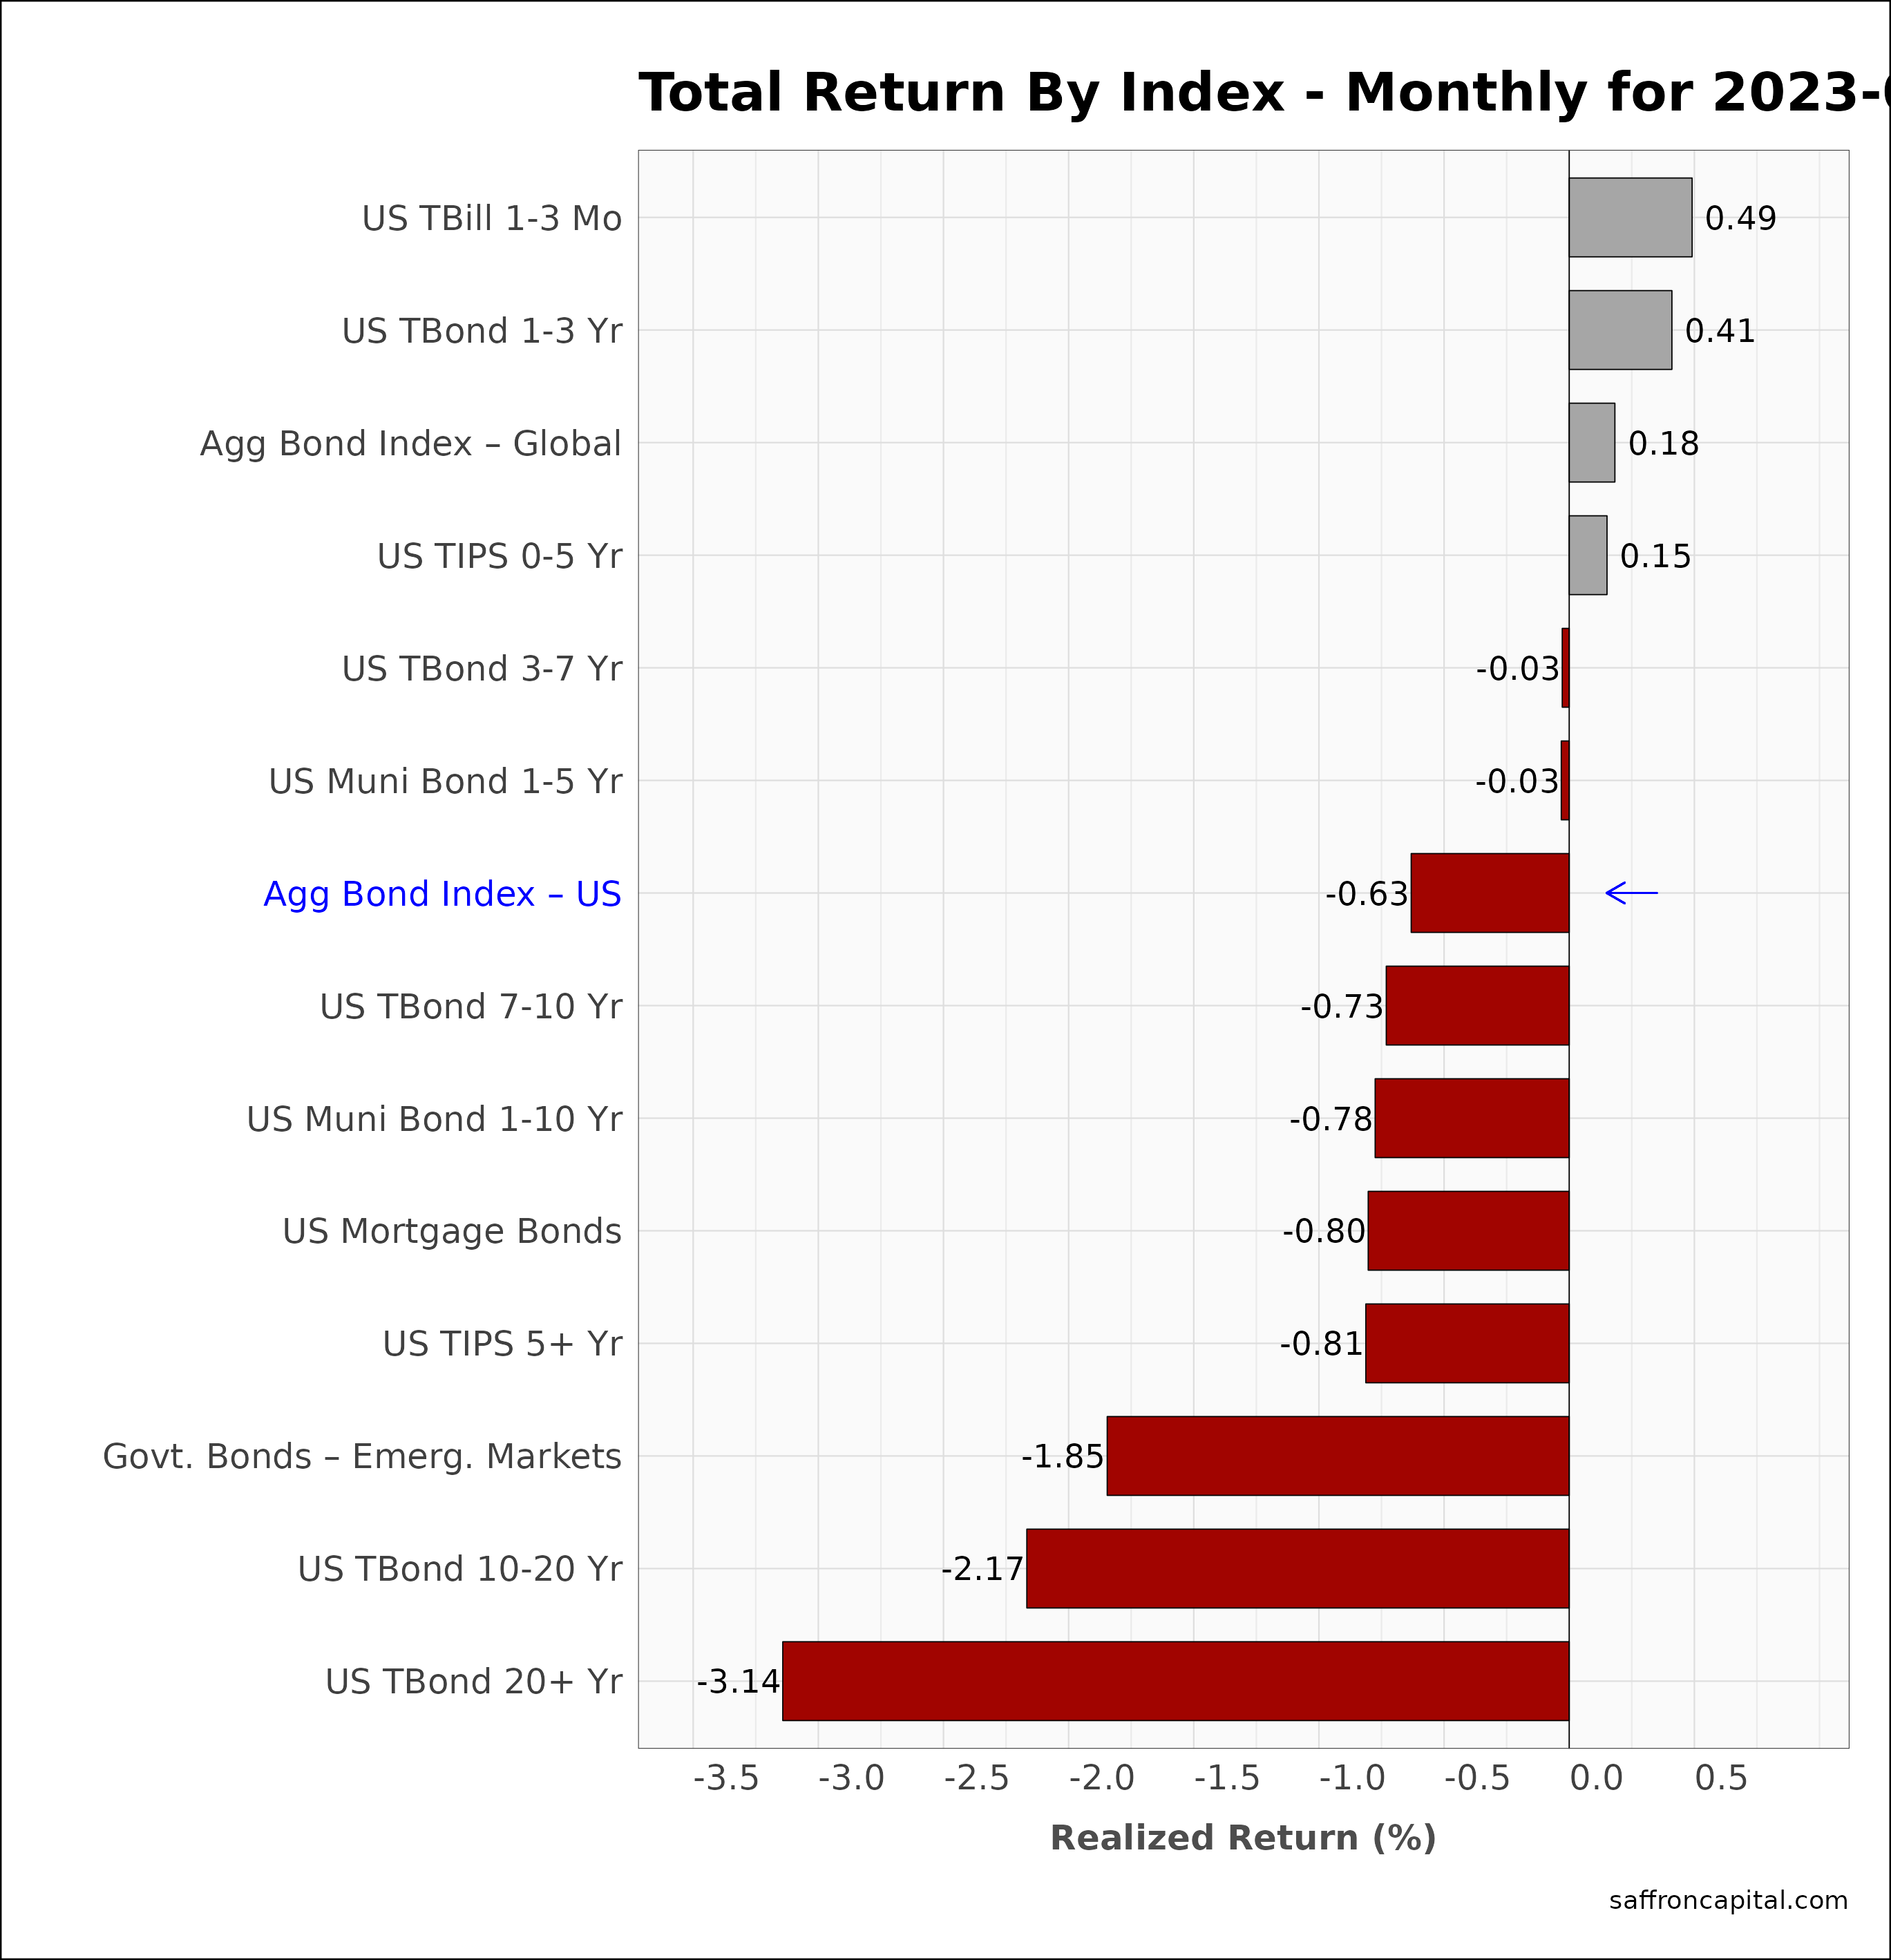
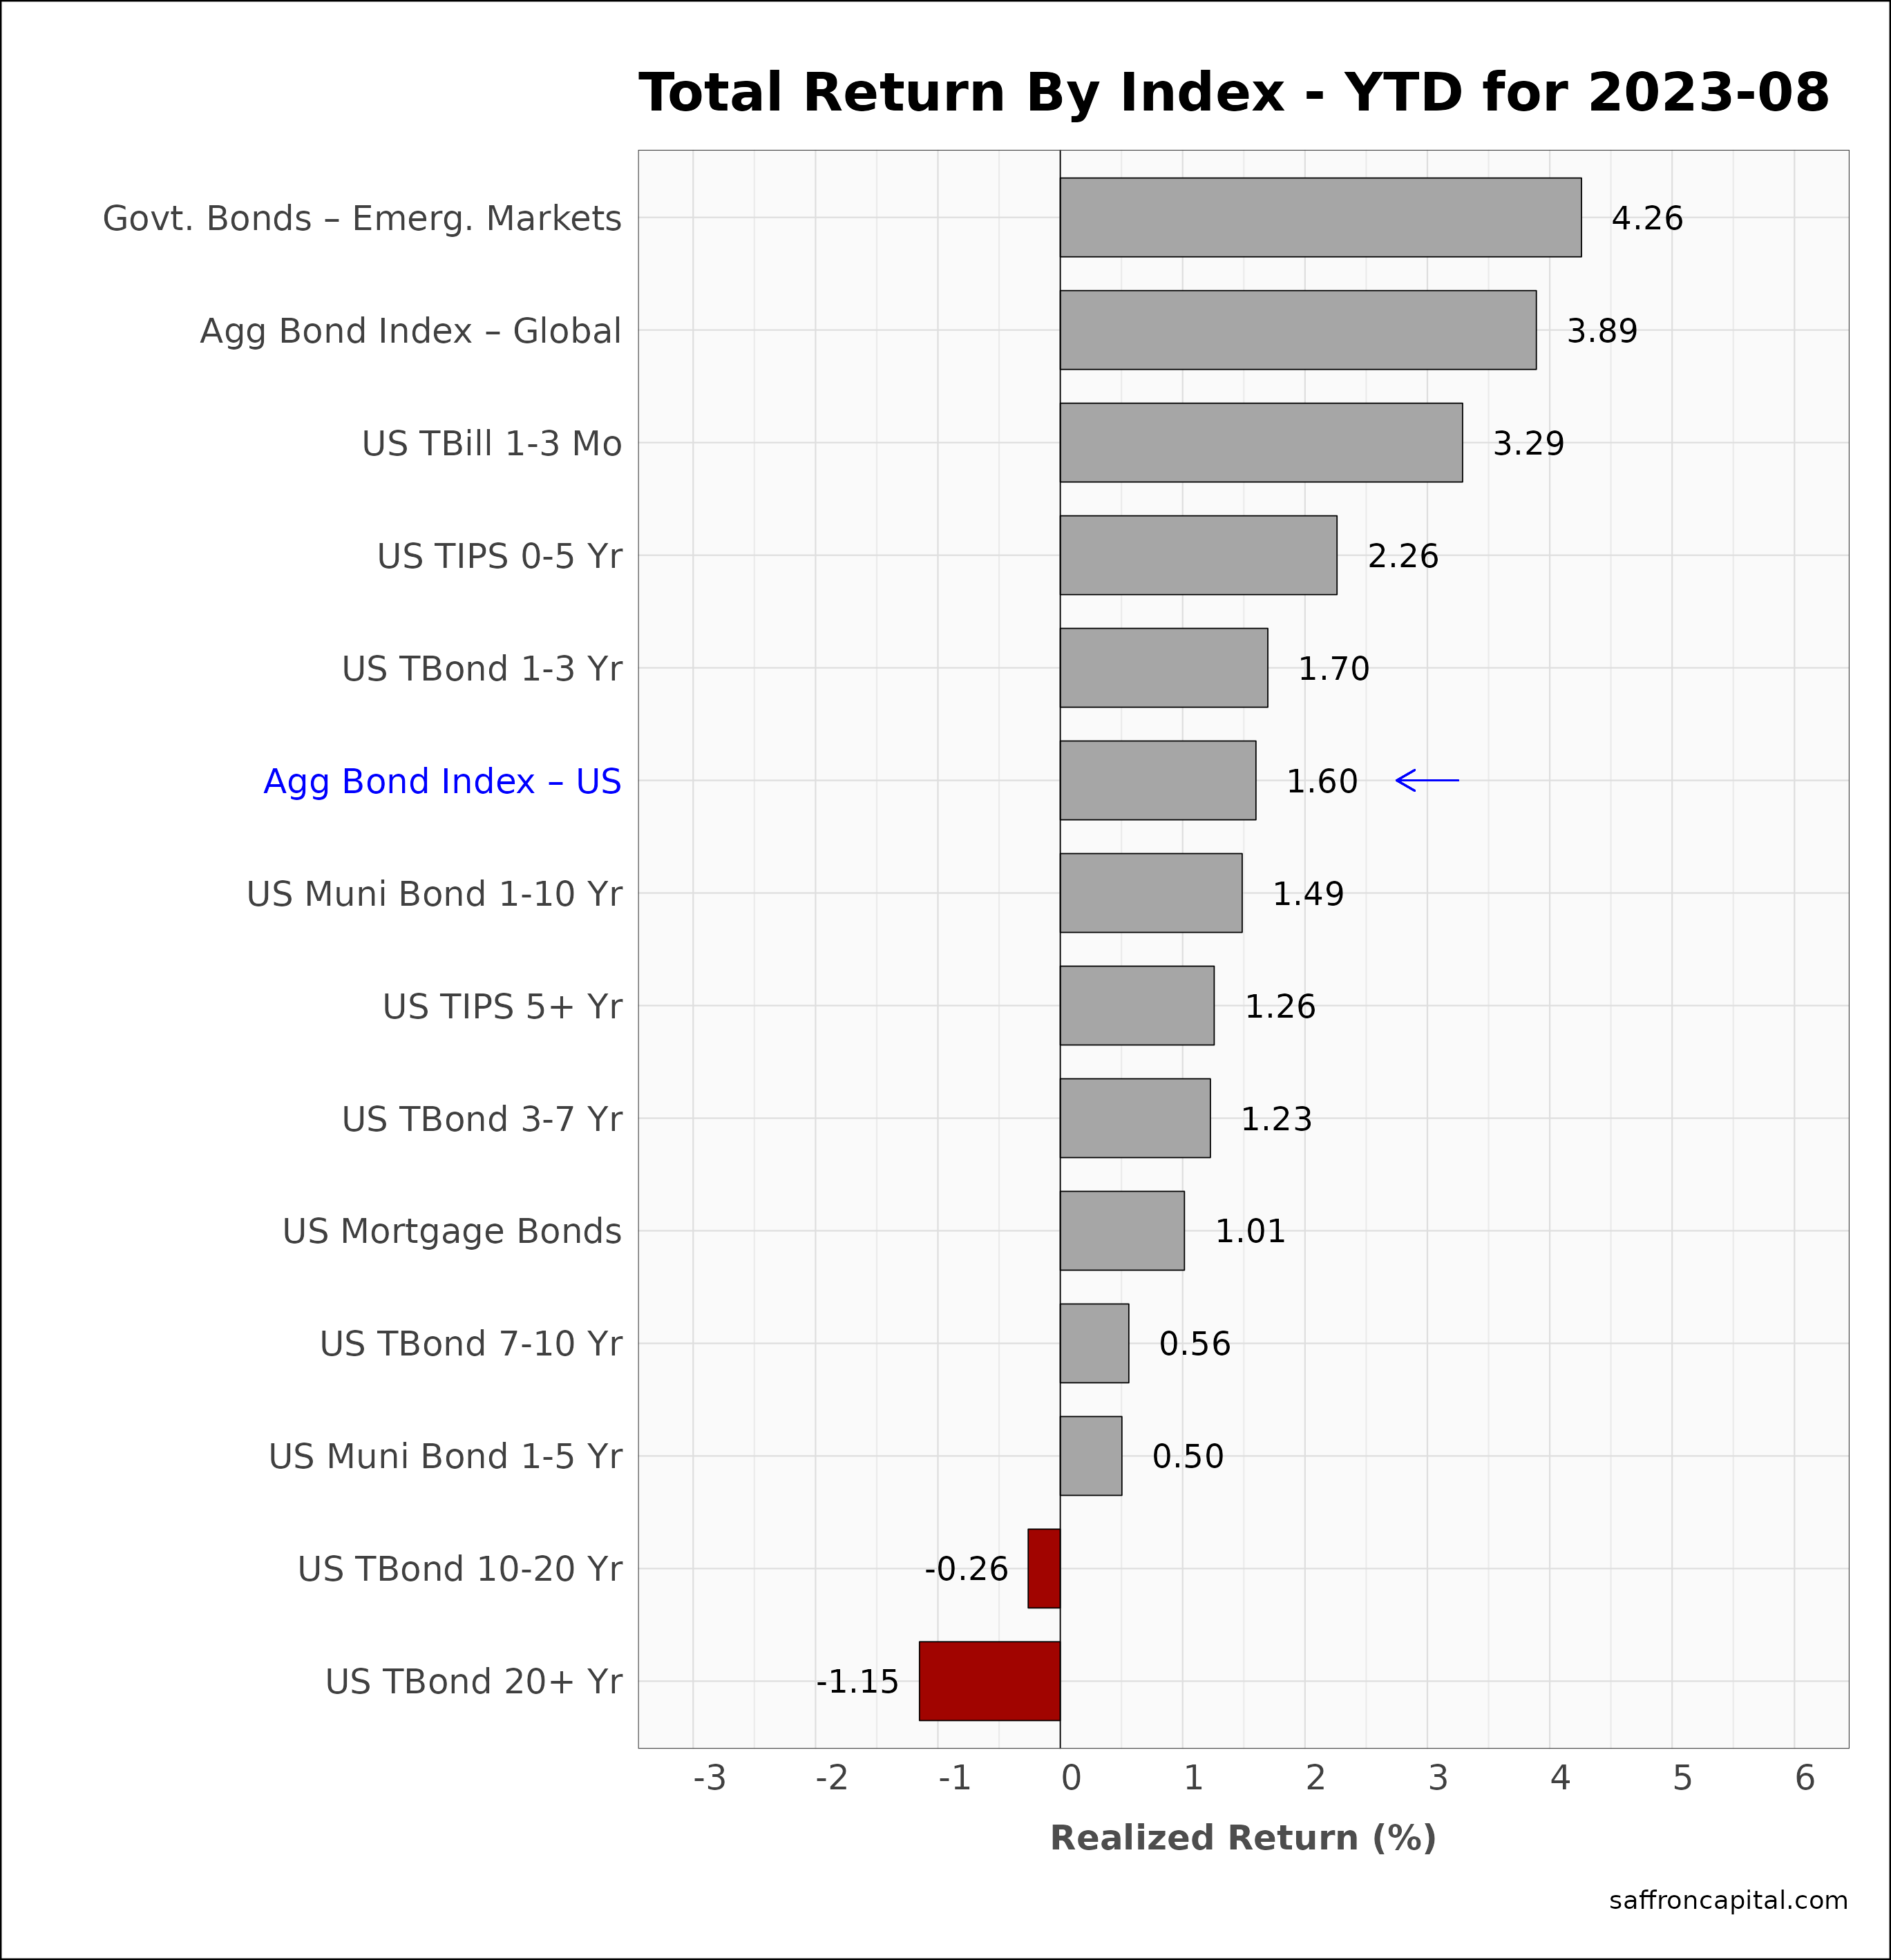
Government Bonds
August returns for the Aggregate US Government Bonds Index (-0.63%) was modest and masked the variability of returns observed across the yield curve. As evidence, short-term yields were down, supporitng US T-Bill prices (+0.49%). Meanwhile, long duration yields were up and bonds maturing in 20+ years (-3.14%) had strong declines. Since January, returns for the Aggregate US Bond index (+1.6%) are yet to match realized inflation in 2023. However, Emerging market Government Bonds (+4.26%) and the Global Aggregate Bond Index (+3.89%) remain top performers in the asset group.
Click to enlarge
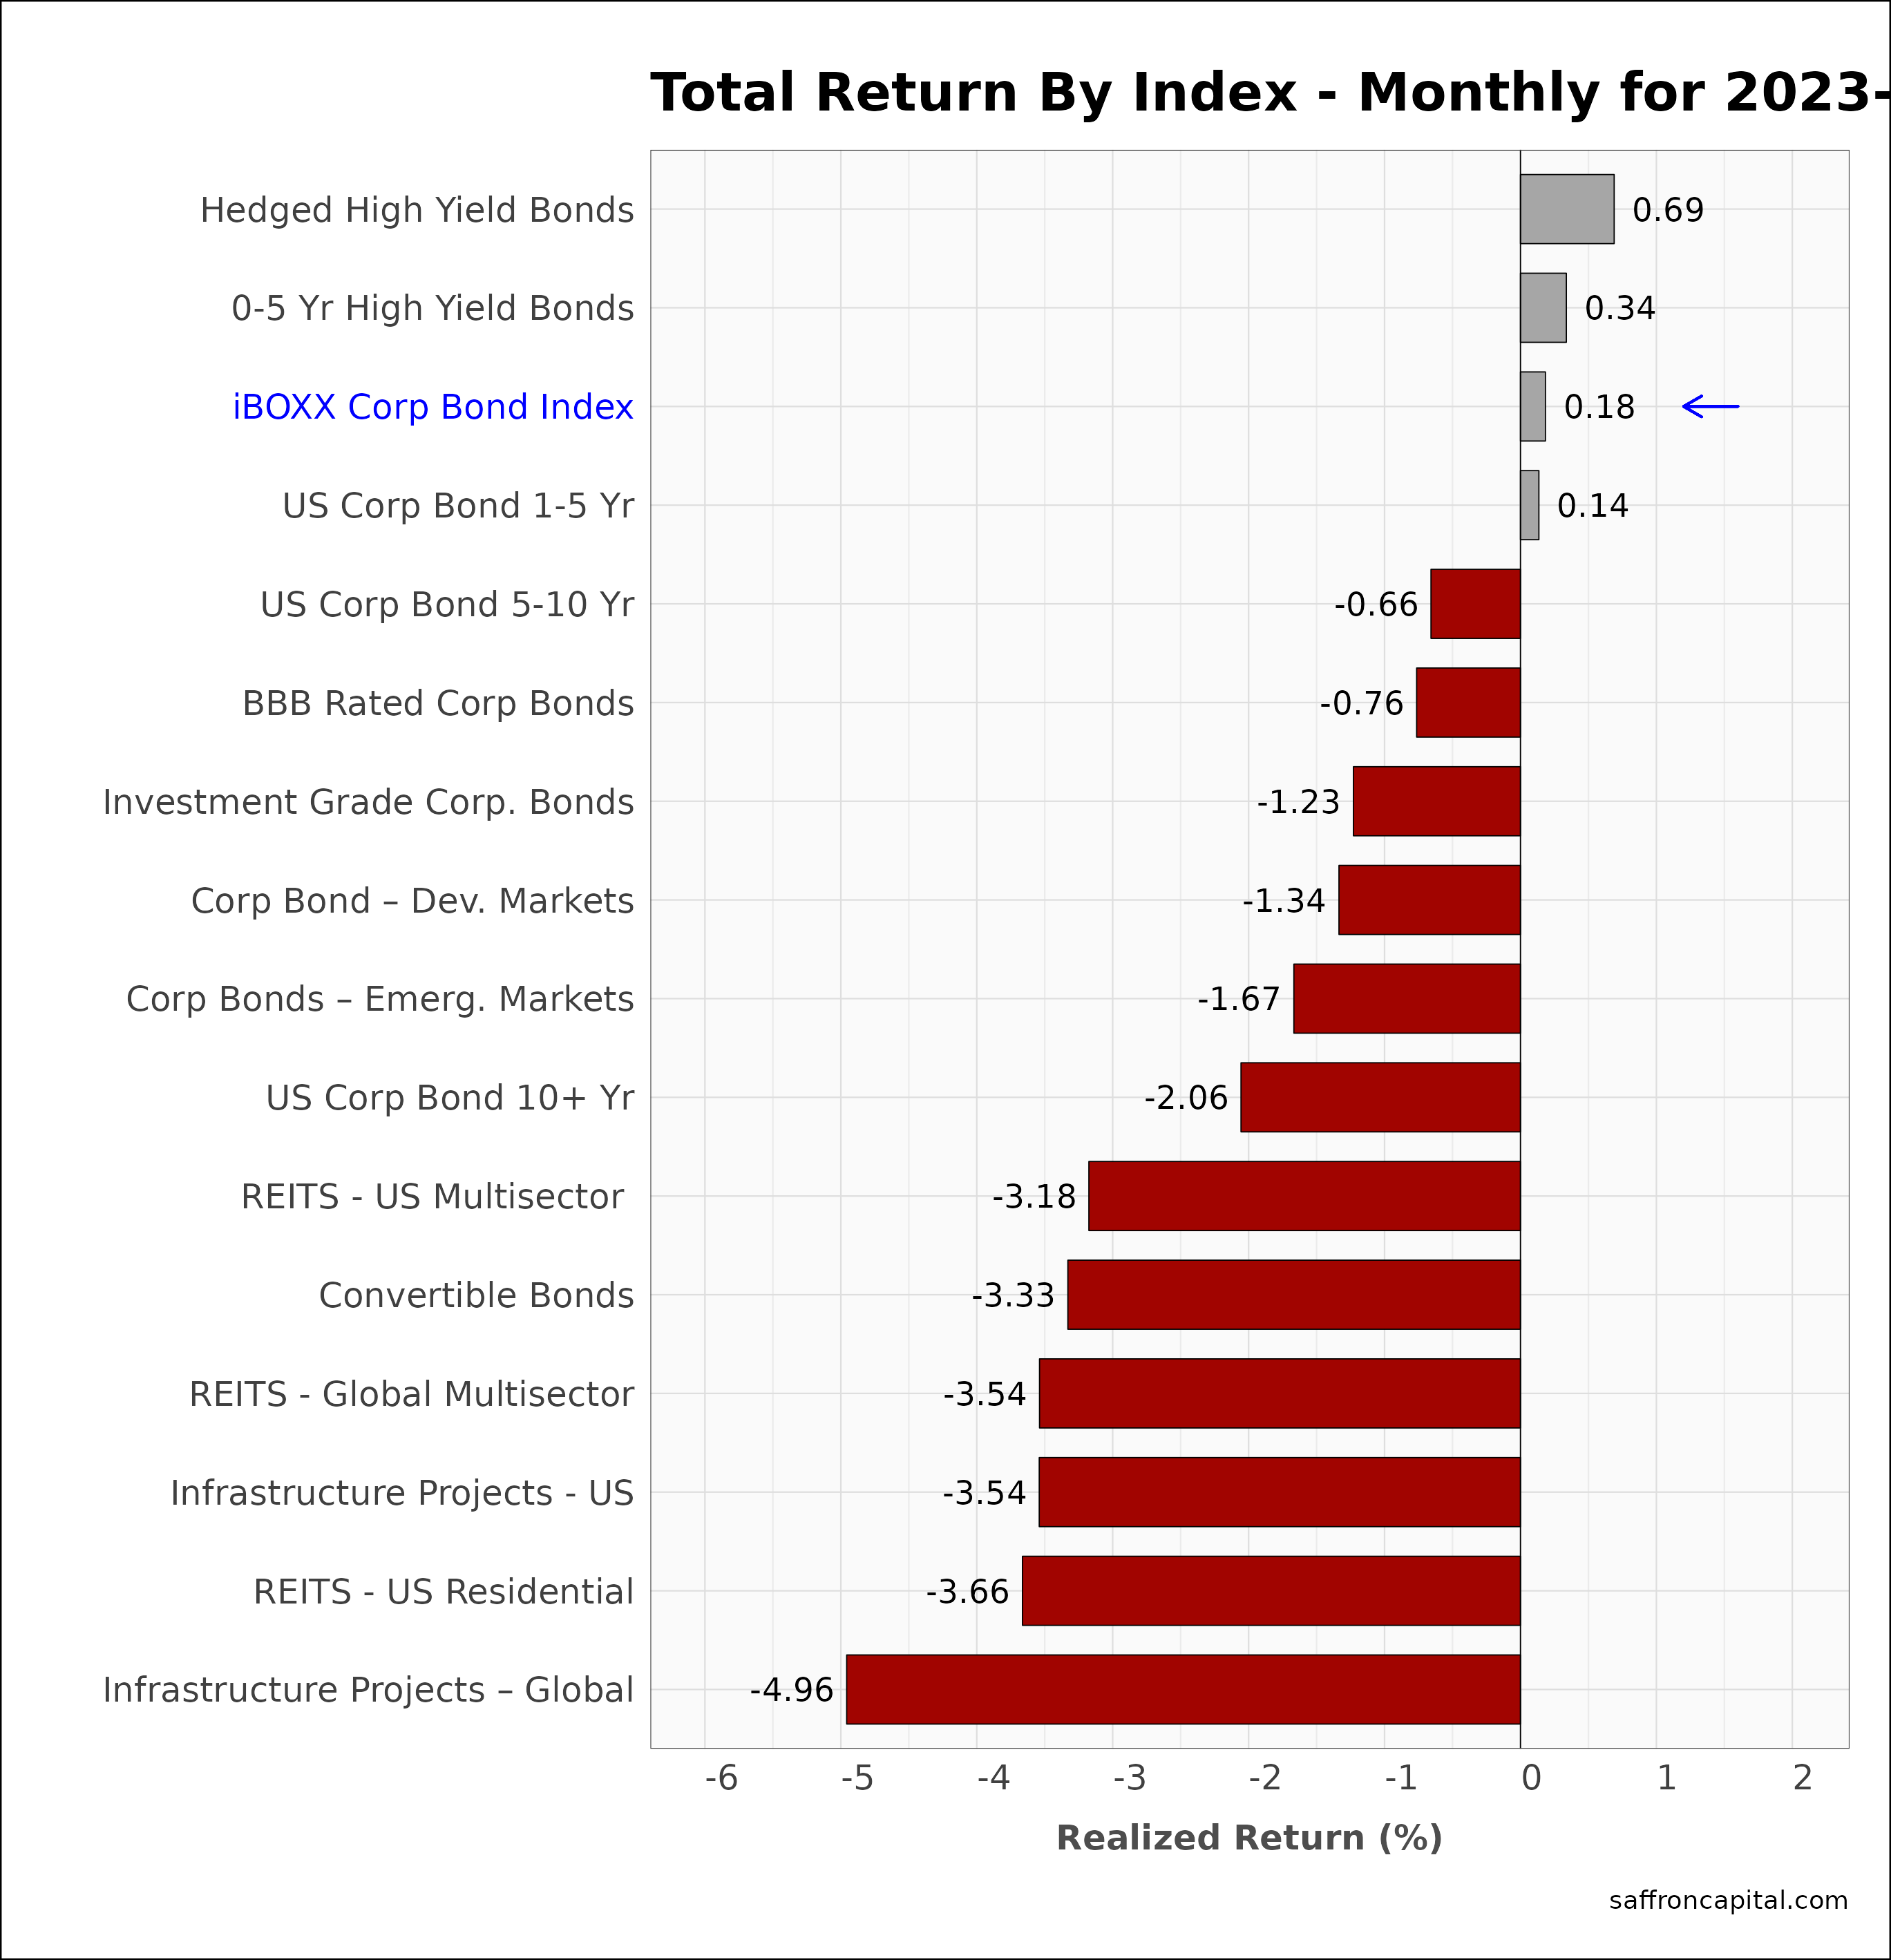
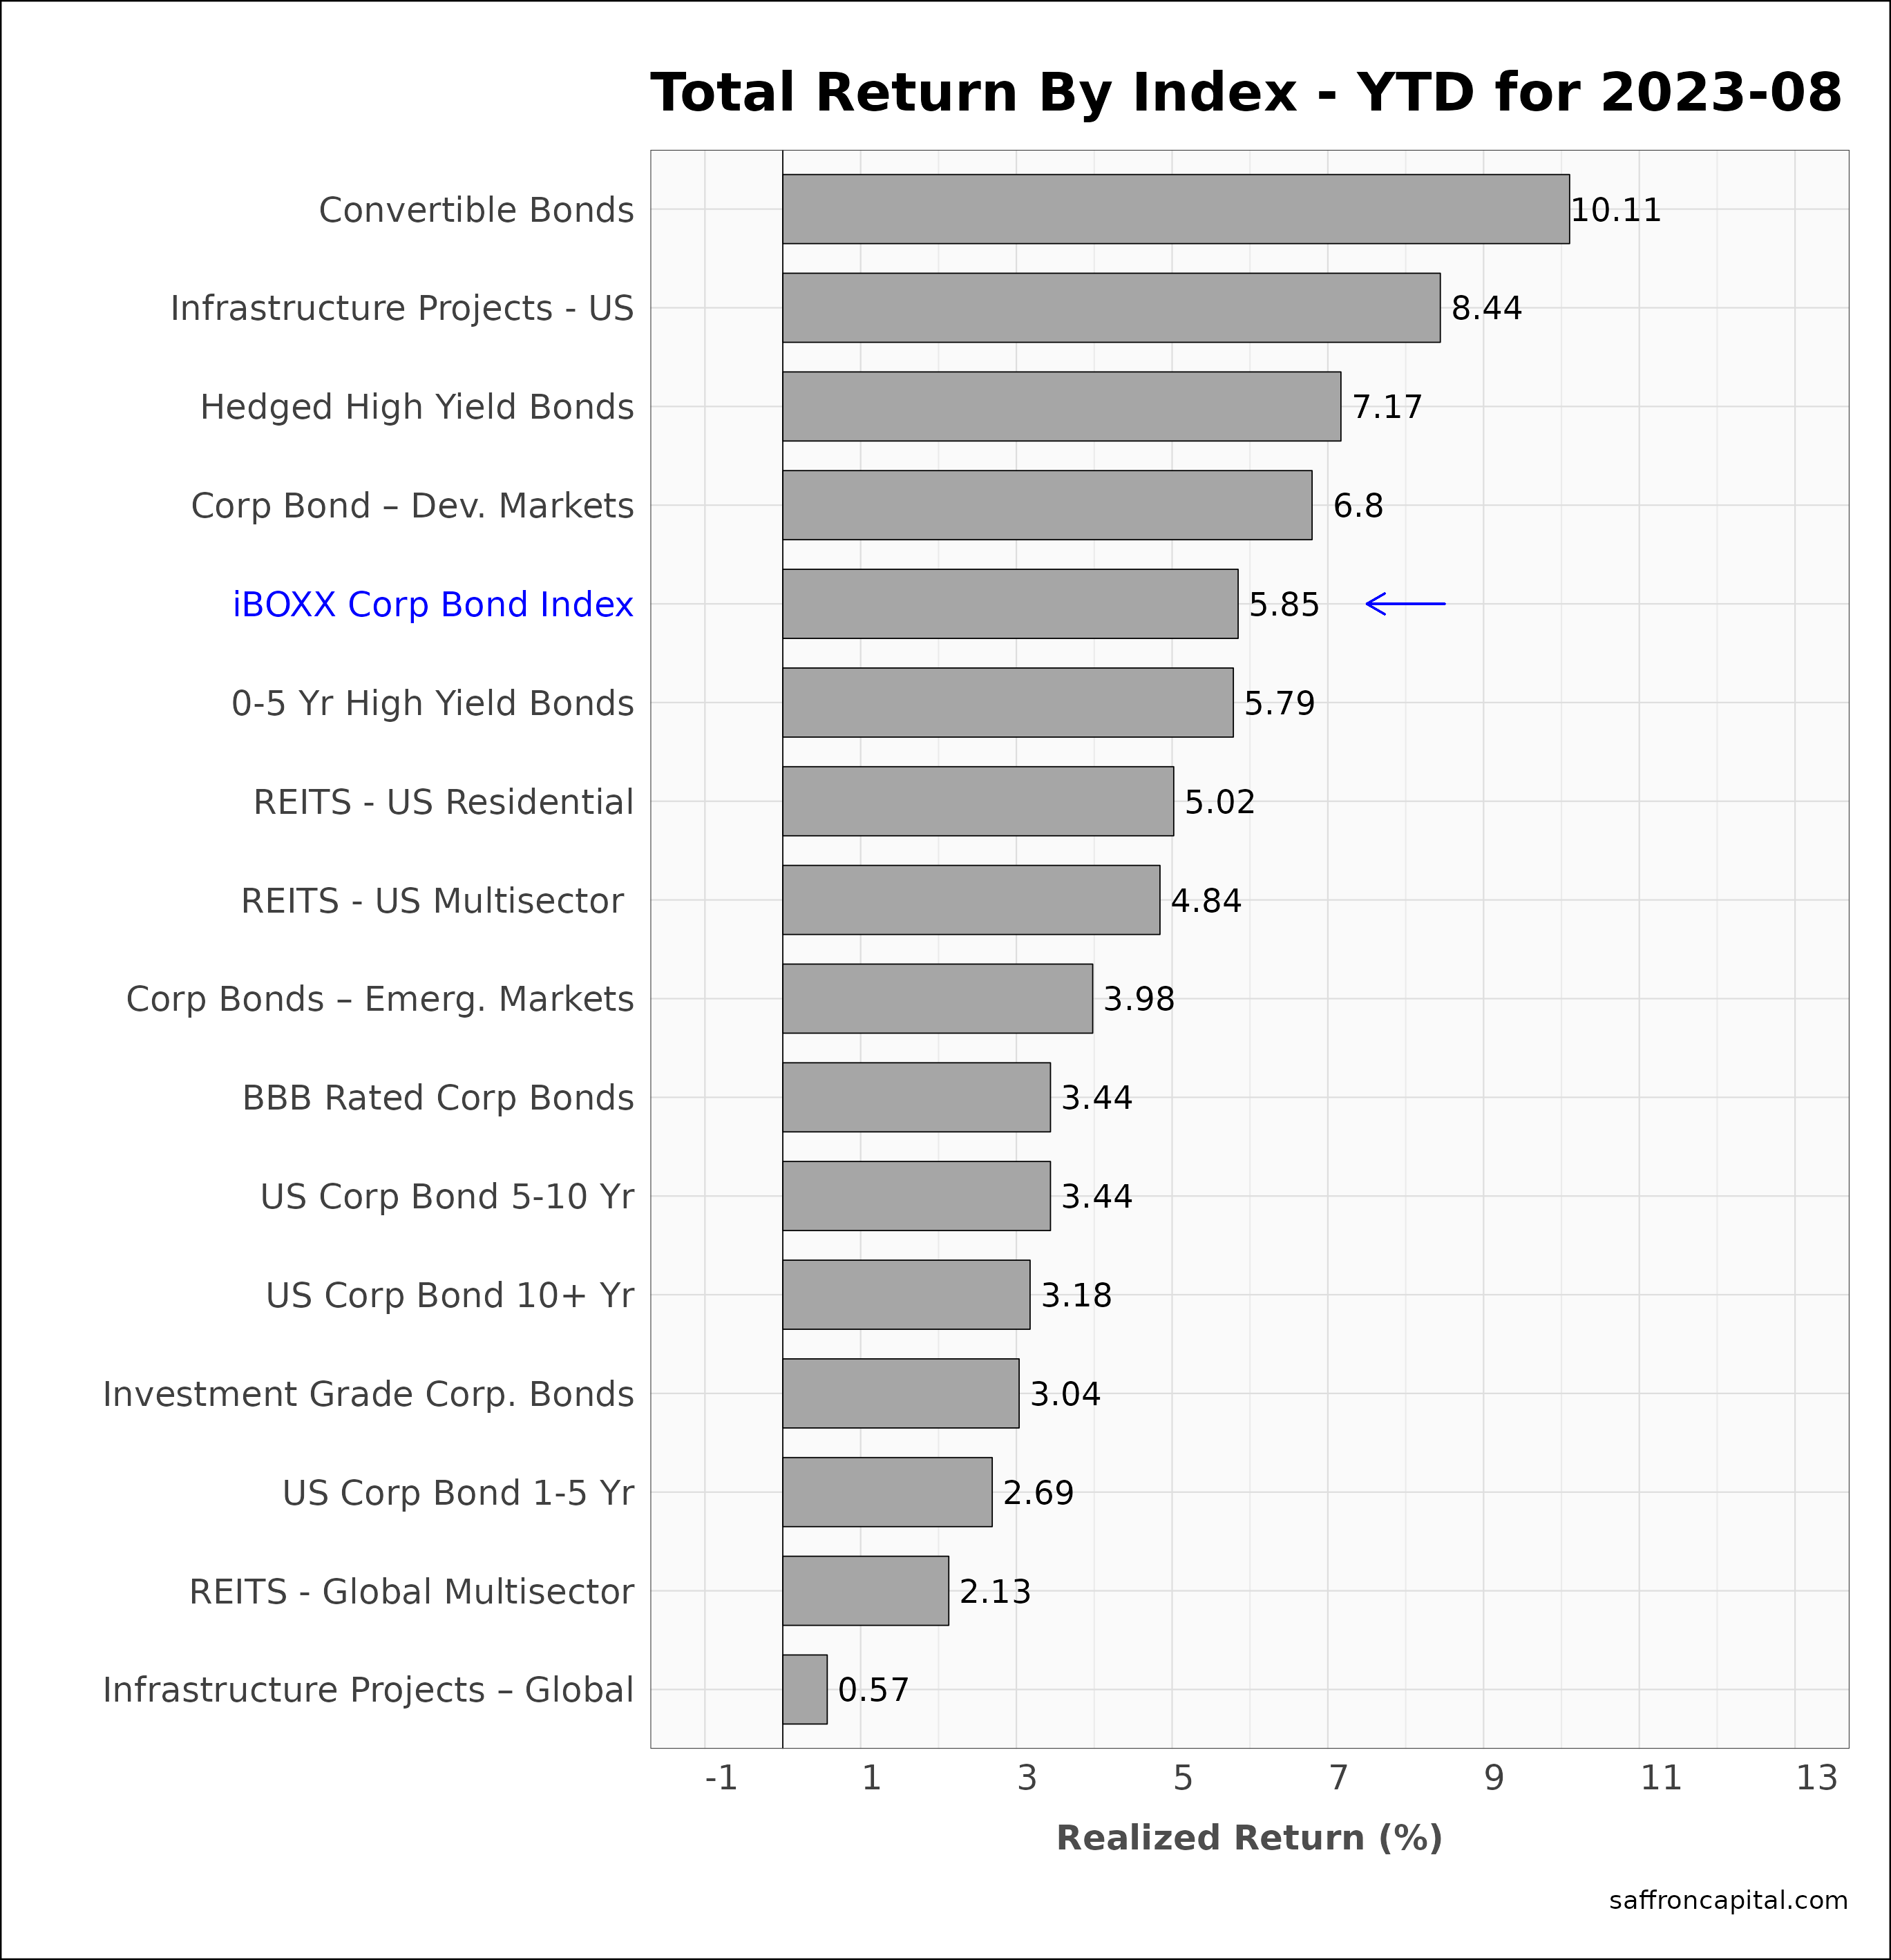
Corporate & Infrastructure Bonds
The iBoxx Corporate Bond Index (+0.18%) again outperformed Treasury bonds in August. Performance was lead by Hedged High Yield Bonds (+0.69%) and short-term High Yield Bonds (+0.34%). Global Infrastructure Project Bonds (-4.96%) were weaker than US Infrastructure Bonds (-3.54%) in August, and performance for both set the floor for the group. Looking at the big picture and year-to-date performance, the best returns were generated by Convertible Bonds (+10.11%), US Infrastructure Bonds (+8.44%), and Hedged High Yield Bonds (+7.17%).
Click to enlarge
Commodities
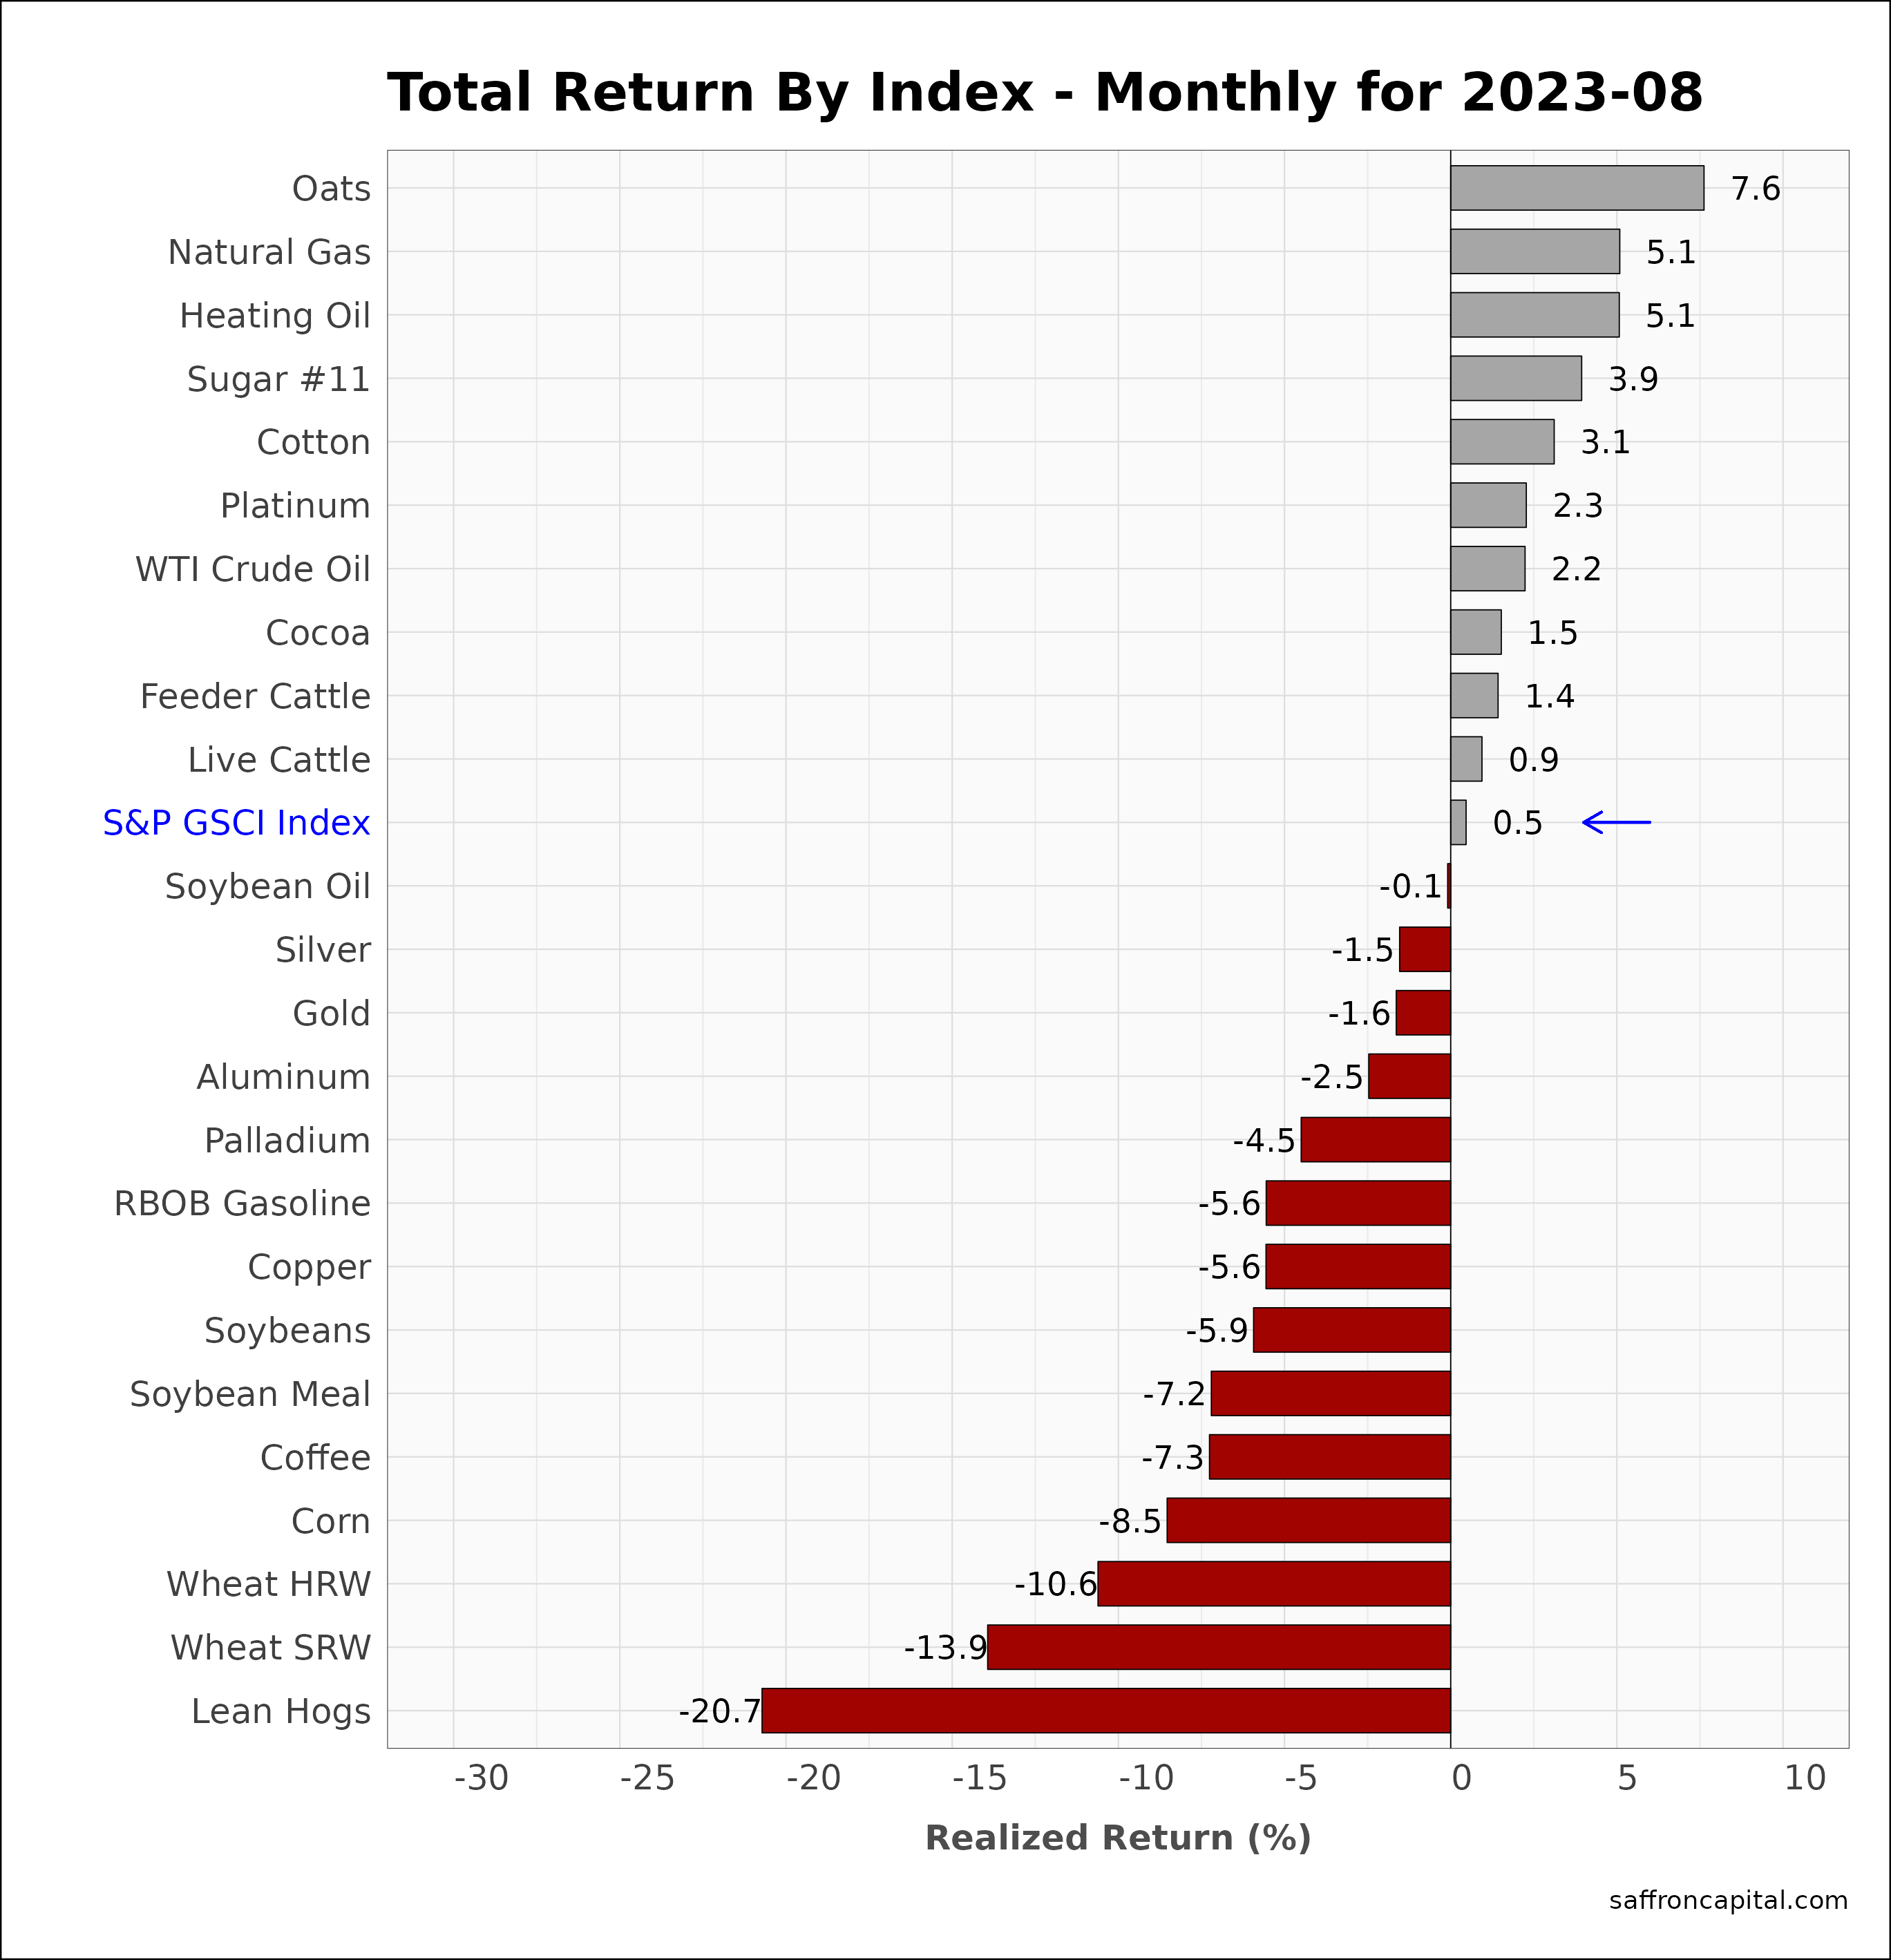
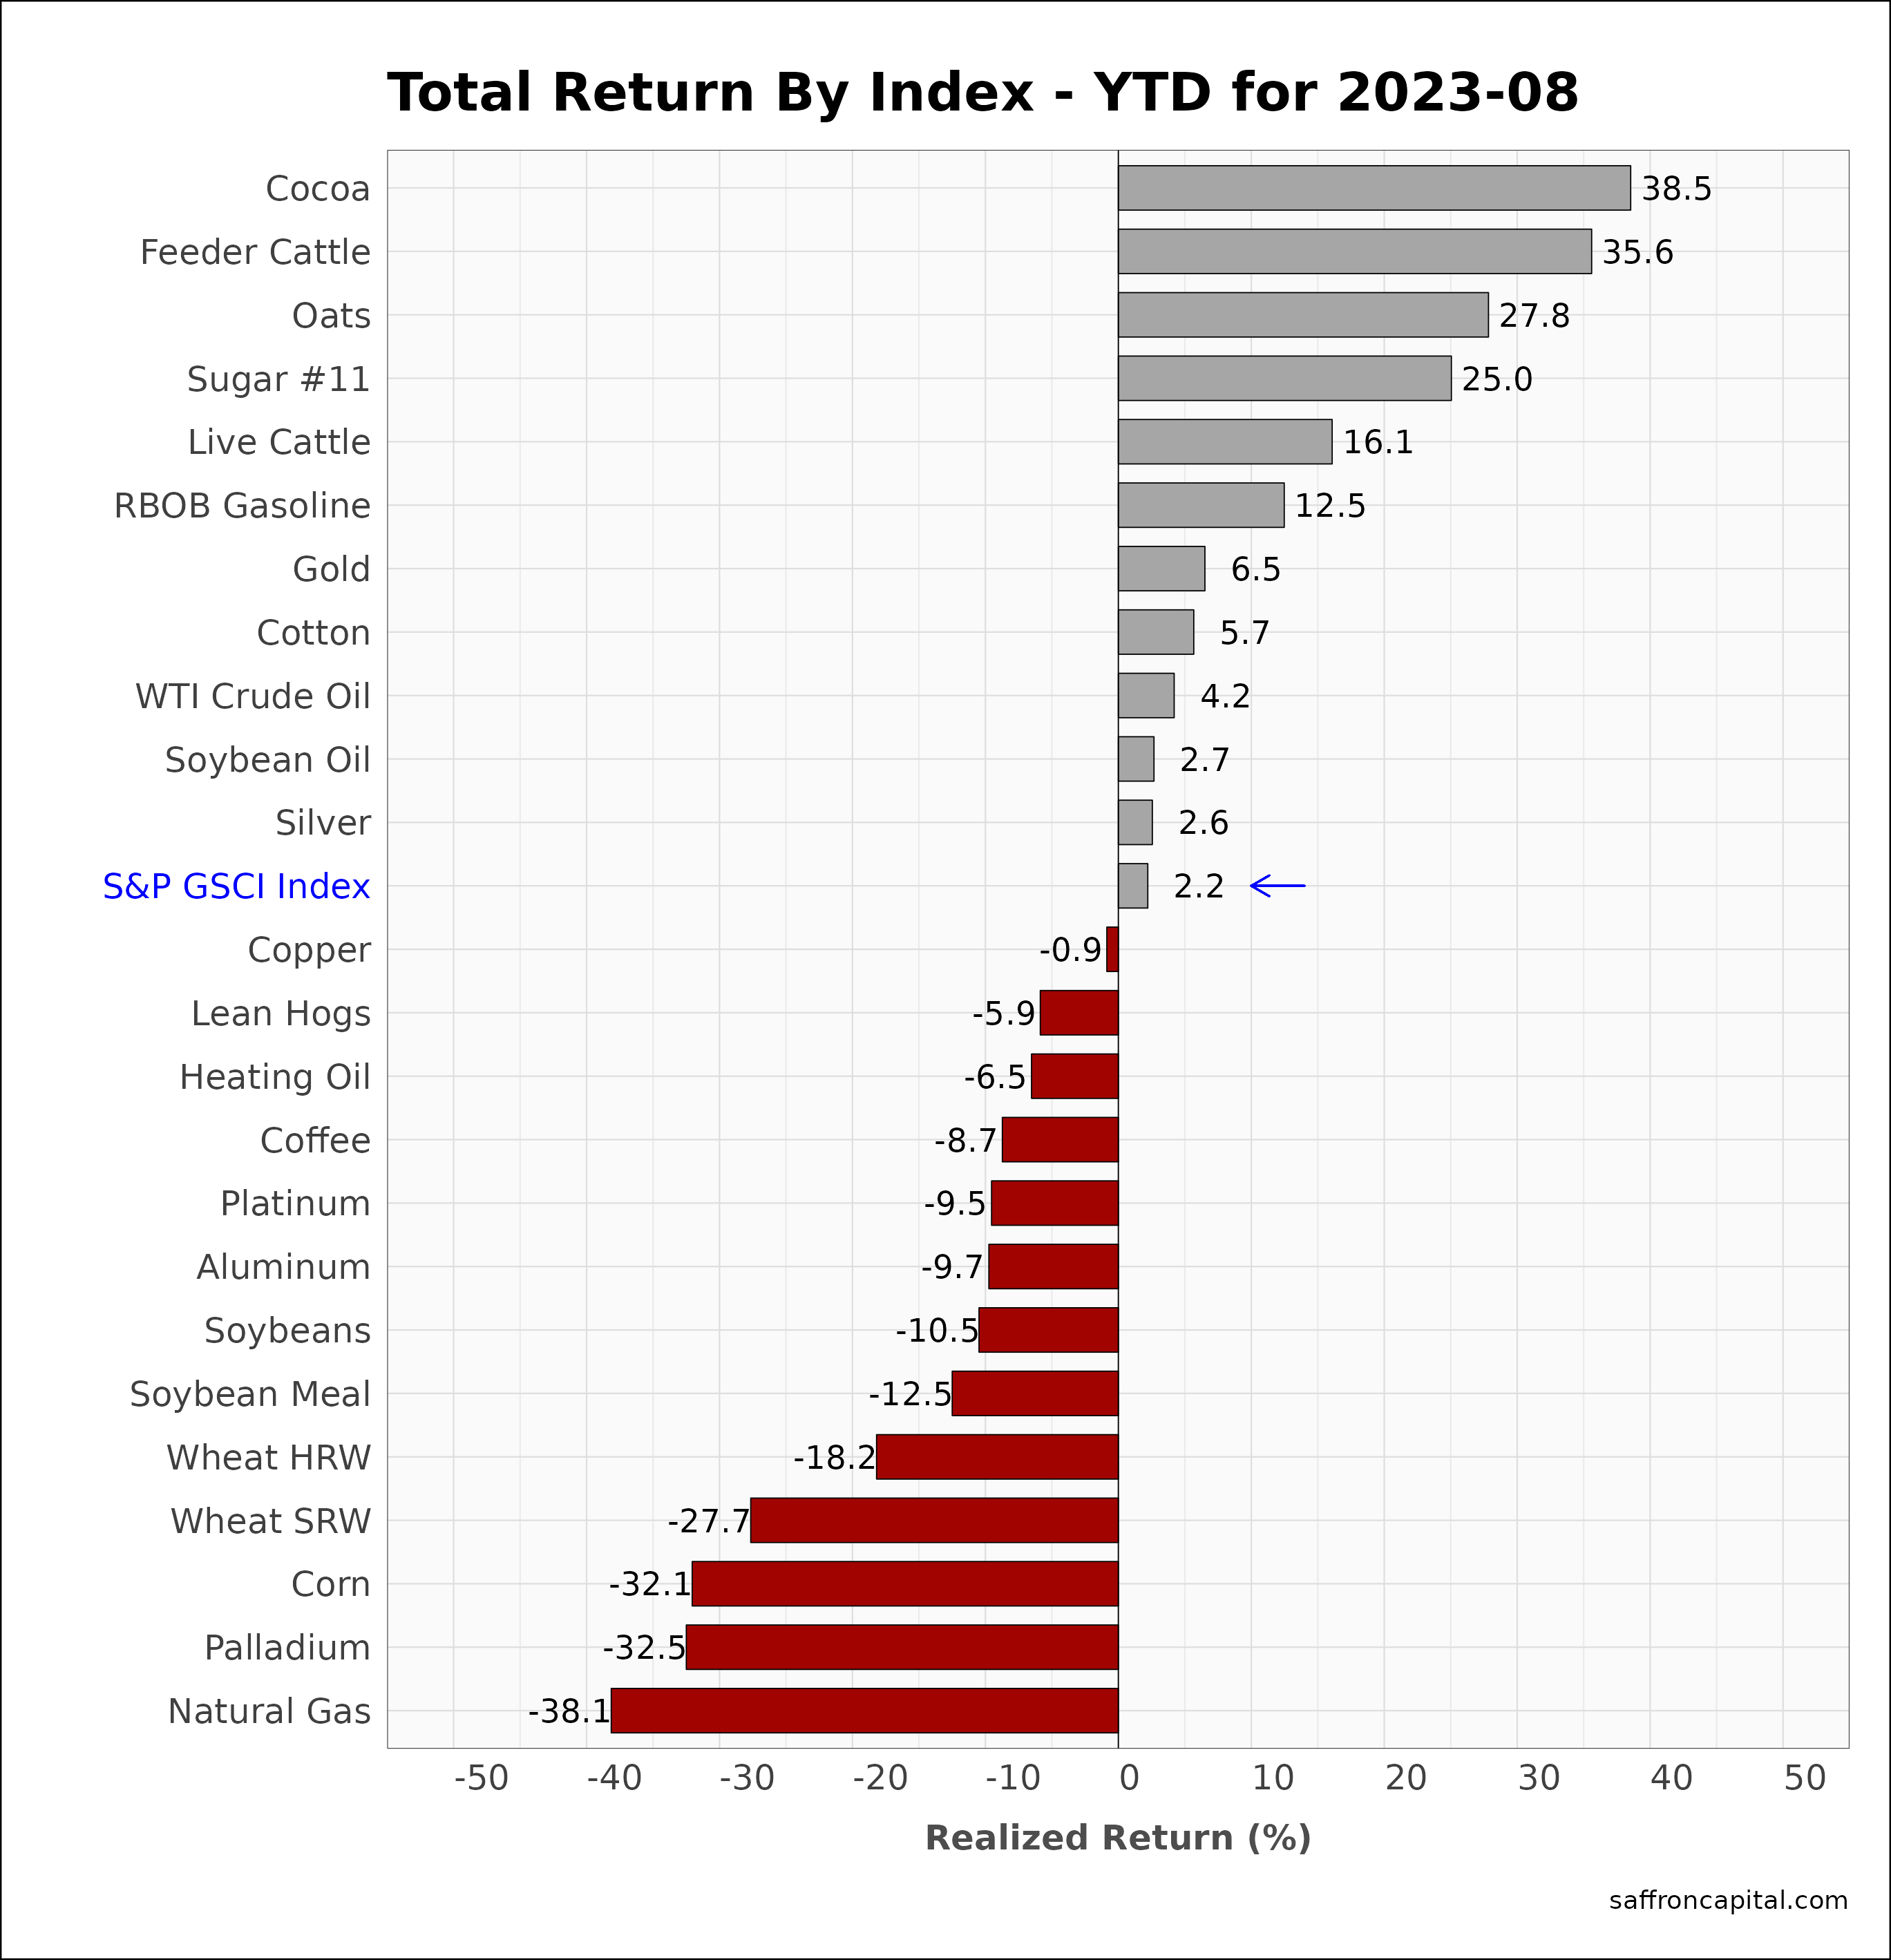
August 2023 returns for the S&P GSCI index (+0.5%) confirmed highly variable results for the asset group. For example, Oats (+7.6%) remained strong while other grains like Corn (-8.5%) and Wheat (-13.9%) were down. Most energy products were up, lead by natural gas (+5.1%), though gasoline was down (-5.6%). Year to date results for the commodity index (+2.2%) remain positive with Cocoa (+38.5%) running super hot and Natural Gas (-38.1%) down significantly.
Click to enlarge
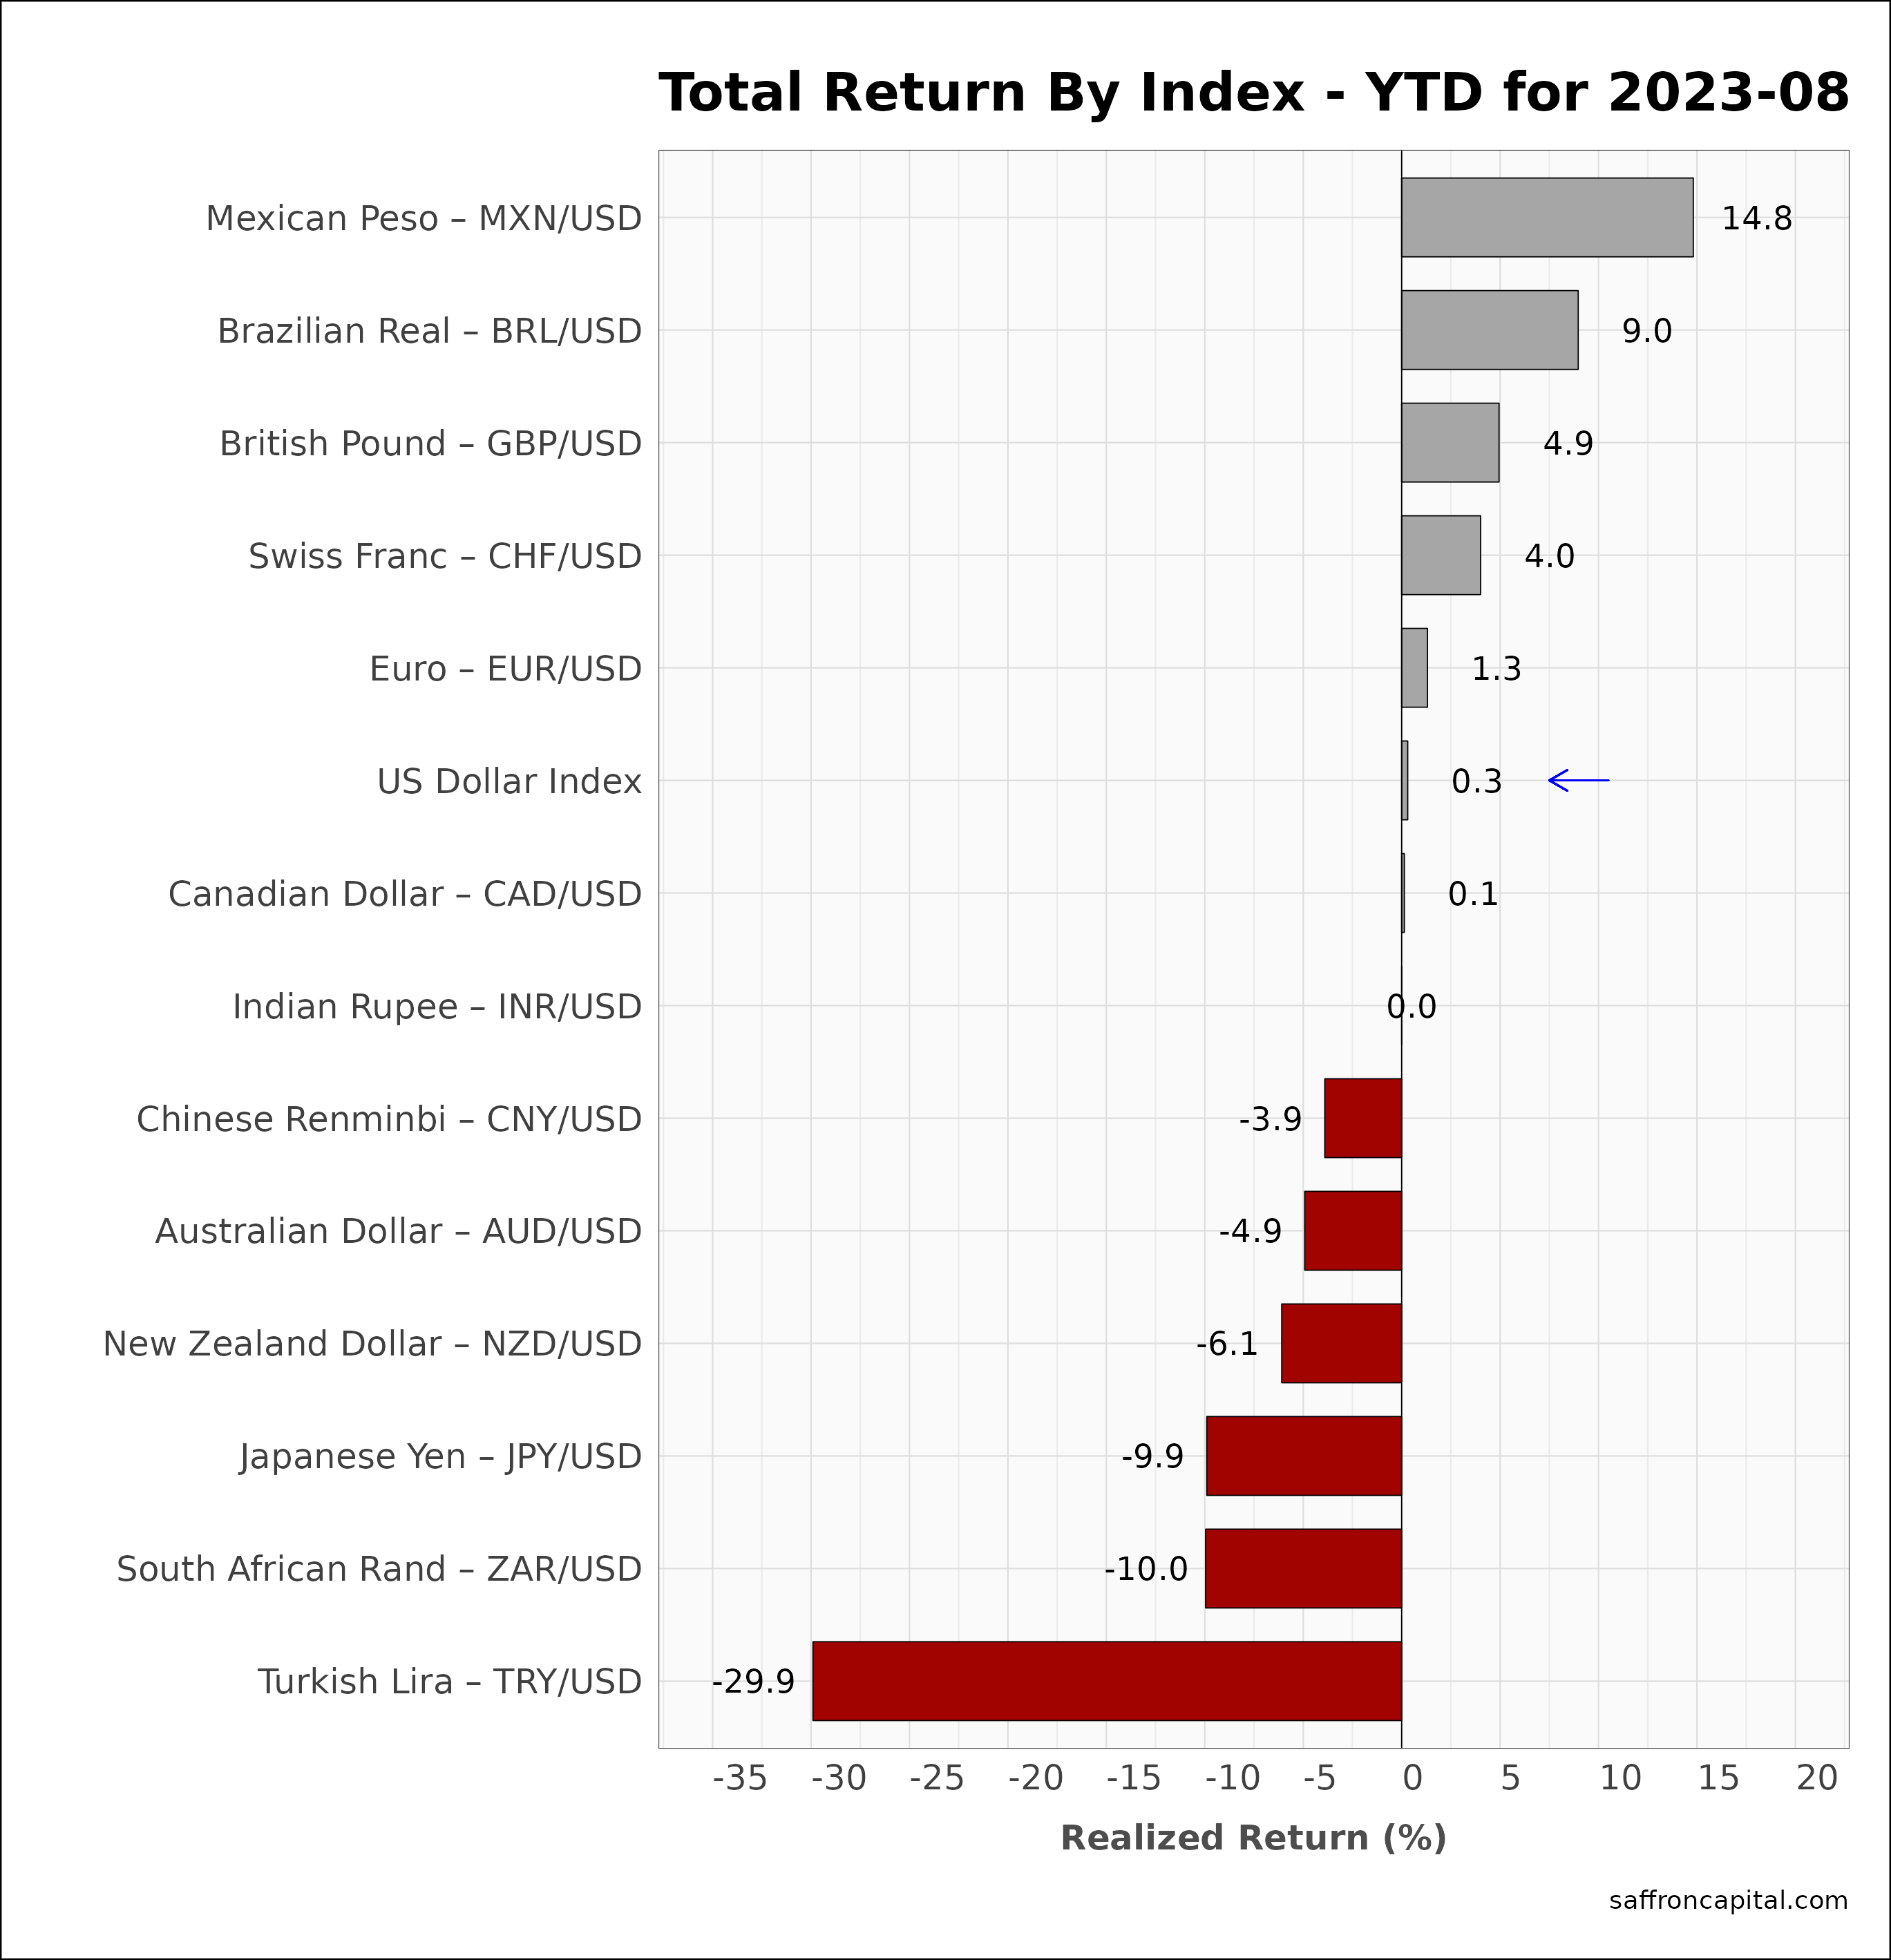
Currencies
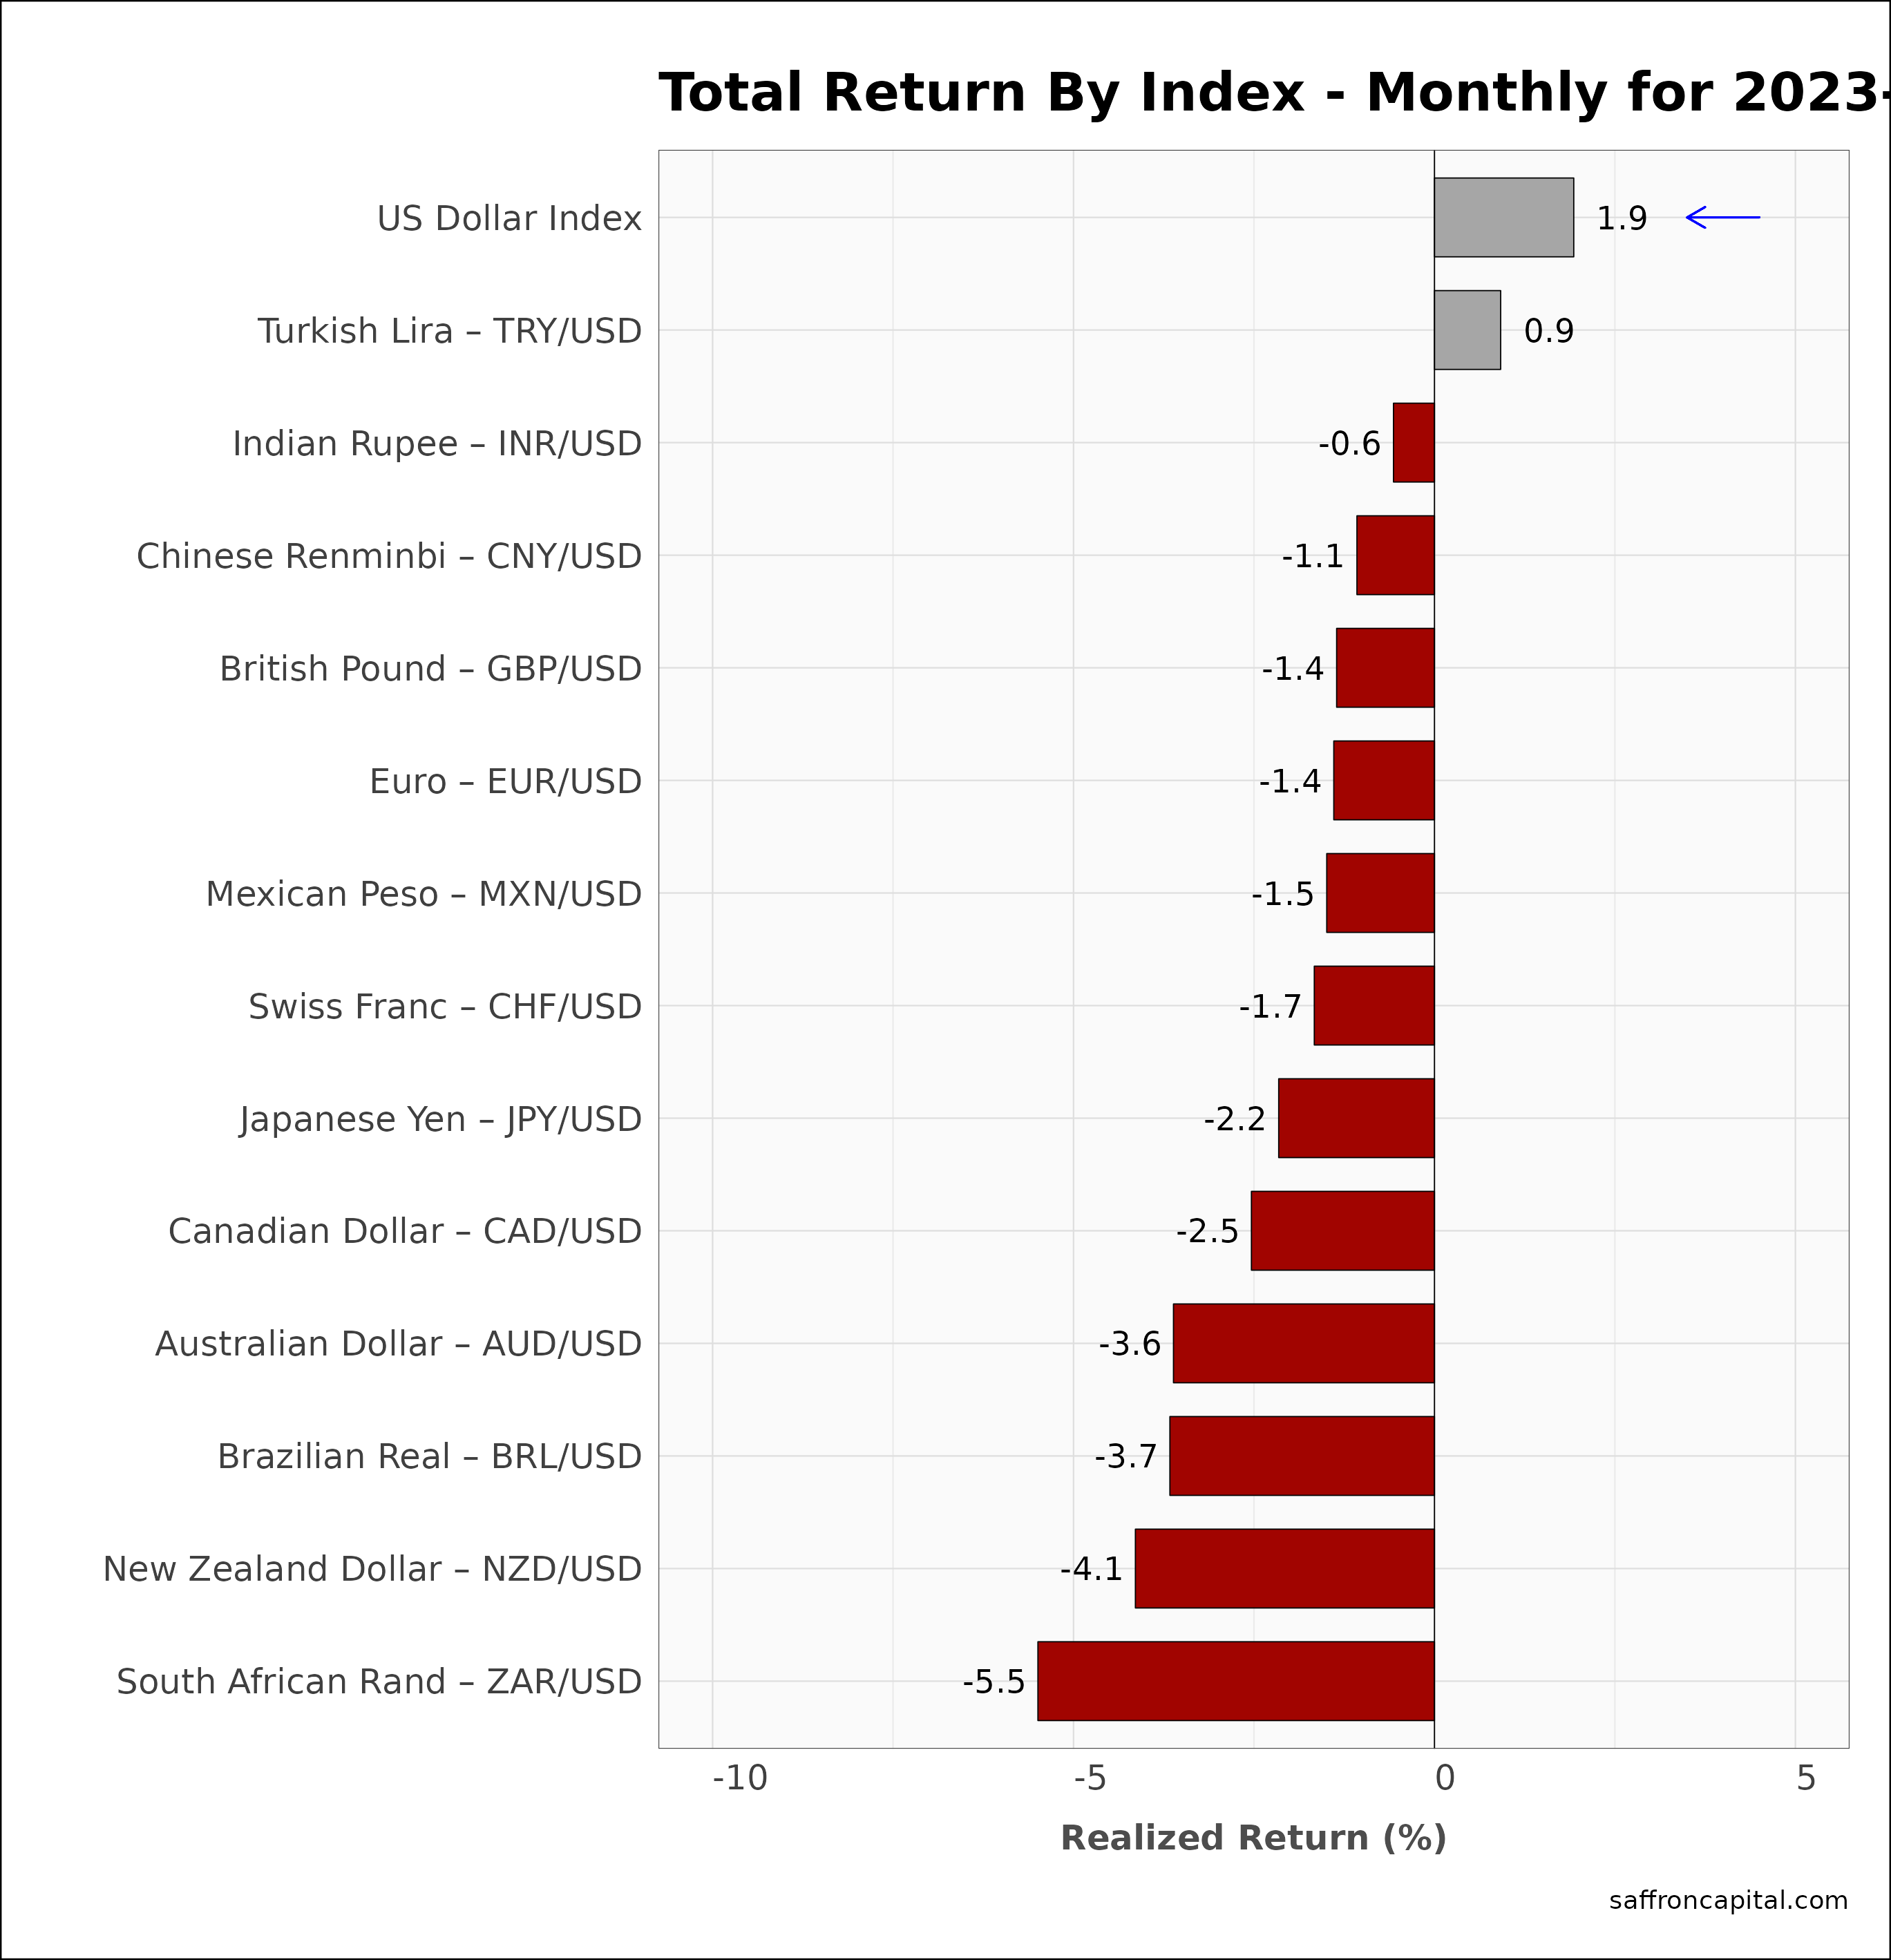
Finally, the US Dollar (+1.9%) benefited from strong yields in August, triggering declines across all major currencies. Since January, the dollar (-0.3%) is unchanged, while the Euro (+1.3%) is modestly stronger. The Mexican Peso (+14.8%) has been the strongest currency, while the weakest has been the Turkish Lira (-29.9%).
Click to enlarge
Have questions or concerns about the performance of your portfolio? Whatever your needs are, we are here to listen and to help. Schedule time with us here.


