3Q.2023 Earnings Update – S&P 500
September 11, 2023
3Q Earnings Update – S&P 500
October 17, 2023Major Asset Classes
September 2023
Performance Comparison
Introduction
September 2023 returns were negative across many asset groups. U.S. equities declined two months in a row for their first quarterly decline since Q3 2022. In addition, rates on long bonds posted their biggest quarterly advance since 2009. In response, the US Dollar continued to advance, completing eleven weeks of positive gains for the second longest streak in 50+ years.
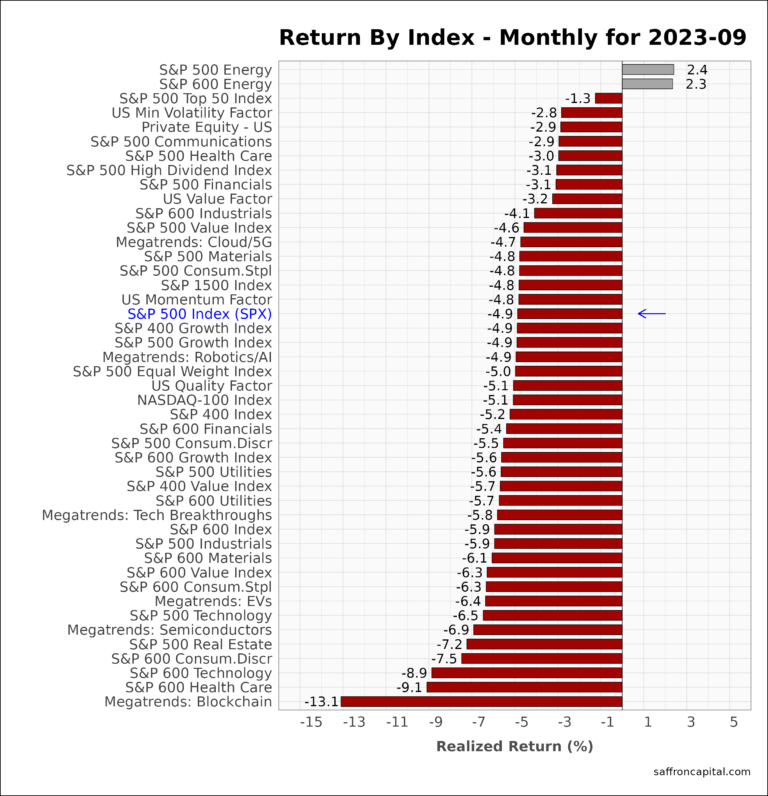
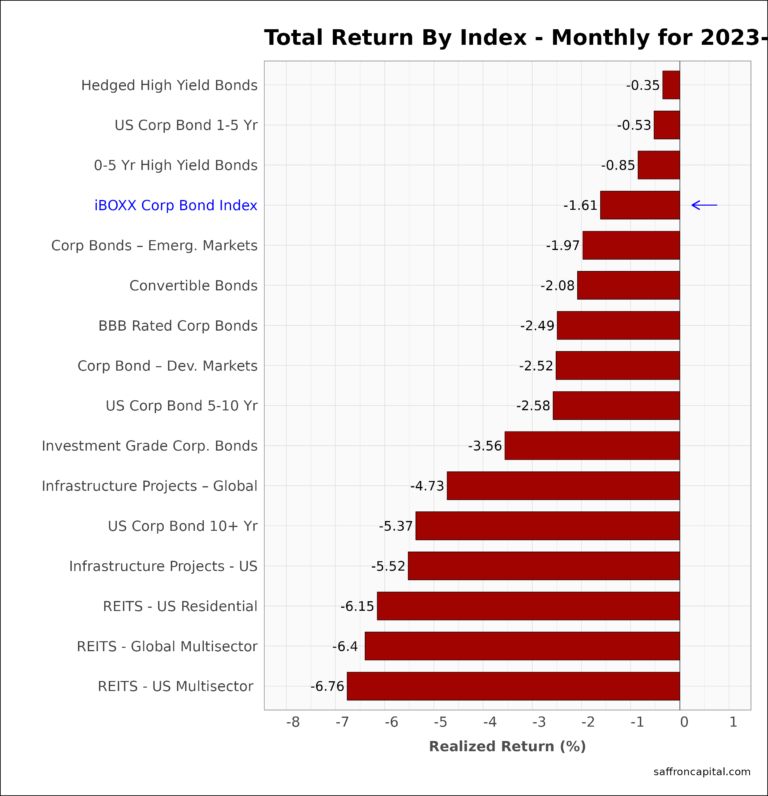
Against this backdrop, the S&P 500 index was down -4.9% and the Nasdaq index was down -5.1%. Fixed income markets fared worse with the the 10-Yr bond falling -6.7%, while the 20-yr bonds shed -9.0%. In comparison, the iBOXX Corporate Bond Index was down only -1.6%, and hedged high yield bonds proved to be a safe have, falling only -0.35%. Raw material prices continued to inflate with live cattle prices surging +37.4% on drought impacts and WTI increasing +13.0% on cuts by OPEC+.
The following analysis provides a visual record of September 2023 returns across and within the major asset classes.
weeks
US Equities
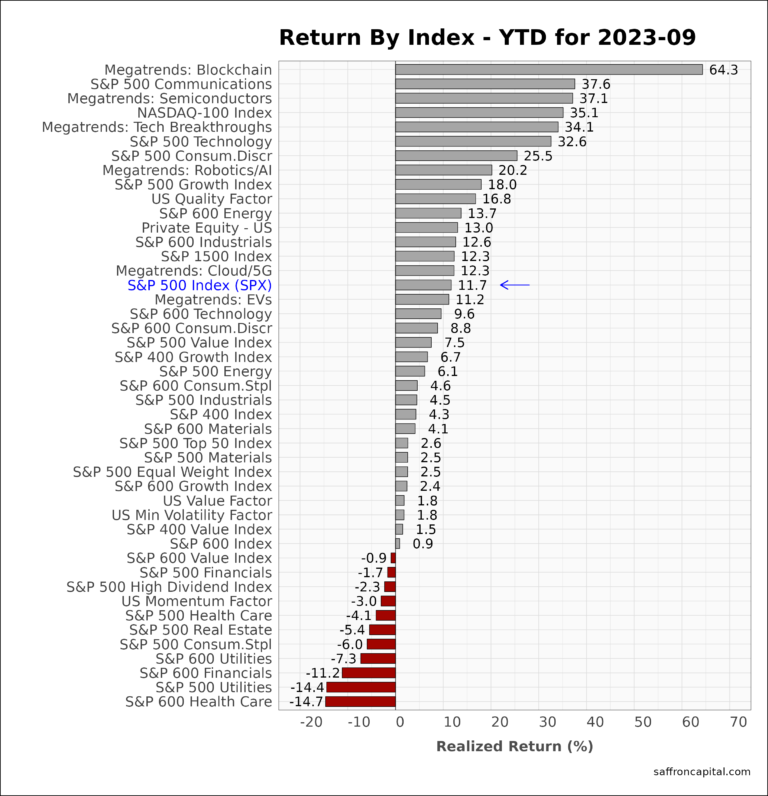
Energy shares (+2.4%) were the only large-cap sector with positive returns in September. Red ink hit the S&P 500 index (-4.9%) and nearly ever tracked index. The worse performers were blockchain shares (-13.1%), small cap healthcare (-9.1%), and small cap technology (-8.9%). The best factor portfolios were minimum volatility shares (-2.9%) and US. value shares (-3.2%), which beat index by 200 and 170 basis points (bps). On a year-to-date (YTD) basis, the S&P 500 index is up +11.7%, while the NASDAQ 100 index is up +35.1%. Looking deeper, the S&P 500 has grown by $7.2 Trillion YTD, but the top 20 stocks account for 85% of that gain. The remaining 483 stocks in the index have an average YTD return of less than +2%.
Developed Market Equities
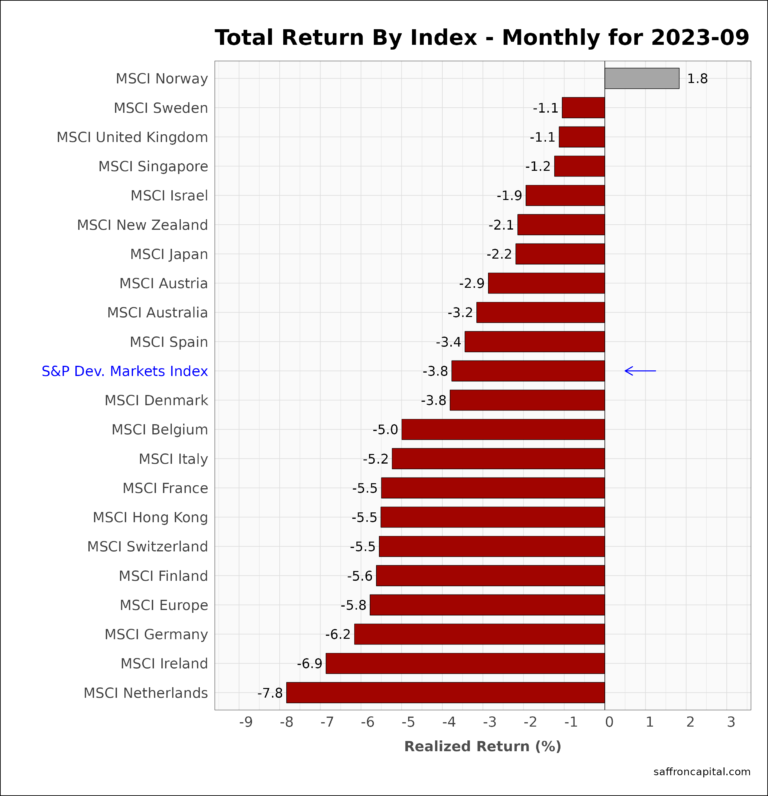
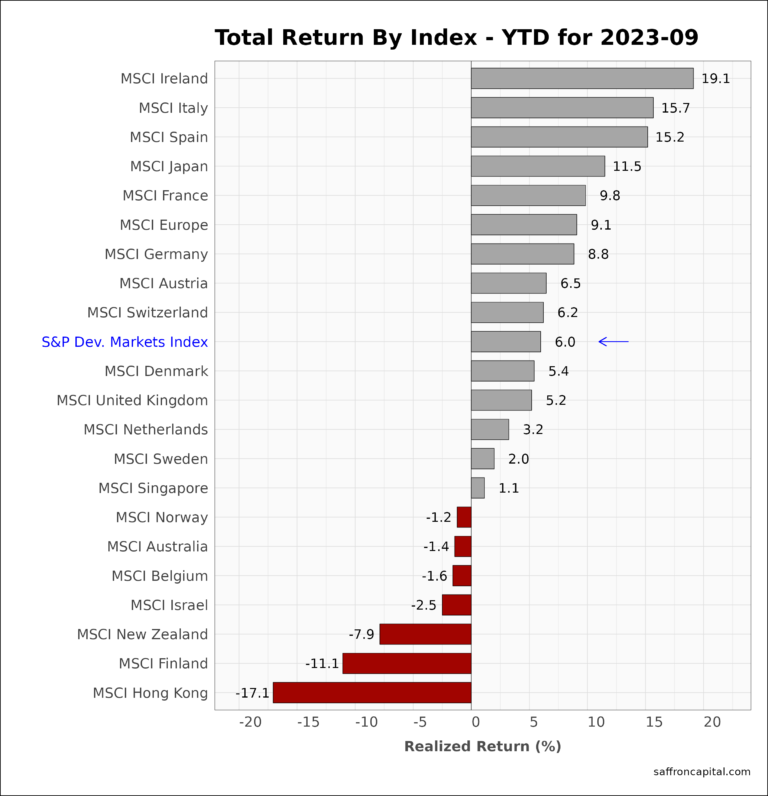
International developed markets (-3.8%) followed US stocks down in September, but outperformed US shares by 110 basis points. Norway (+1.8%) was the only positive country index. Other top MSCI index performers include Sweden (-1.1%) and the United Kingdom (-1.1%). Economies in Northwest Europe had the worse returns and included the Netherlands (-7.8%), Ireland (-6.9%) and Germany (-6.2%). For the first 3 quarters, developed markets (+6.0%) are lagging US indices but have enjoyed healthier market internals or market breadth. Moreover, the best performers continue to lead the US year-to-date, notably Ireland (+19.1%), Italy (+15.7%) and Spain (+15.2%). Hong Kong (-17.1%) has been the weakest of the developed markets in 2023.
Click to enlarge
Emerging Market Equities
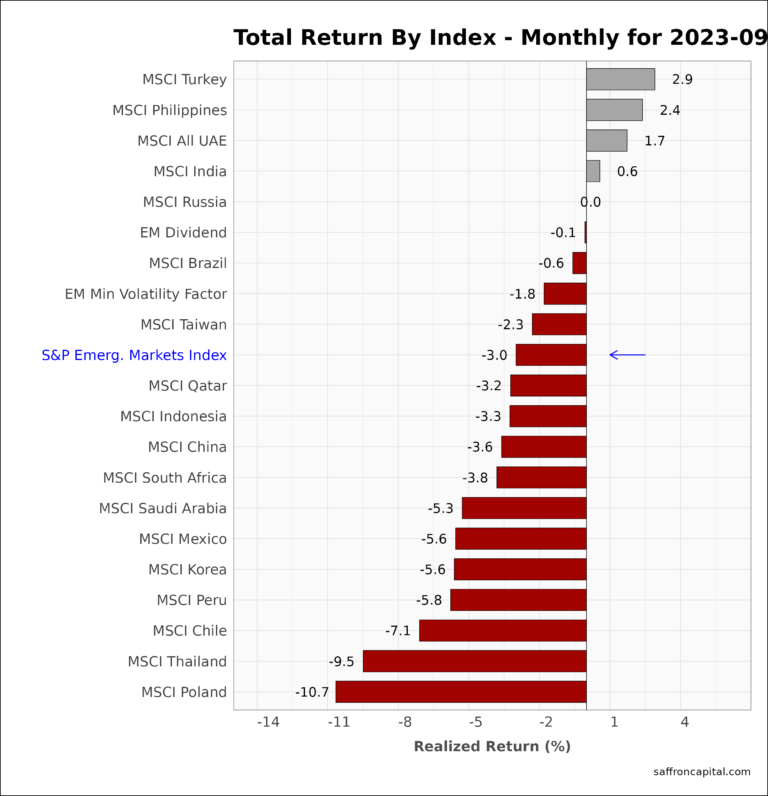
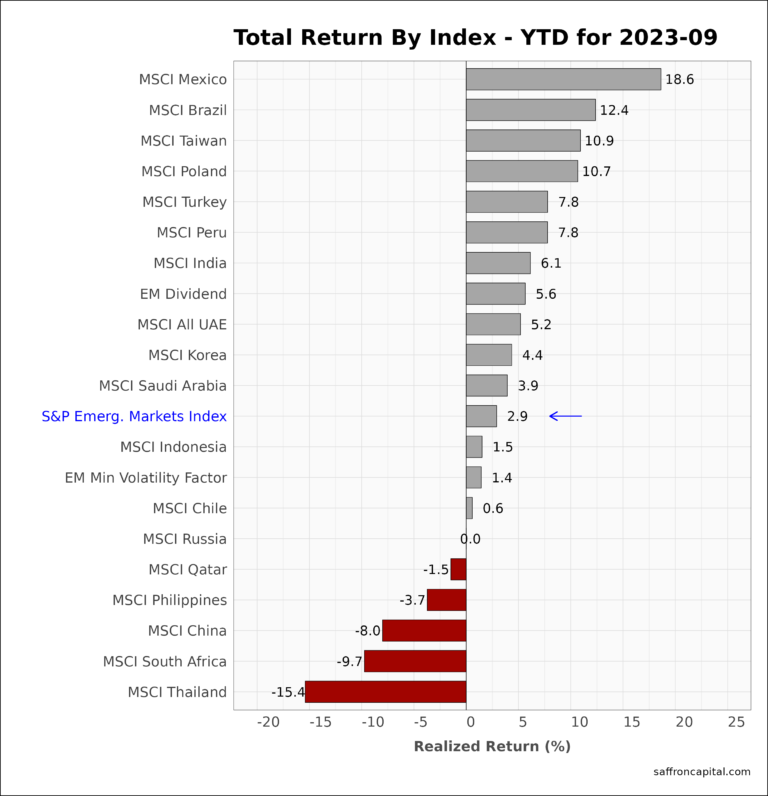
September 2023 returns for the S&P Emerging Markets Index (-3.8%) suffered on dollar strength, but still outperformed the US and developed markets. For instance, strong returns were realized again in Turkey (+2.9%), the Philippines (+2.4%), the UAE (+1.7%), and India (+0.6%). Taiwan (-2.3%) beat teh EM index, while China (-3.6%) lagged. In comparison, YTD performance for emerging markets (+2.9%) continues to be lead by Mexico (+18.6%), Brazil (+12.4%), and Taiwan (+10.9%).
Government Bonds
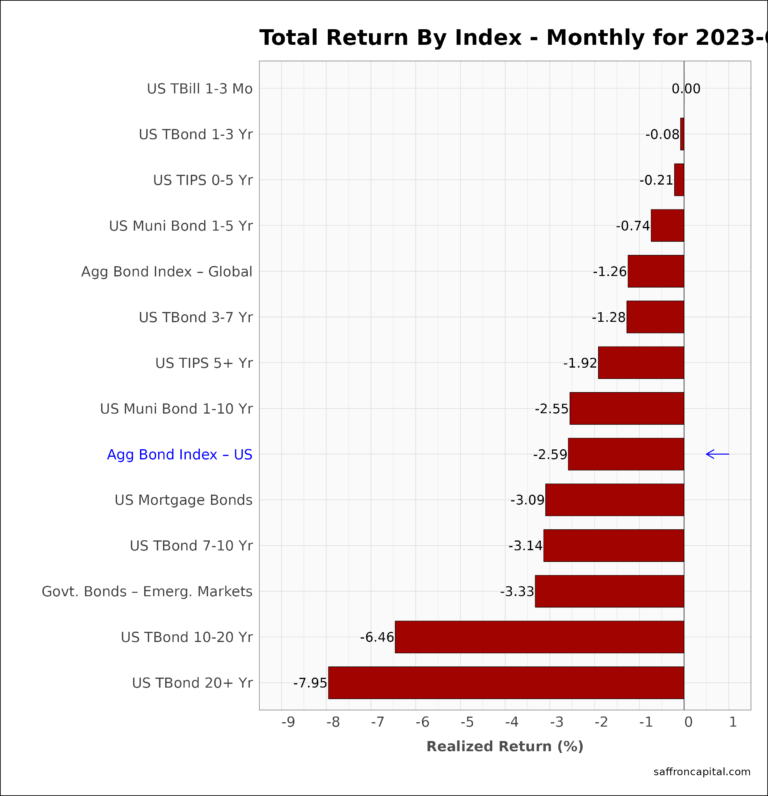
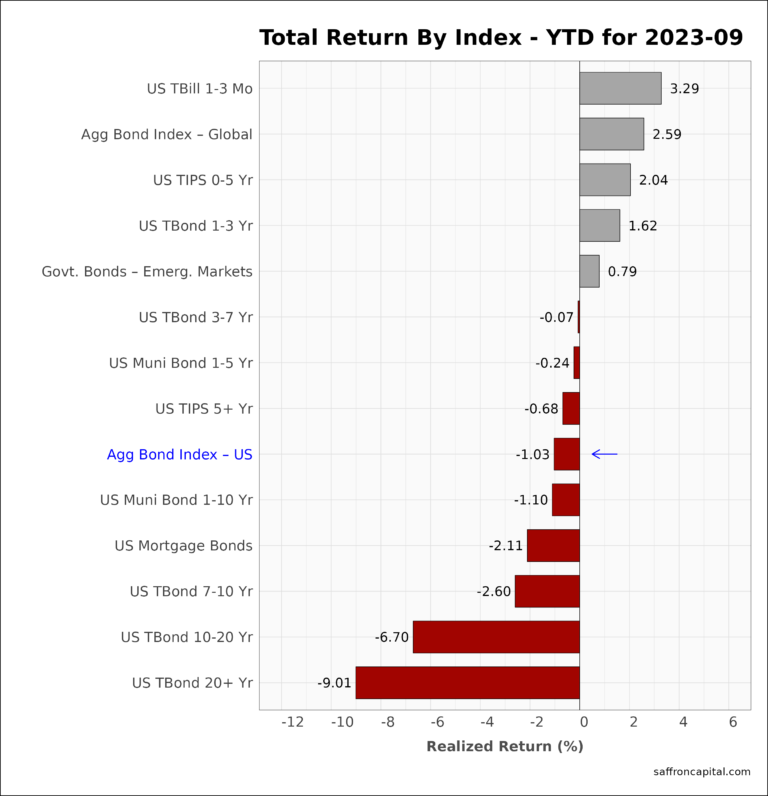
September returns for the Aggregate US Government Bonds Index (-2.59%) showed that negative momentum in the bond has accelerated. Short-term T-Bills (+0.0%) proved to be a safe haven from price risk with yields increasing to 5.4%. Short-term municipal bonds (-0.74%) also had minimal price risk (-0.74%) and offered tax-adjusted yields approaching 8.0% in some cases. Meanwhile, long duration yields were up and bonds maturing in 20+ years (-7.95%) were wrecked. Since January, returns for the Aggregate US Bond index (-1.03%) are yet to match realized inflation in 2023. The best total returns YTD can be found in US T-Bills (+3.29%) and the Global Aggregate Bond Index (+2.59%).
Corporate & Infrastructure Bonds
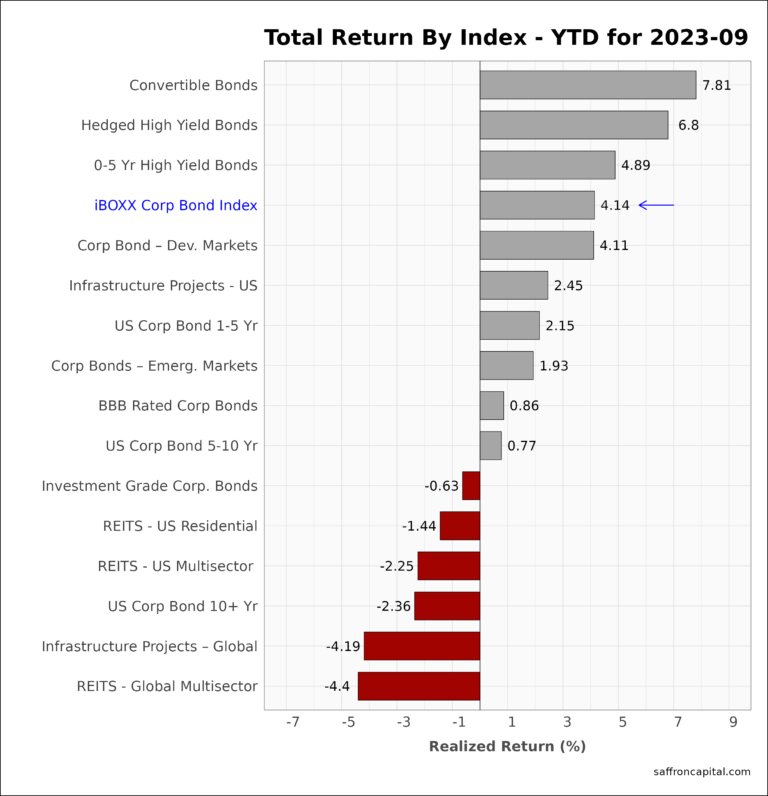
The iBoxx Corporate Bond Index (-1.61%) again outperformed Treasury bonds in August. Performance was lead by Hedged High Yield Bonds (-0.35%) and US Corporate paper maturing in 1 to 5 years (-0.53%). Global Infrastructure Project Bonds (-4.73%) outperformed US Infrastructure Bonds (-5.52%) in September. Finally, Real Estate Investment Trusts (REITS) all had losses worse than -6%. Looking at year-to-date performance, the best returns were generated by Convertible Bonds (+7.8%), Hedged High Yield Bonds (+6.80%), and o-5 year High Yield Binds (+4.89%).
Commodities
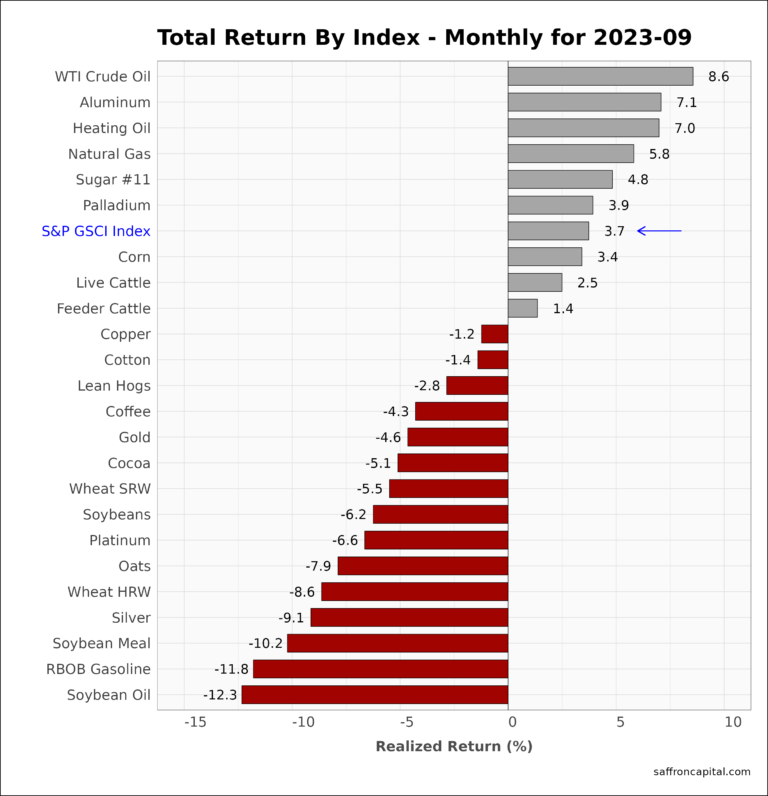
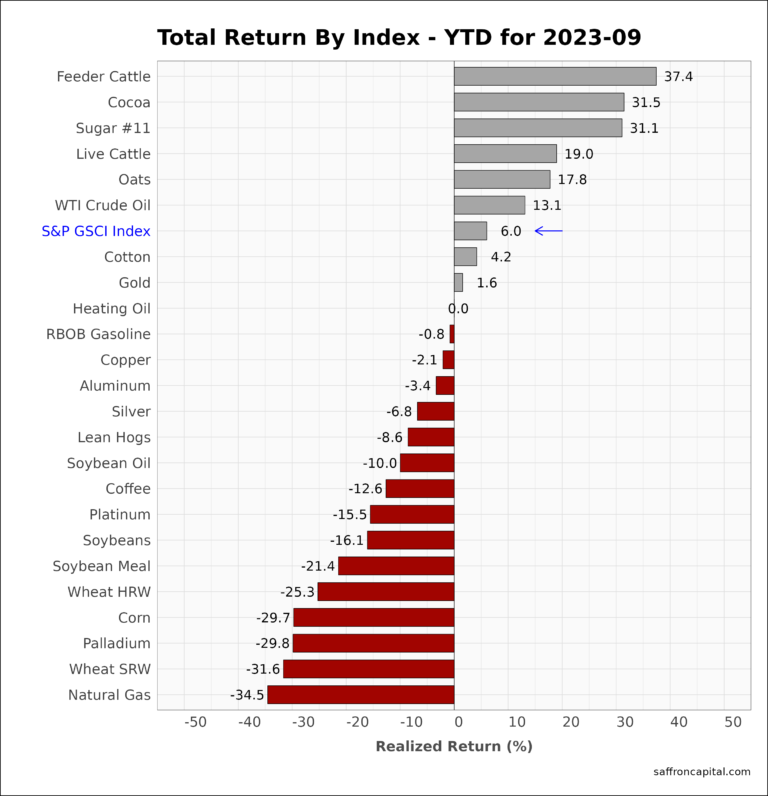
September 2023 returns for the S&P GSCI index (+3.7%) confirmed an increase in raw material prices, but with highly variable results. For example, WTI Crude Oil (+8.6%), Aluminum (+7.1%) and Heating/Diesel Fuel (+7.0) were all strong. Meanwhile, price declines were lead by Soybean Oil (-12.3%), Gasoline (-11.8%), and Soybean Meal (-10.2%). Year-to-date results for the commodity index (+6.0%) remain positive with Live Cattle (+37.4%), Cocoa (+31.5%), and Sugar #11 (+31.1%) up significantly.
Currencies
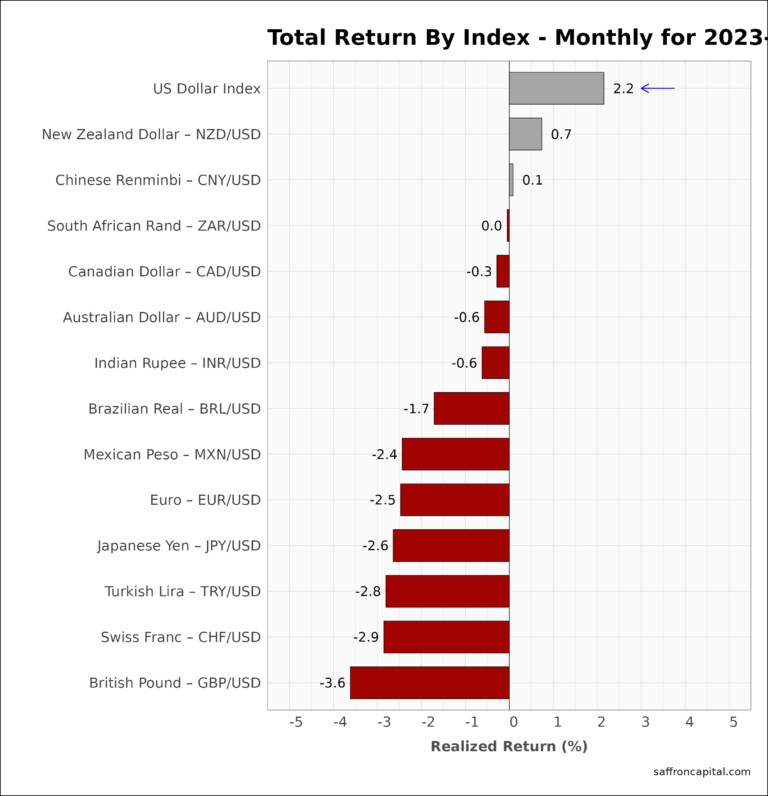
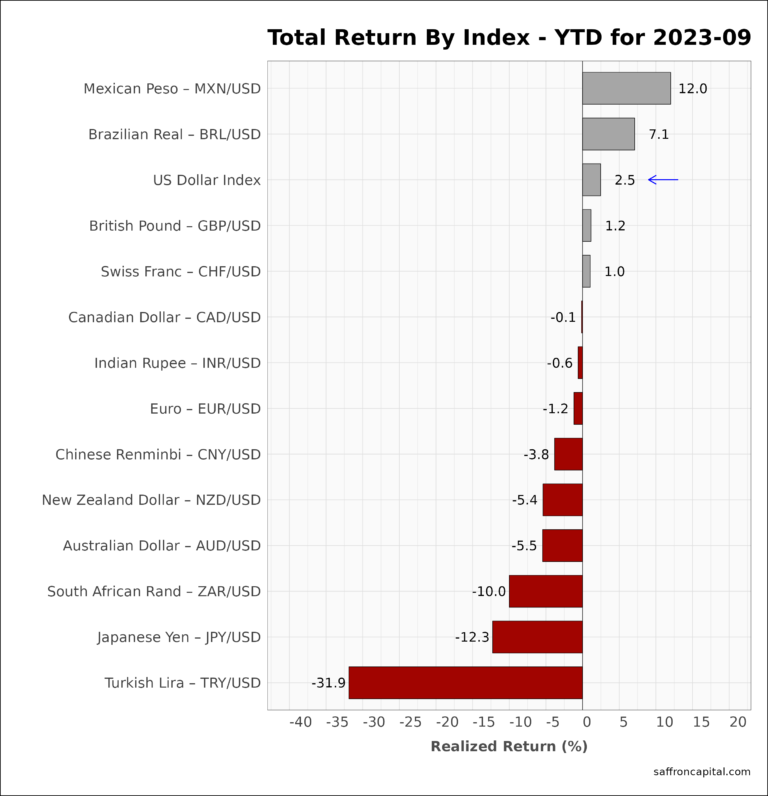
Finally, the US Dollar (+2.2%) benefited from strong yields in September, triggering declines across all major currencies. Since January, the dollar (2.5%) is also up, while the Euro (-1.2%) is modestly weaker. The Mexican Peso (+12.0%) has been the strongest currency, while the weakest has been the Turkish Lira (-31.9%).
Have questions or concerns about the performance of your portfolio? Whatever your needs are, we are here to listen and to help. Schedule time with us here.


