3Q Earnings Update – S&P 500
October 17, 2023
ETF Fund Flows: October 20, 2023
October 23, 2023Treasury Yields and the Probability of Recession
The Treasury yield curve depicts the interest rates on debt for different maturities. Analyzing changes in the yield curve can provide valuable insights into the market’s expectations for future economic conditions. This article explores the relationship between Treasury yields and the probability of recession.
Understanding the Yield Curve
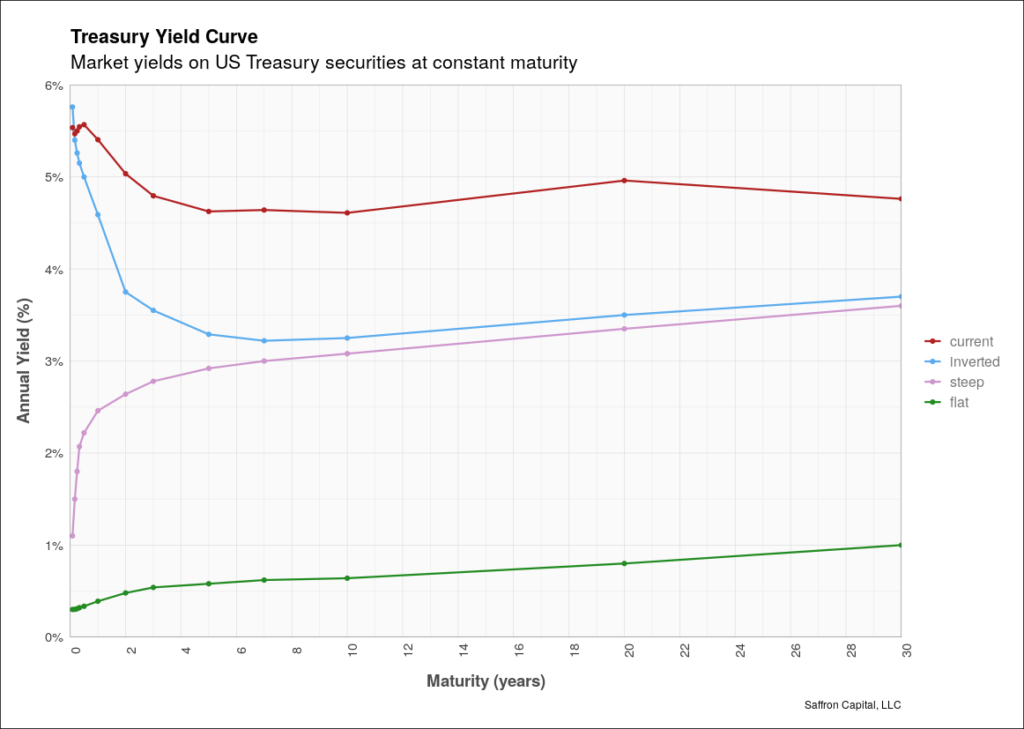
The shape of Treasuring yield curve is typically upward sloping, meaning that longer-term bonds have higher yields than shorter-term bonds. This is because investors demand a higher return for tying up their money for a longer period. The difference between the yields of short-term and long-term bonds is known as the yield curve spread. For example, if the yield on the 5-year Treasury Note is 4% and the yield on a 1-month Treasury Bill is 3%, then the yield curve spread is 1%.
Inverted Yields
An inverted yield curve occurs when short-term yields are higher than long-term yields, resulting in negative yield curve spreads. This is a rare occurrence and is often seen as a warning sign for the economy. Historically, inverted yields has preceded every recession in the United States.
Flat Yields
A flat yield curve occurs when there is little difference between short-term and long-term yields. This can happen when the economy is in a period of uncertainty, and investors are unsure
Click to enlarge
about the direction of future interest rates. The flat yield curve in the chart, for example, shows yields from the height of the COVID-19 pandemic.
Steep Yields
A steep yield curve occurs when there is a large difference between short-term and long-term yields. This is often seen as a positive sign for the economy, as it indicates that investors are confident in the economy’s future. Steep or upward sloping yields can also be a sign of inflation expectations or uncertainty regarding government bond payments. In these scenarios, investors demand higher yields on long-term bonds in exchange for increased risk or reduced purchasing power.
Historical Yields
Examples from Prior Recessions
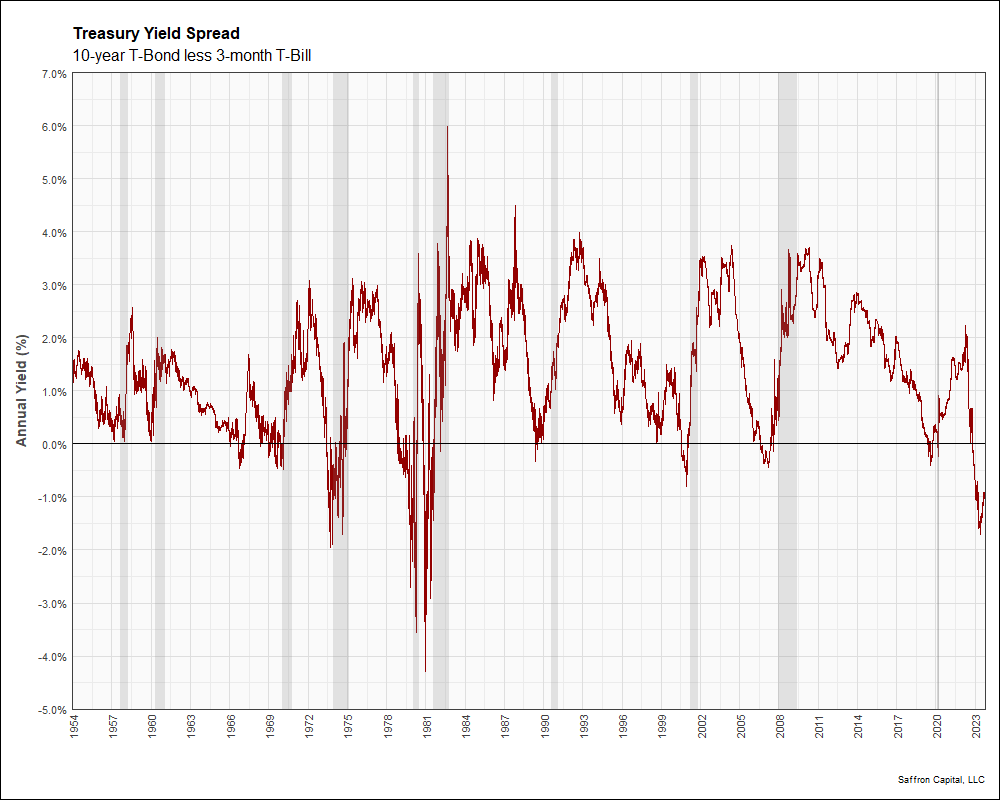
The next chart shows the history of a common yield spread, the 10-year T-Note yield minus the 3-month T-Bill yield. Inverted yields or negative yield spreads have preceded every recession in the United States since 1955. This includes the most recent recession in 2020. Recent yield spreads are also inverted, suggesting a recession is likely….but how likely?
Estimating the Probability of a Recession
Model Form
A probit model is a type of binary classification model where the dependent variable can take only two values, for example recession versus no recession. The purpose of the probit model is to estimate the probability that an observation will fall into one of two categories. Hence, the probit model is a binary classification model.
The probit model applied here estimates the probability of a recession given observed values of the 10-year/3-month yield spread. The functional form of the model is
P(Y = 1 | X) = Φ(XT Β + e),
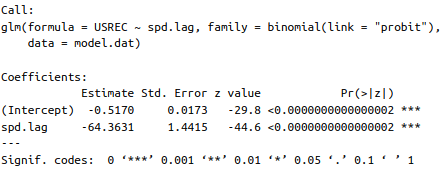
where Y is the binary response variable that takes the value 1 for a recession and 0 otherwise. The vector of regressors, X, contains lagged values of the yield curve spread, where the amount of lag used defines the forecast time horizon. The lag applied here is 195 business days or 9 months. P() is probability, Φ is the cumulative distribution function, and e is an error term. The coefficeint values to be estimated, B, are found using maximum likelihood.
Parameter estimates are shared below.
Graphical Results
Historical Recession Probabilities
The functional form of the probit model can be applied to our values for the lagged yield spread to produce a time series of recession probabilities. In the chart below, probabilities in red are historical recession probabilities. Probabilities in blue are forecast values for a potential recession 9 months in the futures. In March 2023, the probability of a recession peaked at 70%. Recession probabilities this high have not been seen since the 1980s.
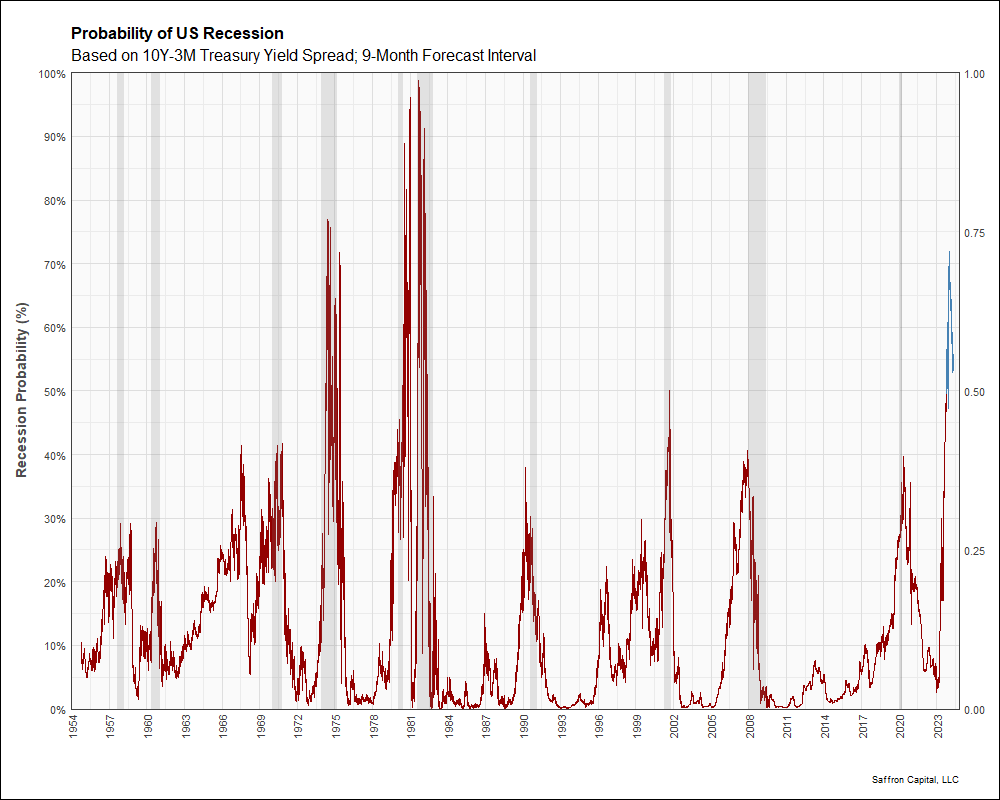
Its important to point out that the yield curve has begun to ‘uninvert.’ This was confirmed in when the 10-year/3-month spread moved from a low value low of -1.80% to a value of -0.94%. This 90 basis point move in September 2023 was significant. The reasons for the move are debatable. Staff at Federal Reserve bank have suggested several potential causes:
- The market is seeking a more normal shape given a persistently strong economy,
- Investor are increasingly concerned about US government spending and increased sales of long-dated bonds, and
- Sales of long-dated bonds have increased given mark-to-market losses.
Theses narratives in combination are more than sufficient to drive a yield curve realignment. In response, the probability of a recession within 9 months dropped to 52%, as shown above.
Recession Probability Updates
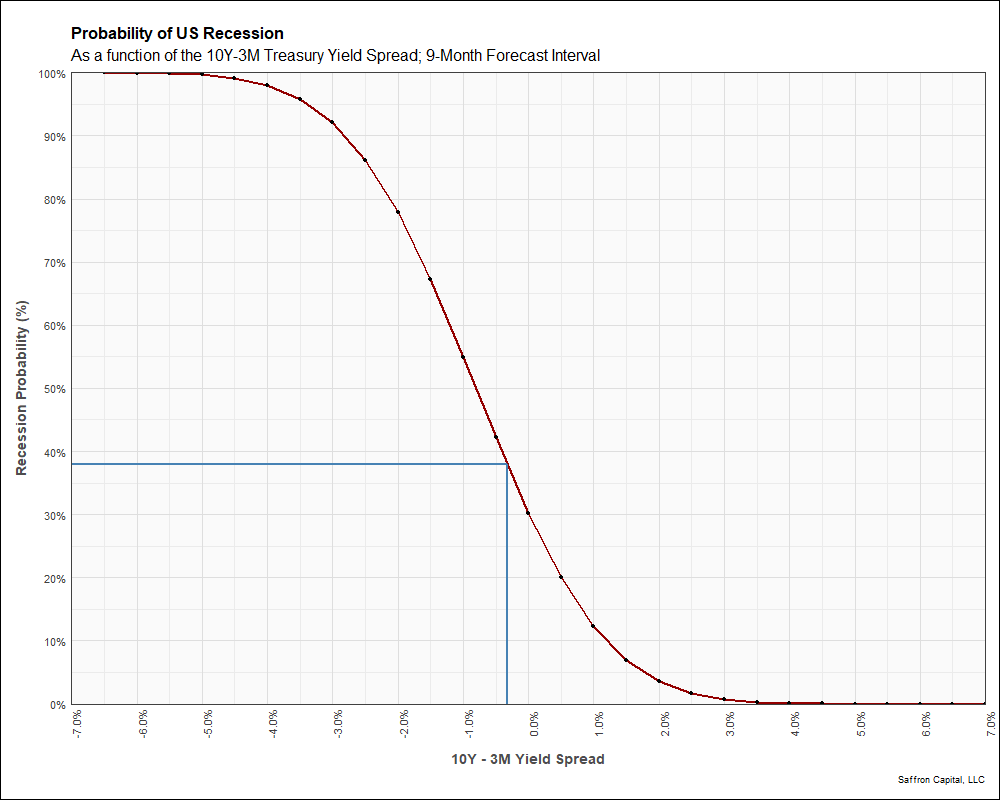
The model results can be applied to define a practical reference tool to quickly update recession probabilites as yield spreads change. The cumulative probability profile of a recession occuring in 9 months is shown below. Using the tool is straightforward. For example, the yield curve in October 2023 has continued to uninvert since data was collected for this article. As of today, the 10-year/3-month Treasury spread has increased significantly to -0.33%. Using the chart below, we see that the most recent yield spread has a 38% probability of a recession within 9 months, which is close to half the probability observed last month.
Conclusion
Yield curve spreads have value for predicting recessions. The inverted yield curve has been a reliable indicator of economic downturns. The current recession probabilities implied by the market have been high, but they are also decreasing rapidly as economic conditions and the yield spreads change.

