October 2023 Returns and Asset Performance
November 3, 2023
S&P 500 Earnings Forecasts – 4Q.2023
December 6, 2023Major Asset Classes
November 2023
Performance Comparison
Introduction
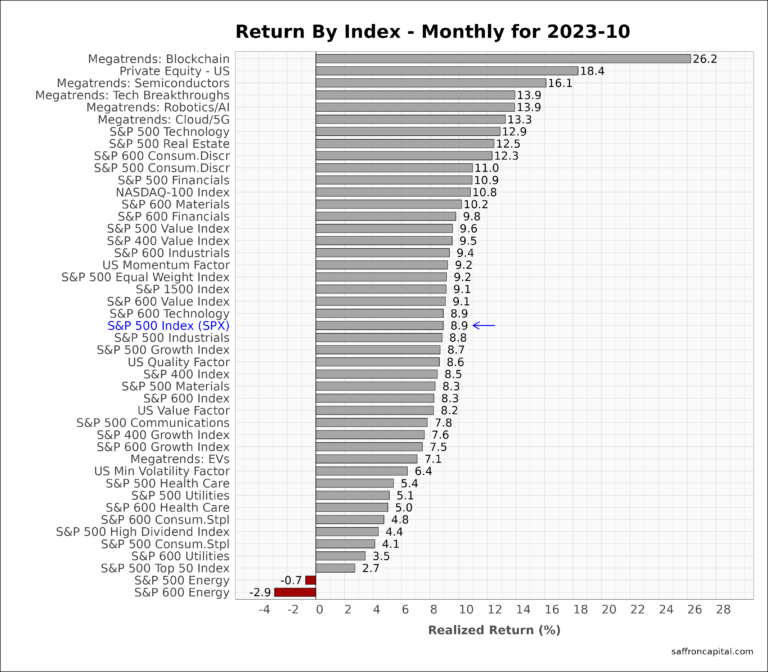
November 2023 market returns were broadly positive. Stocks and fixed income assets had their best performance month of the year. For example, the S&P 500 index (+8.9%) and the NASDAQ100 Index (+10.8%) benefited from an improved rate outlook, a strong GDP trend, and stellar performance by the top 7 tech companies. The Aggregate Bond Index (+4.6% ) was pulled higher by long duration bonds, notably 20-year Treasuries (+9.9%). The iBoxx Corporate Bond Index (+4.9%) was lead by 10-year Investment Grade bonds (+10.9%), which outperformed the major stock indices. Other top performs included US Multi-sector REITS (10.7%) and international infrastructure project bonds (+9.3%). Finally, the S&P Commodities Index (-2.6%) was the only asset group with negative returns.
The following analysis provides a visual record of November 2023 returns. Scope is across and within the major asset classes. The goal is to assist investors with portfolio performancebenchmarking.
US Equities
US equity returns were dominated by mega-trend equities, notably Blockchain shares (+26.2%), Semiconductors (+16.1%), Robotic and AI (13.9%), and 5G plus Cloud Computing (13.3%). Meanwhile, US private equity (18.4%) investing also had a a strong month.
The top S&P 500 sectors included Technology (12.9%), Real Estate (12.5%), and Consumer Discretionary (+11.0%) shares. The weakest sectors included Materials (+8.3%), Health Care (+5.0%) and Energy (-0.7%).
The top factor portfolios in November included Momentum (+9.2%), Quality (+8.6%), and Value (+8.6%).
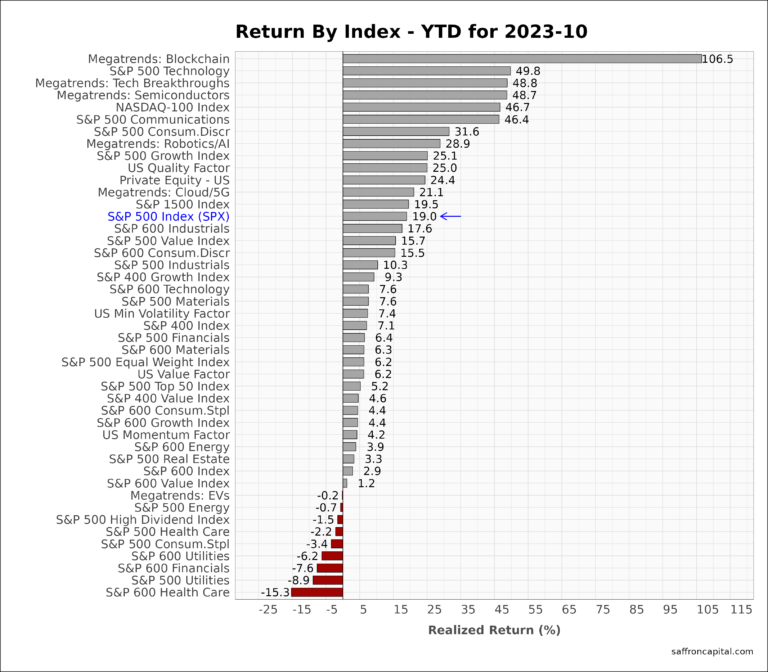
On a year-to-date (YTD) basis, S&P 500 Index (+9.2%) returns remain solid, but lag returns for the NASDAQ-100 index (+46.7%). The top 7 technology firms continue to dominate index performance. For example, the overall market, as defined by S&P 500 Equal Weight Index (+6.2%) has had modest returns. Even worse, the S&P 600 Small Cap Index (+2.9%) confirms that returns for the majority of companies still remains weak.
Developed Market Equities
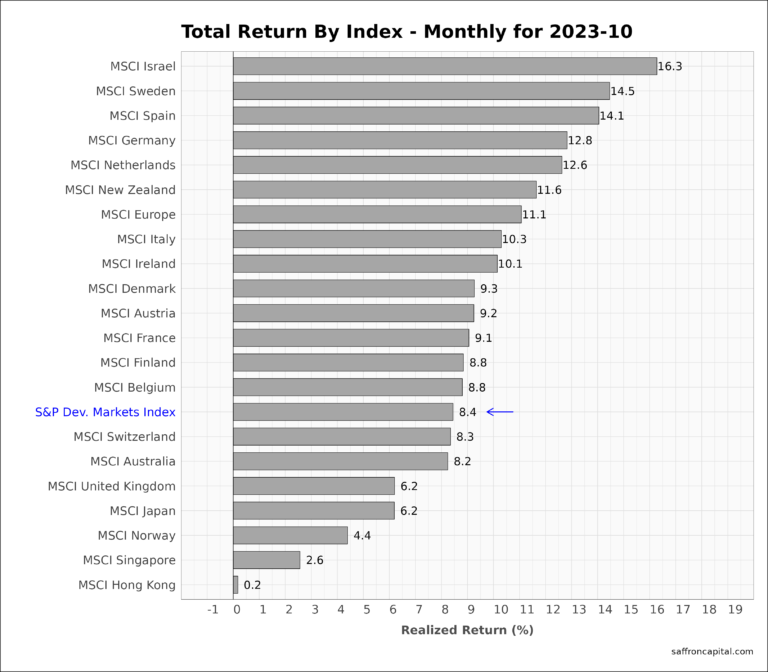
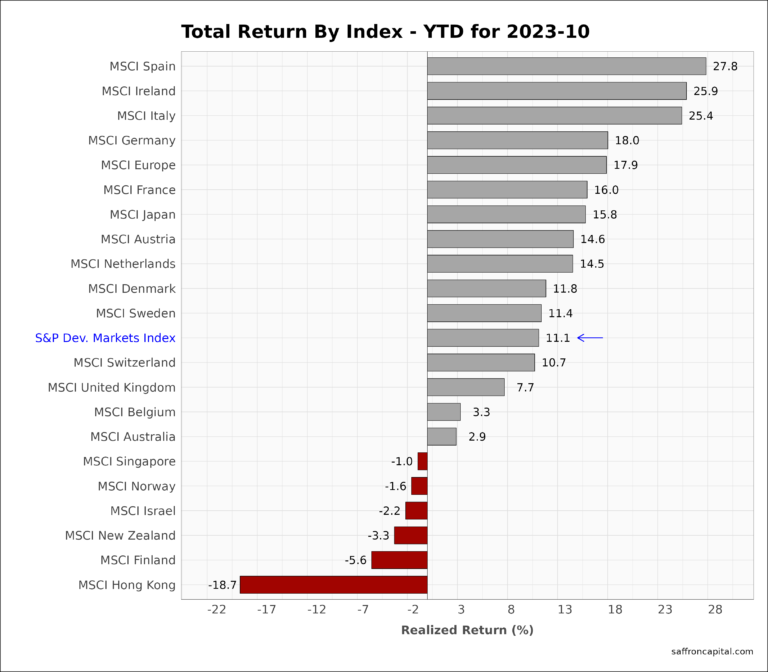
International developed markets (+8.9%) also benefited in November. Top markets included Israel (+16.3%), Sweden (+14.5%), and Spain (+14.1%). Results for the largest developed markets varied, as seen Germany (+12.8%), Italy (+10.3%), the UK (+6.2%) and Japan (+6.2%). Developed Markets (+11.1%) remain positive since the start of the year. The best performers have outperformed the S&P 500 index, notably Spain (+27.8%), Ireland (+25.9%), and Italy (+25.4%). Returns in Hong Kong (-18.7%) continue to lag the the peer group.
Click to enlarge
Emerging Market Equities
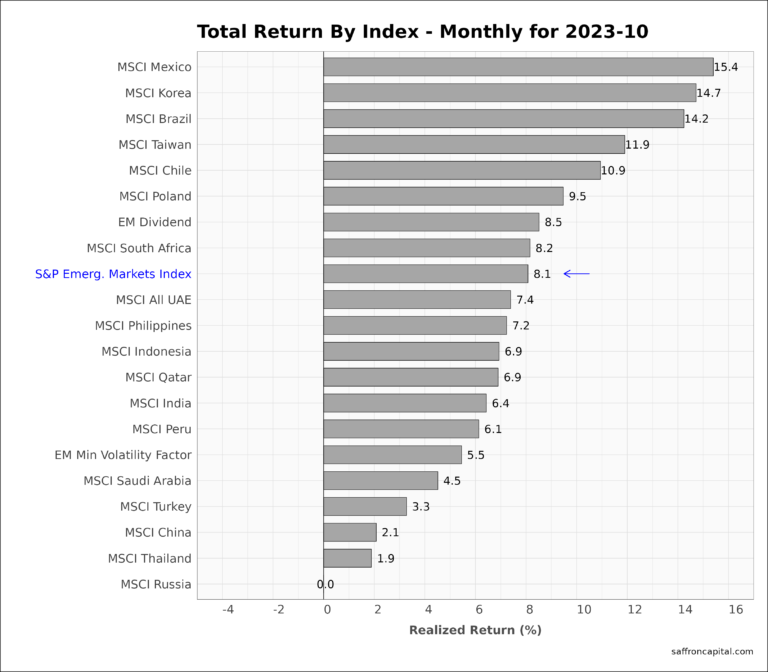
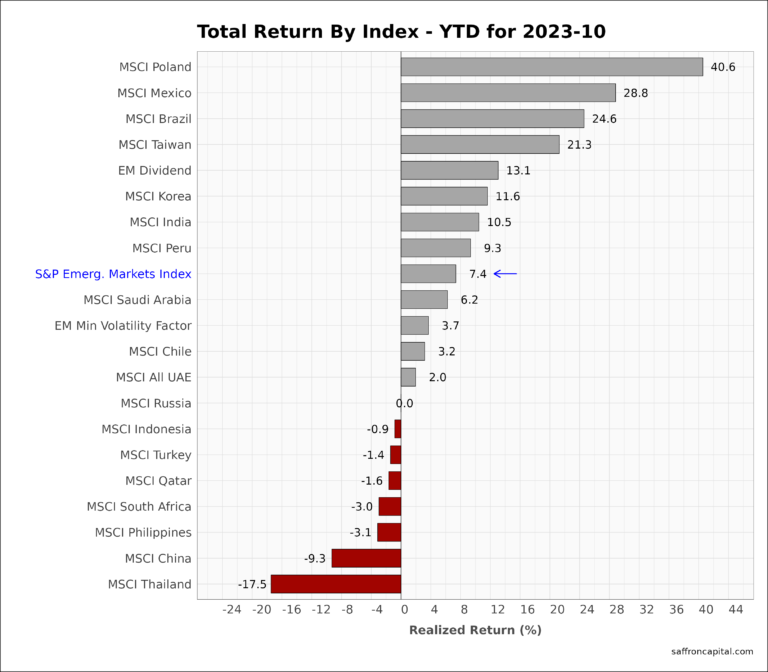
November 2023 returns for the S&P Emerging Markets Index (+8.1%) had a wide range of results, Mexico (+15.4%), Korea (+14.7) and Brazil (+14.2) lead the group. Both India (+6.4%) and China (+2.1%) lagged the benchmark. The YTD performance of the group (+7.4) has been relatively weak. However, the top performers have outstanding results, including Poland (+40.6%), Mexico (+28.8%), and Brazil (+24.6%). Asian markets have been weak as seen by Thailand (-17.5%), China (-9.3%) and the Philippines (-3.1%).
Government Bonds
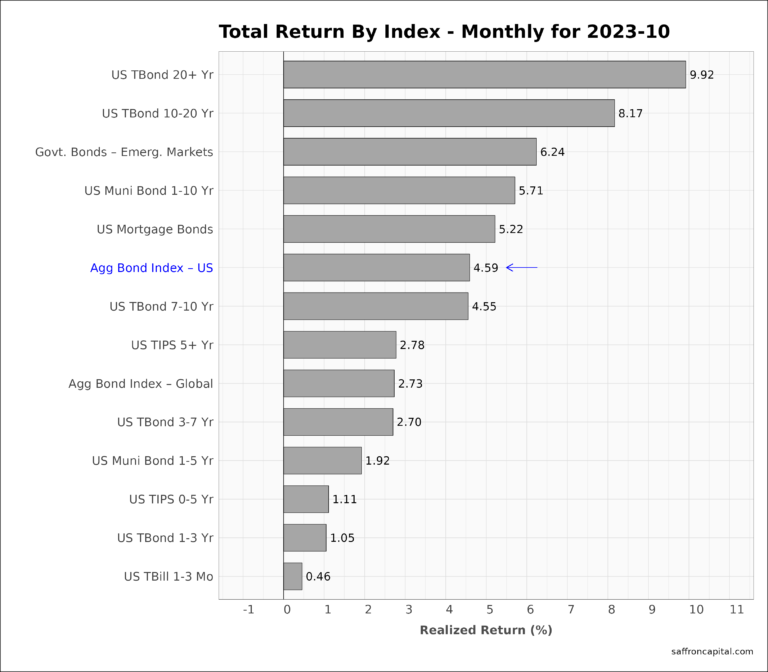
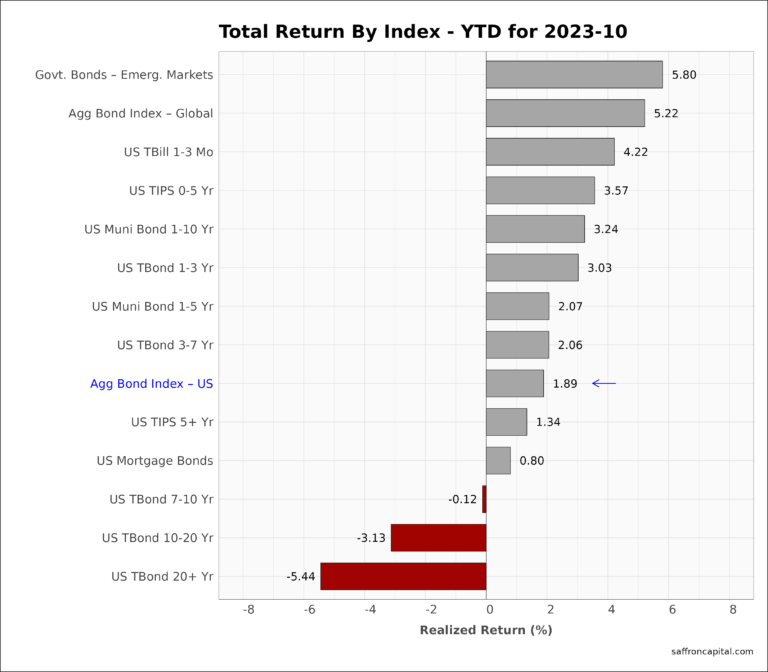
Returns for the Aggregate US Government Bonds Index (+4.59%) have been solid in light of prior losses.The long-end of the yield curve has the lead the group with he 20-Year bond (+9.9%) topping the chart. Emerging market sovereign bonds (+6.2%) have also been pulled higher. YTD returns for government bonds (+1.9) turned positive for the first time this year, lead by emerging market bonds (+5.8%).
Corporate & Infrastructure Bonds
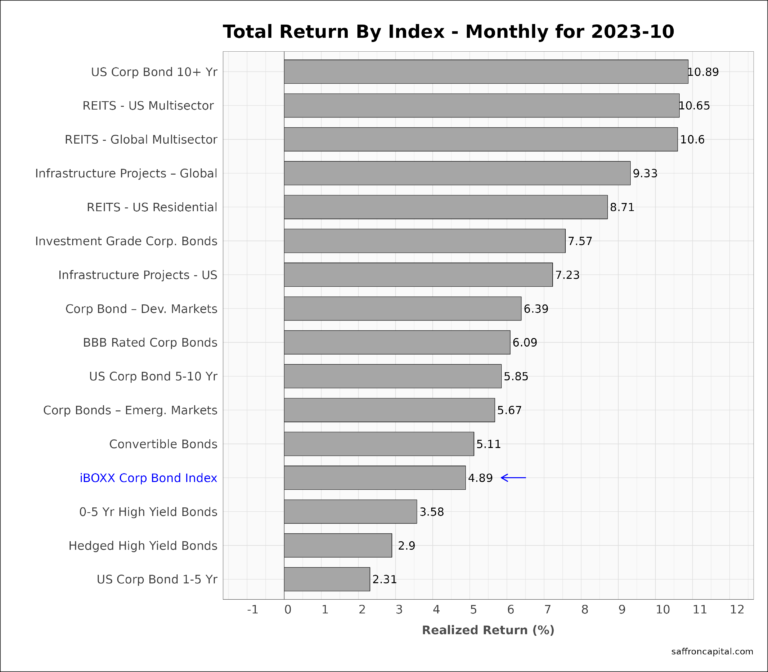
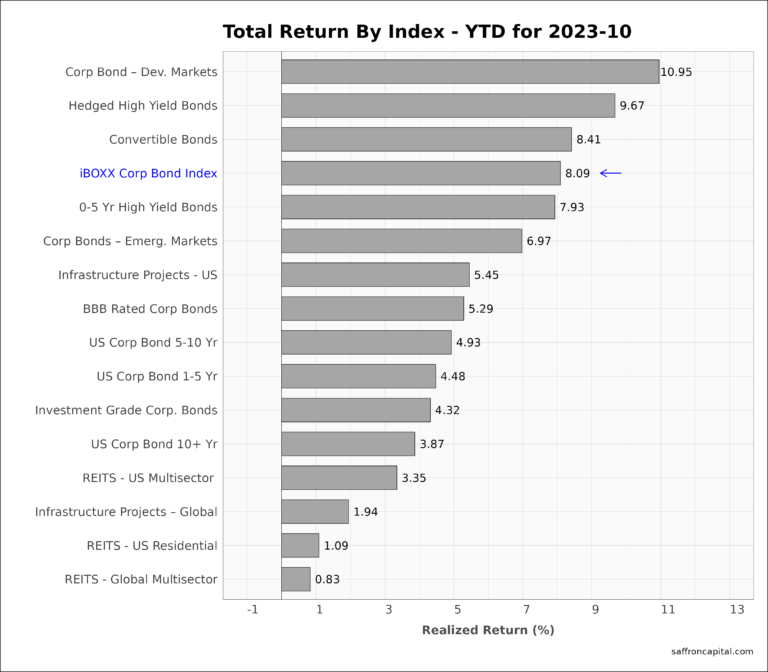
The iBoxx Corporate Bond Index (+4.89%) only modestly outperformed Treasuries in November. Top performance was seen in 10-Year Corporate Bonds (+10.9%), US Multi-sector REITS (10.7%) and International Multi-sector REITS (+10.6%). US Infrastructure project bonds (7.23%) lagged international infrastructure projects (+9.33%) in November. Year-to-date performance for the iBOXX ndex (+8.09%) has solidly beat the total return on Treasuries. Sector performance is led by Developed market Corporate bonds (+10.95%), Hedged High Yield bonds (+9.67%), and Convertible bonds (+8.41%).
Commodities
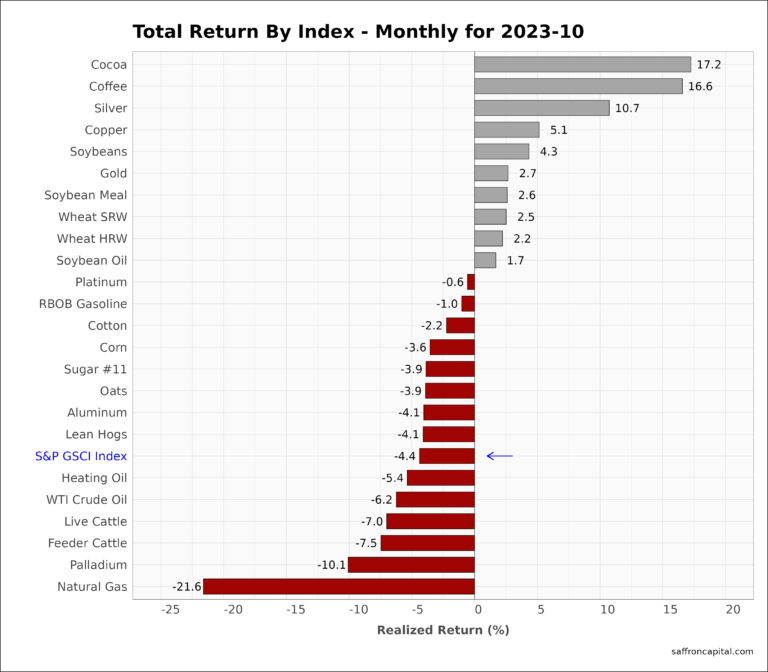
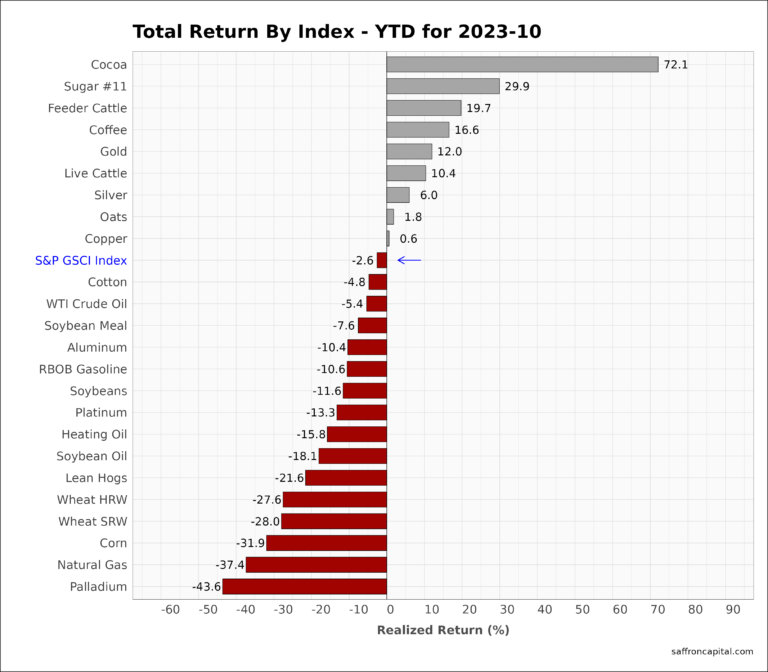
November 2023 returns for the S&P GSCI index (-4.4%) confirmed the trend for falling raw material prices, but with highly variable results. For example, Cocoa (+17.2%), Coffee (+16.6%), and Silver (+10.7%) topped the charts, while, Natural Gas (-21.6%), Palladium (-10.1%), and Feeder Cattle (-7.5%) were notably weak. Year-to-date results for the commodity index (-2.6%) has also been weak.
Currencies
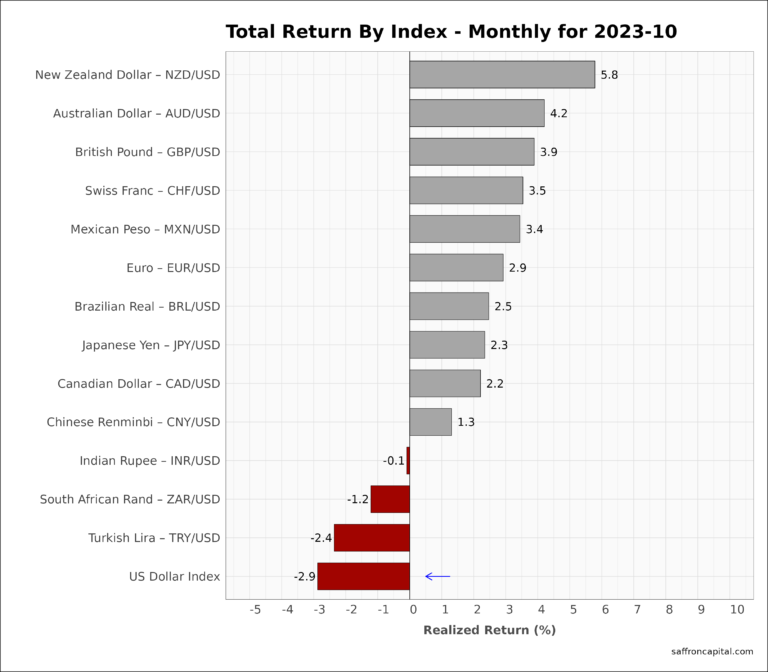
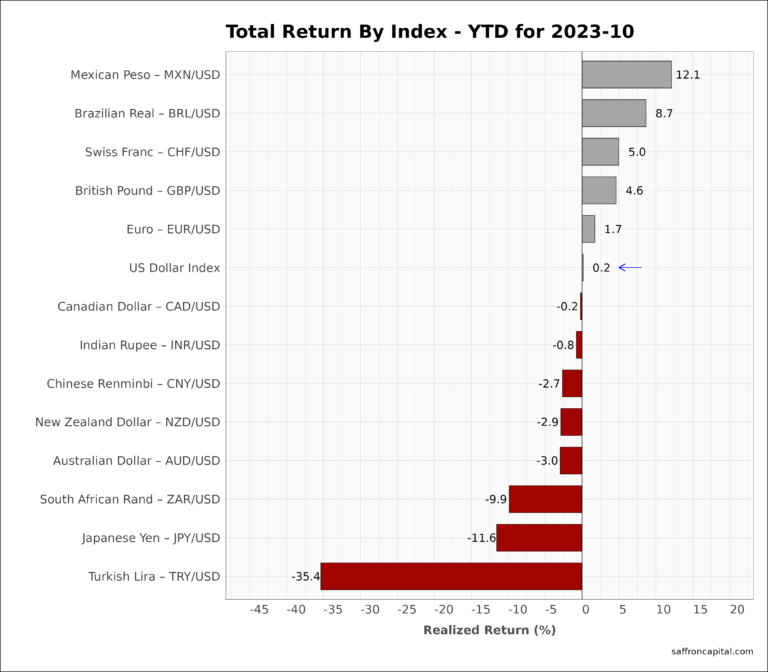
Finally, the US Dollar (-2.9%) reversed the gains of recent months. On a year-to-date basis, the Dollar is unchanged.
Have questions or concerns about the performance of your portfolio? Whatever your needs are, we are here to listen and to help. Schedule time with us here.


