Market Update: Mid-Year Outlook 3Q.2024
August 2, 2024
September 2024 Returns and Asset Performance
October 2, 2024Major Asset Classes
August 2024
Performance Comparison
Introduction
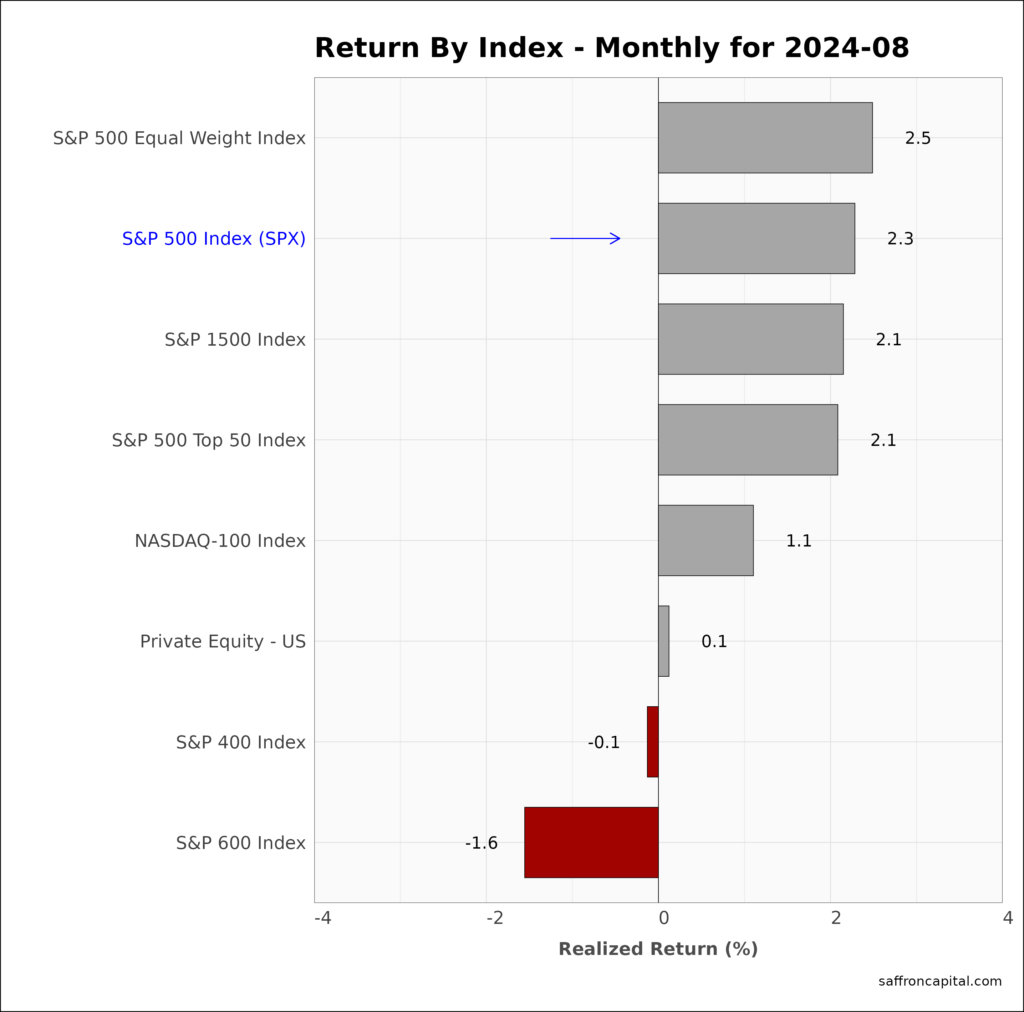
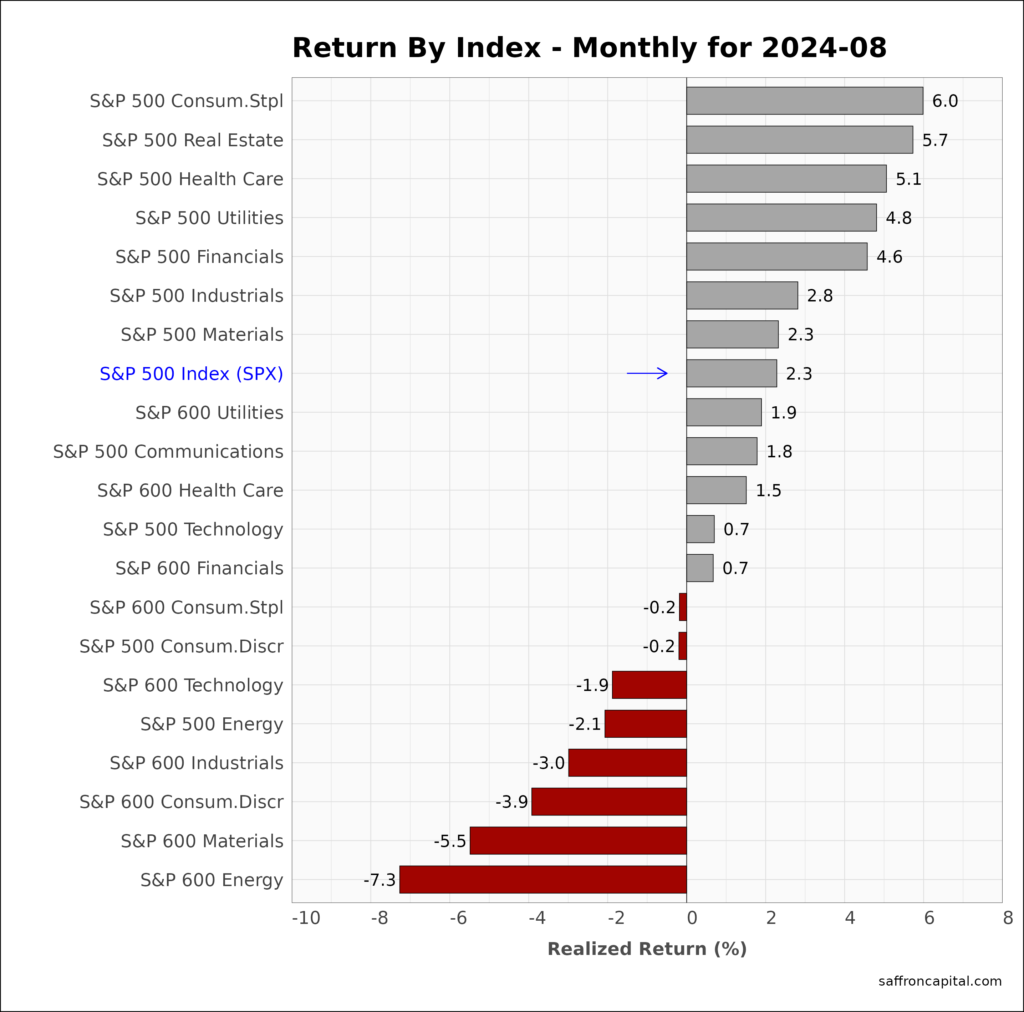
August returns for the benchmark S&P 500 index (+2.3%) benefited from optimism regarding a ‘soft landing’ and encouraging inflation data. More astounding, US large-cap stocks recovered from a sharp drawdown at the start of the month, with a dramatic shift from risk-off back to risk-on. However, the NASDAQ-100 index (+1.1%) was not as fortunate as many growth and technology stocks ended the month with losses. As a result, the equal-weight S&P 500 index (+2.5%) was the preferred index exposure to own. Optimism is well placed. US investors continue to benefit from rising productivity, income, housing prices, and year-to-date stock market performance. However, high valuations and increased volatility also confirm that capital preservation strategies are essential as the business cycle expansion begins to slow. As a result defensive sectors like Consumer Staples (+6.0%) and Real Estate (+5.7%) led among the large-cap sectors. Also, low volatility (+4.9%) and high dividend (+3.1%) strategies saw increased investor fund flows in August.
The following brief breaks down returns for August by asset group, sector and leading industries. The aim of the visual summary is intended to help investors to identify new opportunities and to to benchmark their own portfolio returns.
Core US Indices
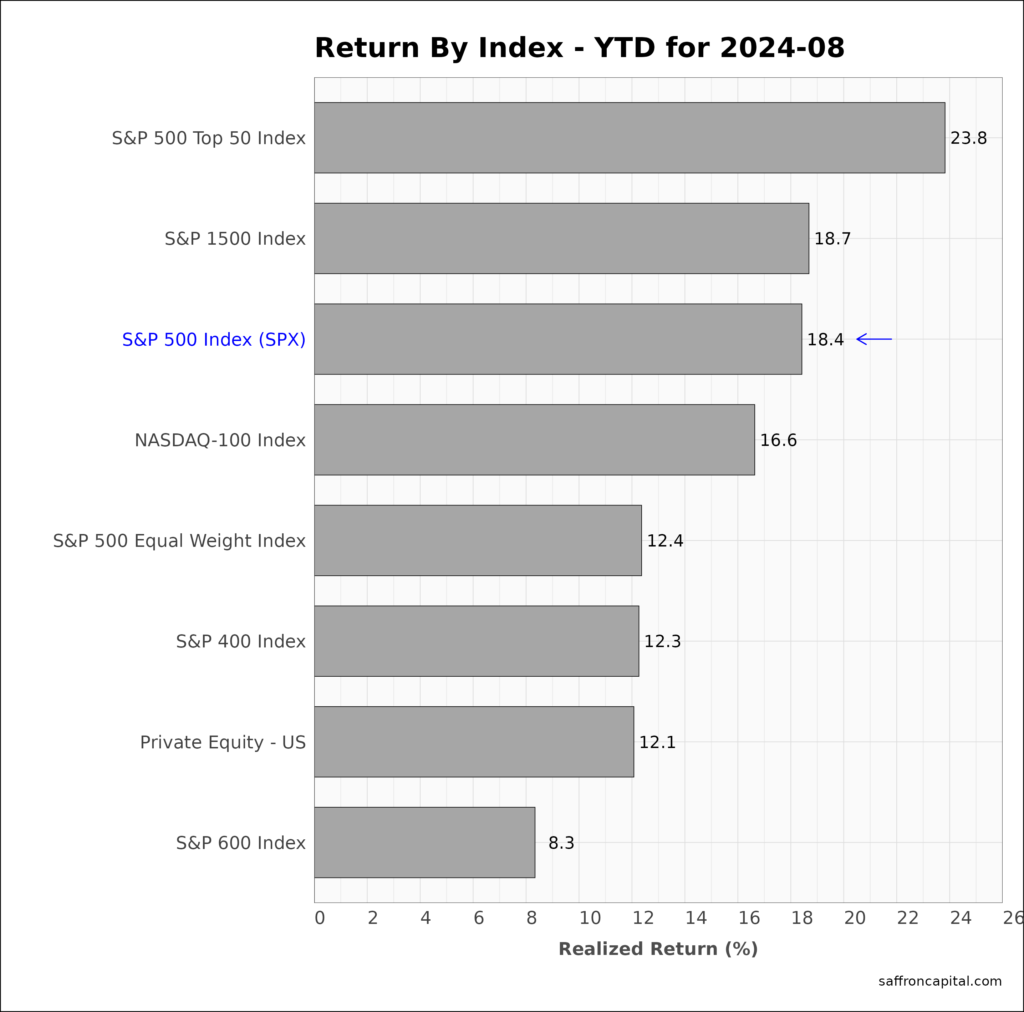
The equal-weight S&P 500 index (+2.5%) was the top performer across the headline indices, outpacing the August returns for the S&P 500 index (2.3%), the S&P MidCap 400 index (-0.1%) and the S&P SmallCap 600 index (-1.6%). Year-to-date (YTD), the S&P 500 index (+18.4%) has solid gains, but continues to lag the returns of the top 50 mega-cap shares (23.8%). In comparison, this S&P SmallCapp 600 index (+8.3) is yet to achieve half the returns of the large cap index, but that could change as market breadth expands and a soft-landing looks more likely.
Click to enlarge
US Sector Indices
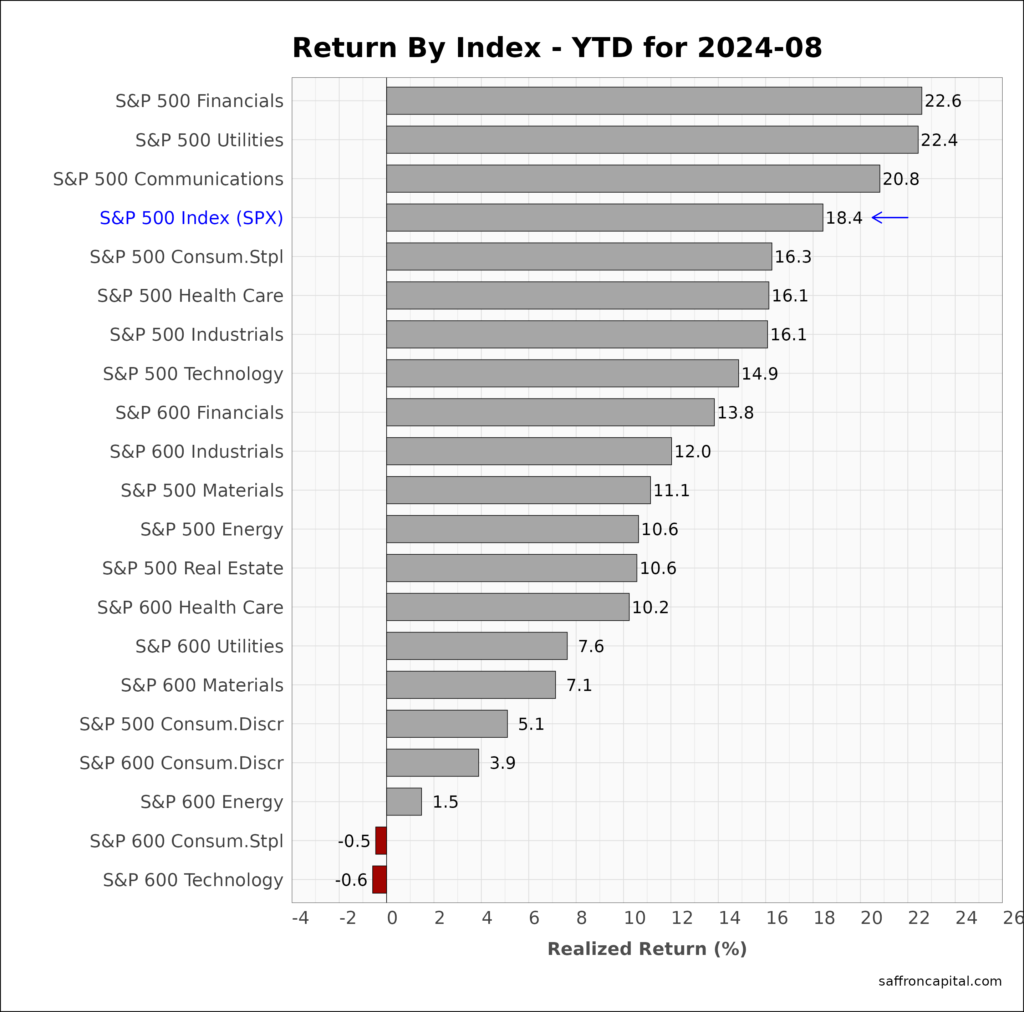
August returns for the top sectors were led by defensive and rate-sensitive sectors, notably Consumer Staples (+6.0%), Real Estate (+5.7%), Health Care (5.1%), and Utilities (4.8%). August return laggards include Materials (-5.5%) and Energy (-7.3%). The high number of sectors beating the S&P 500 index is clear evidence market breadth is expanding. Since January, Financials (+22.6%), Utilities (+22.4%) and Communication Services (+20.8%) topped the sector rankings.
US Factor Indices
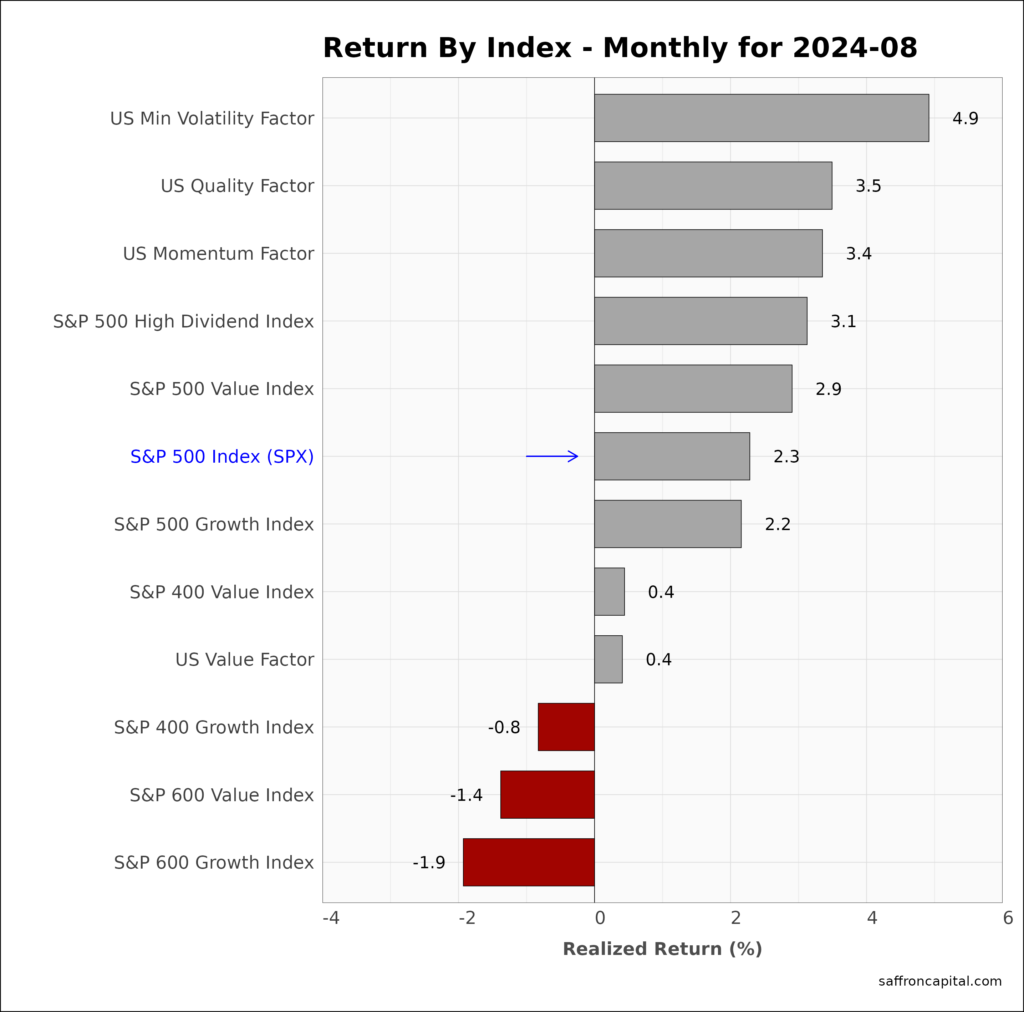
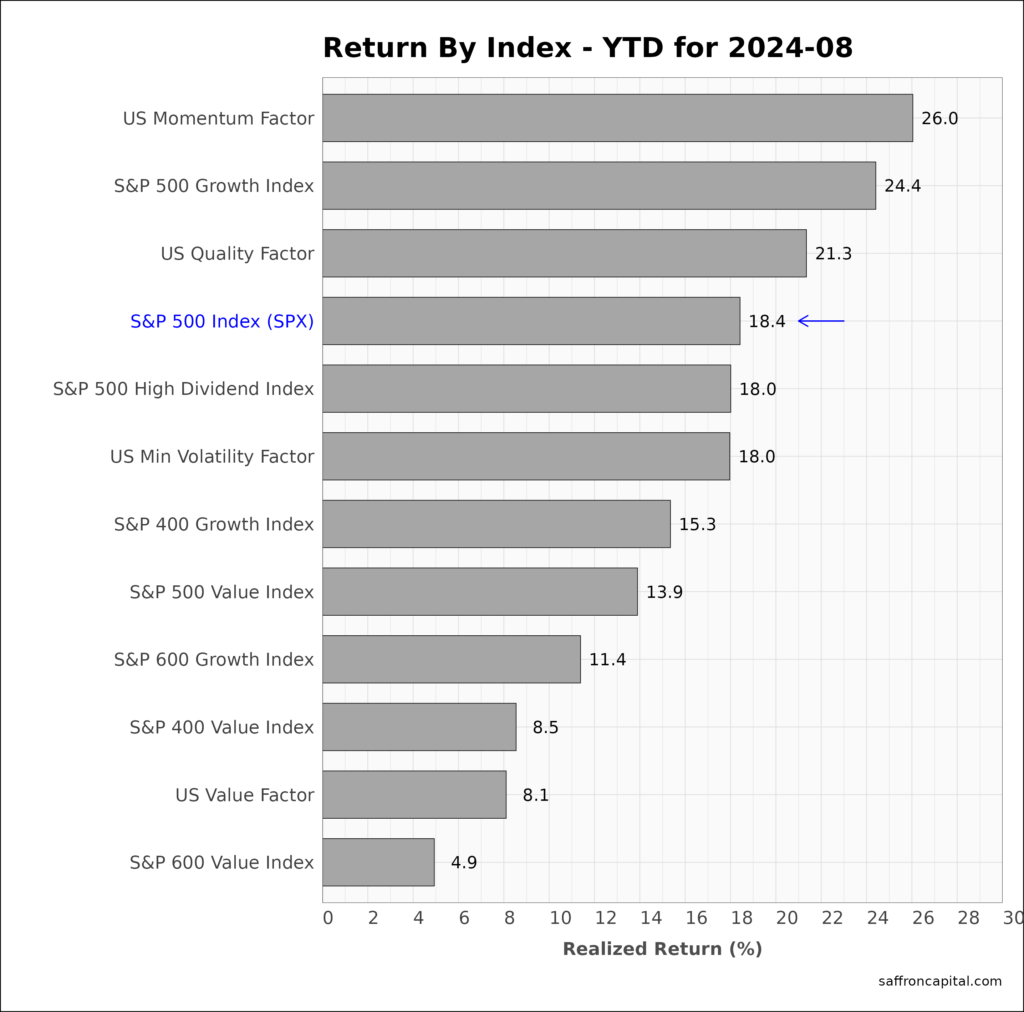
Factor portfolios are constructed to emphasize the core drivers behind returns, such as company size, value, profitability, growth, and momentum. Multi-factor portfolios selector shares that aim to capture returns form two or more factors. During August, US factor returns were lead by Minimum Volatility shares (+4.9%), the Quality factor (+3.5%) and Momentum (3.4%). The weakest factors included MidCap Growth (-0.8%), SmallCap Value (-1.4%) and Small Cap Growth (-1.9%). Since the start of the year, the US Momentum Factor (+26.0%) continues to lead all factor indices. Other top performers include the S&P500 Growth index (+24.4%), and the U.S. Quality factor (+21.3%).
Click to enlarge
US Megatrend Equities
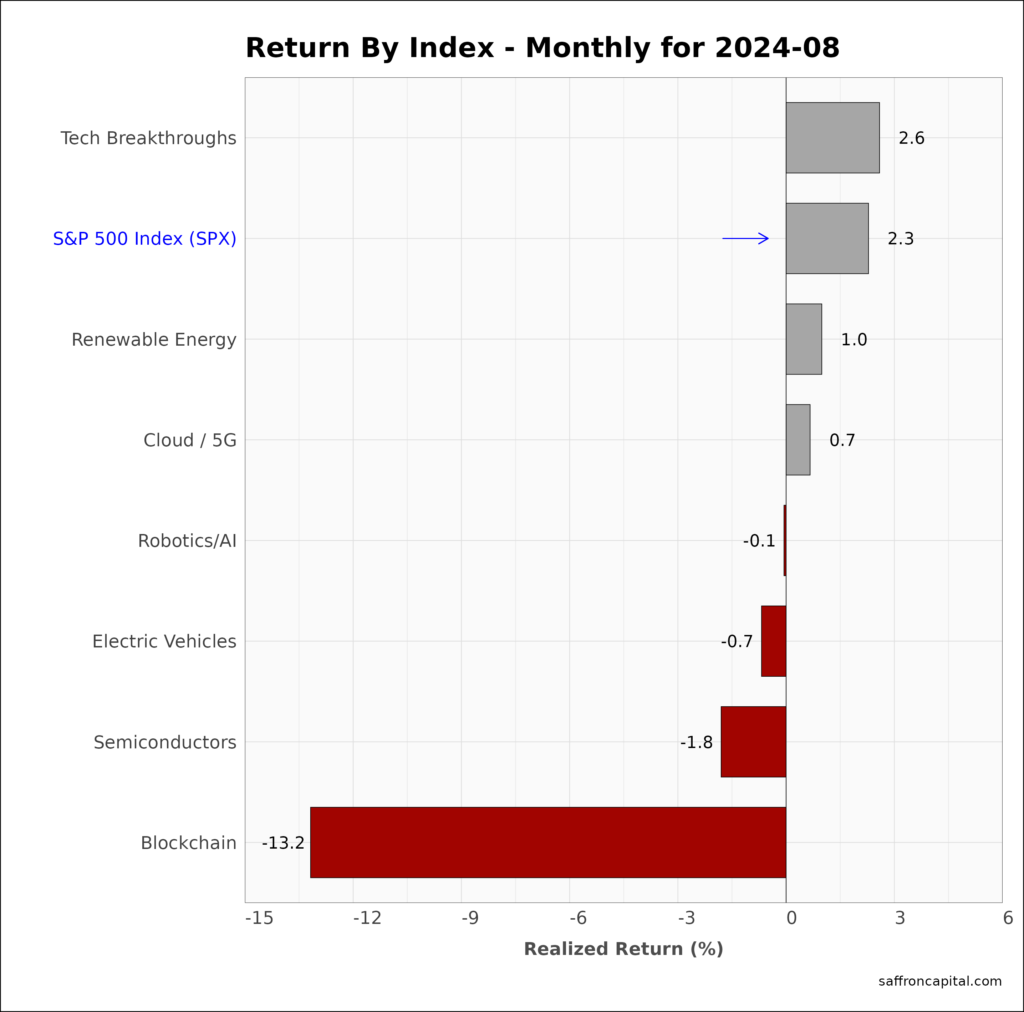
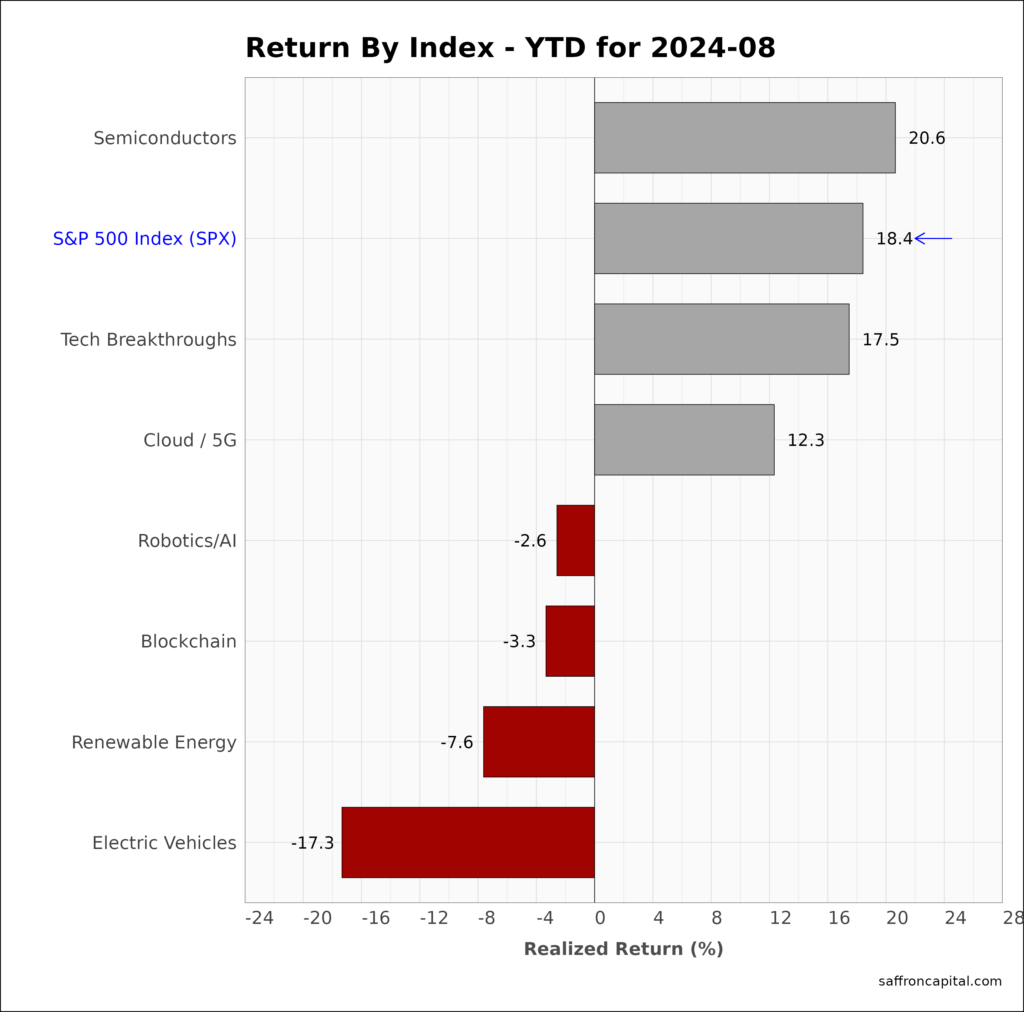
US megatrend equities are thematic growth portfolios. The aim is to select shares that capture the primary secular trends of the market. August returns were lead by Tech Breakthrough (+2.6%), rate-sensitive Renewable Energy (+2.3%), and Cloud/5G (+1.0%%). Bitcoin-related shares (-13.2%) had atrocious returns in August as the shift to a risk-off market risk regime triggered heavy bitcoin selling early in the month and prices are yet to recover like stocks did. Since January, Semiconductors (+20.6%) have been the top performer of the group and the weakest performers have been Renewable Energy (-7.6%) and Electric Vehicles (-17.3%).
Click to enlarge
Developed Market Equities
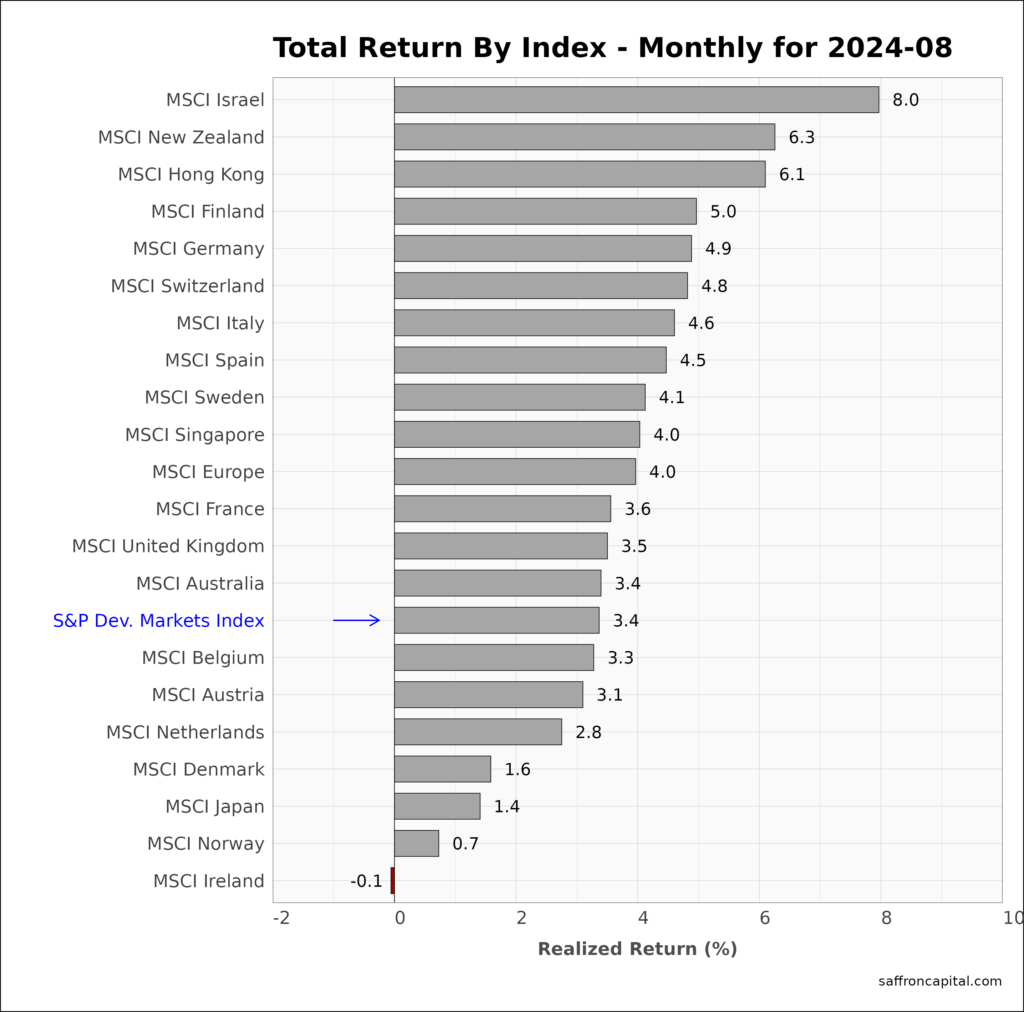
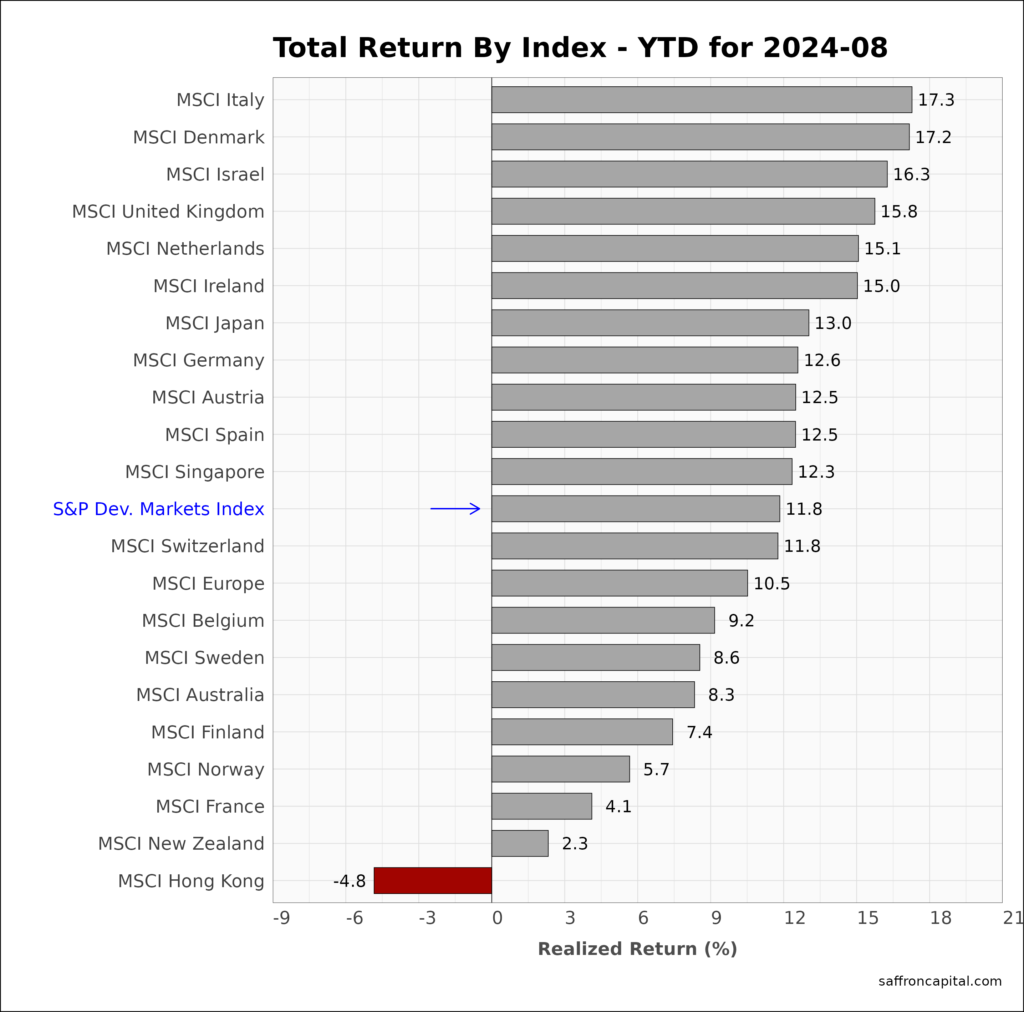
International developed markets (-3.4%) outpaced leading US indices in August. Israel (+8.0%), New Zealand (+6.3%) and Hong Kong (+6.1) were the best overseas markets. European Shares (+4.0%) also outperformed the US S&P 500 index, while Japan (+1.4%) is found at the bottom the of the list. The best performing developed markets in 2024 are the Italy (+17.3%), Denmark (+17.2%) and Israel (+16.3%). The developed markets in total (+11.8%) have solid gains, but lag the US since January.
Click to enlarge
Emerging Market Equities
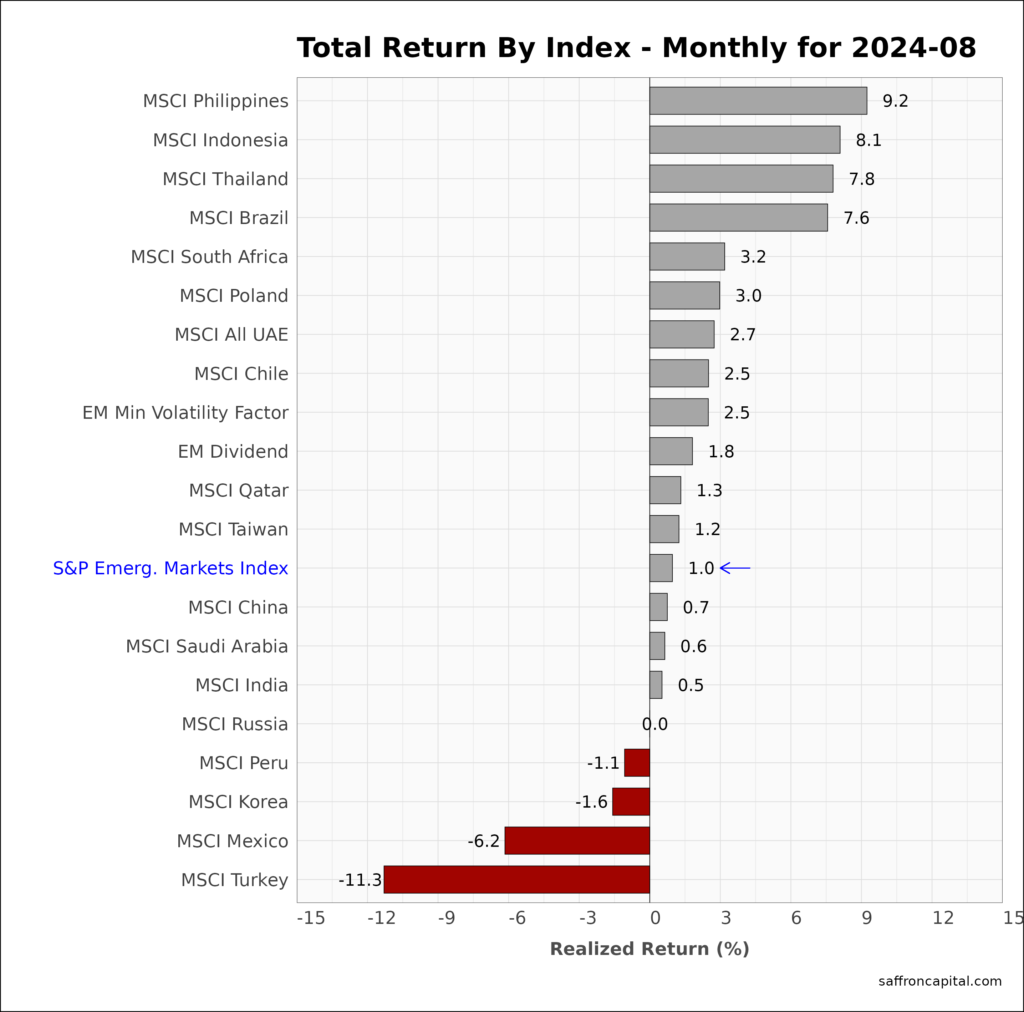
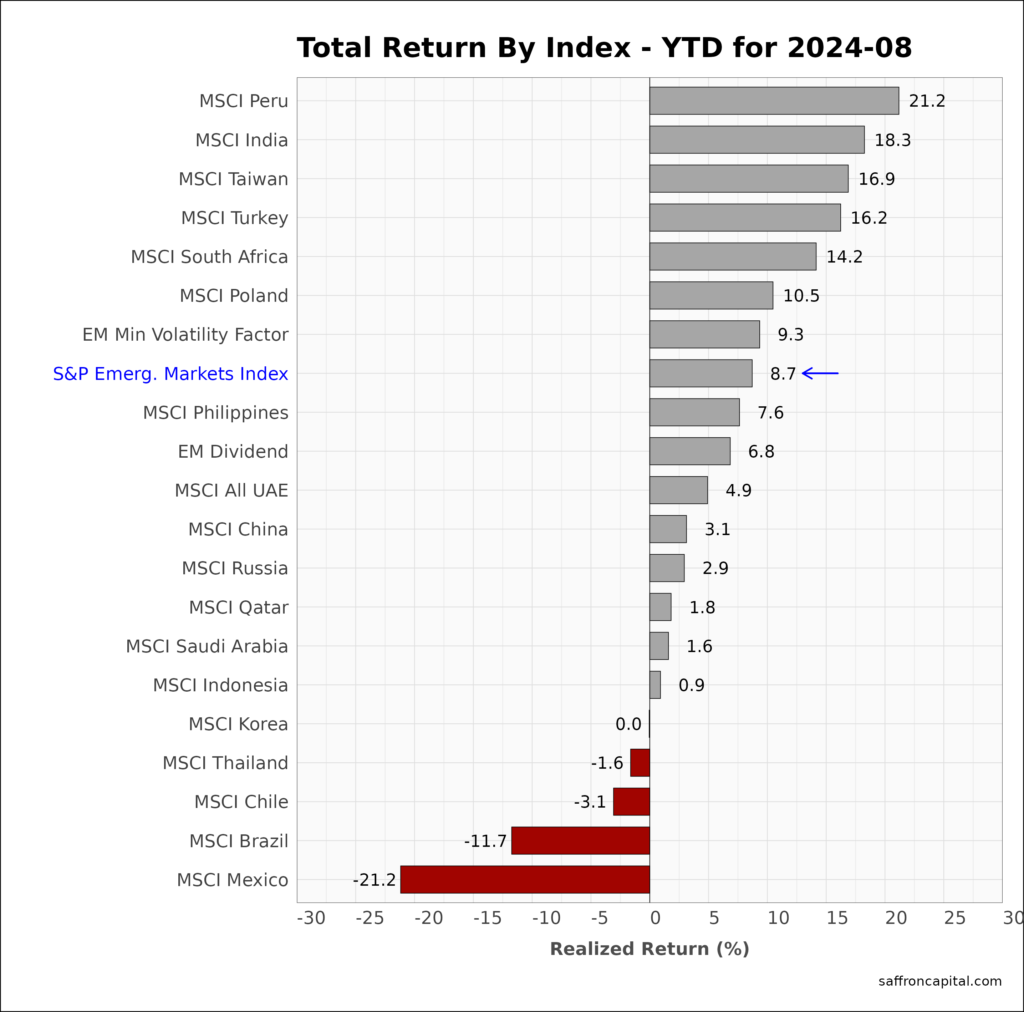
June returns for the S&P Emerging Markets Index (+1.0%) trailed the Developed market index again. Top performers were the Philippines (+9.2%), Indonesia (+8.1%), Thailand (+7.8%), and Barzil (+7.6%). Both China (+0.7%) and India (+0.6%) failed to beat the group benchmark. The weajest markets were Korea (-1.6%), Mexico (-6.2%), and Turkey (-11.5%). Year-to-date, Peru (+21.2%), India(+18.3%), and Taiwan (+16.9%) top the chart, while the economies of South America have the weakest returns.
Click to enlarge
Government Bonds
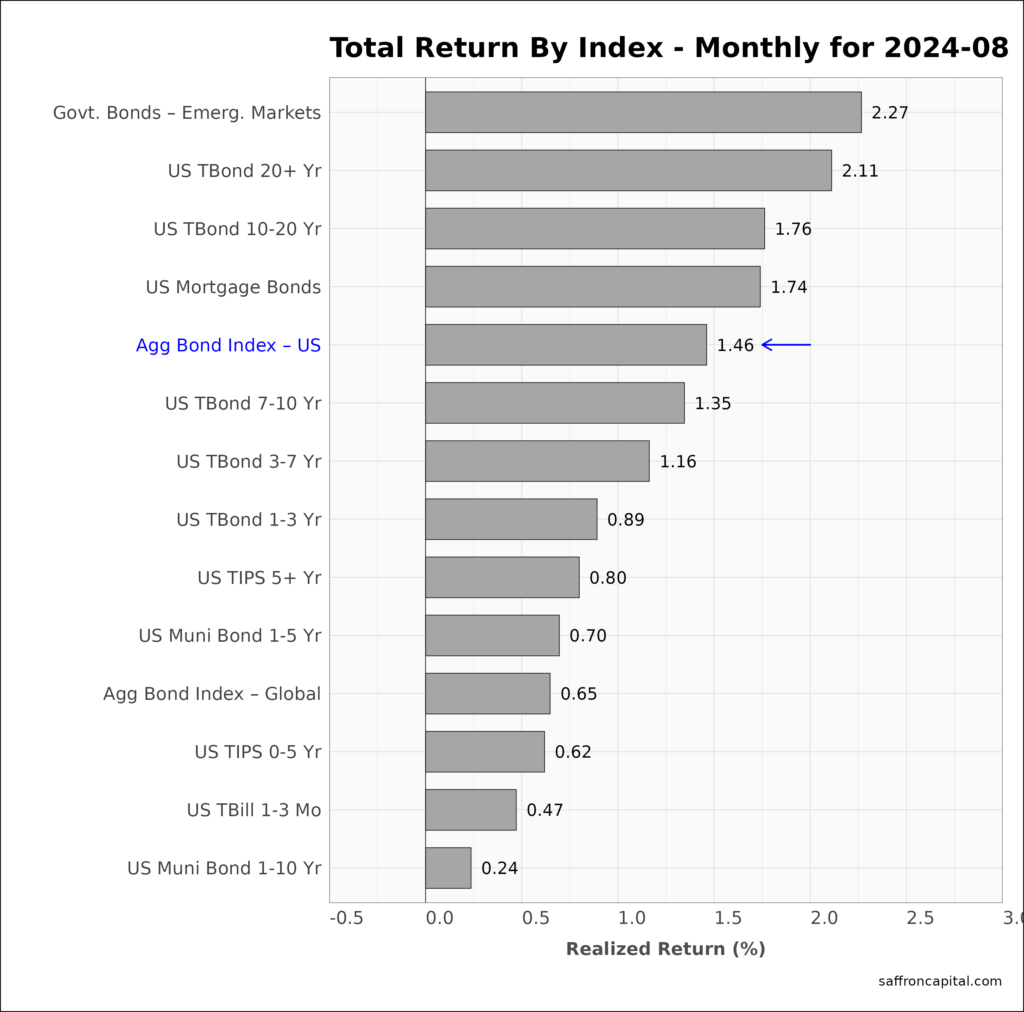
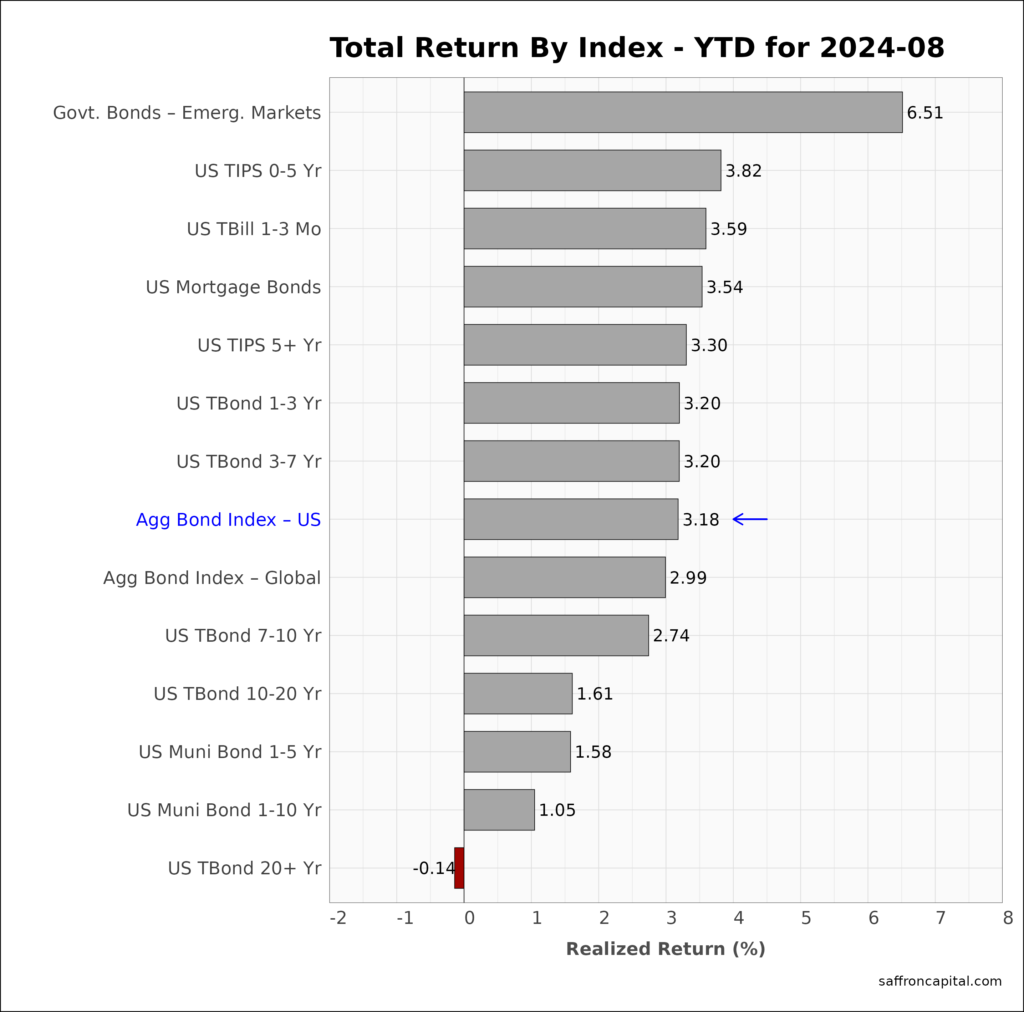
The US fixed income markets hold solid August returns as seen by the Aggregate Bond Index (-1.46%). Emerging Market sovereign bonds (+2.27%) and the US 20-year bond (+2.11%) benefited the most from a falling dollar and falling yields, Since January, the return of Emerging Market government bonds (+6.51%) has outperformed all others by a wide margin. In comparison, the US aggregate Bond index (+3.18%) is less than half the return seen in emerging markets.
Currently, the yield on the US 10Y Treasury Note is 3.8%. In comparison, The New York Federal Reserve Bank estimates that the neutral rate, or the interest rate that would prevail when the economy is at full employment and inflation is stable, is also 3.8% in nominal terms. This suggests that long-duration yields are not likely to fall significantly absent a recession. GDP growth came in this week at 3.0%, and that suggests there may be a risk that long duration yields will rise in the short-term, regardless of the expected rate cut on the short-term Federal Funds rate. If so, then buyers of fixed maturity bonds and bond ladders are likely to see a good opportunity near term to lock-in higher long-term yields.
Click to enlarge
Corporate & Infrastructure Bonds
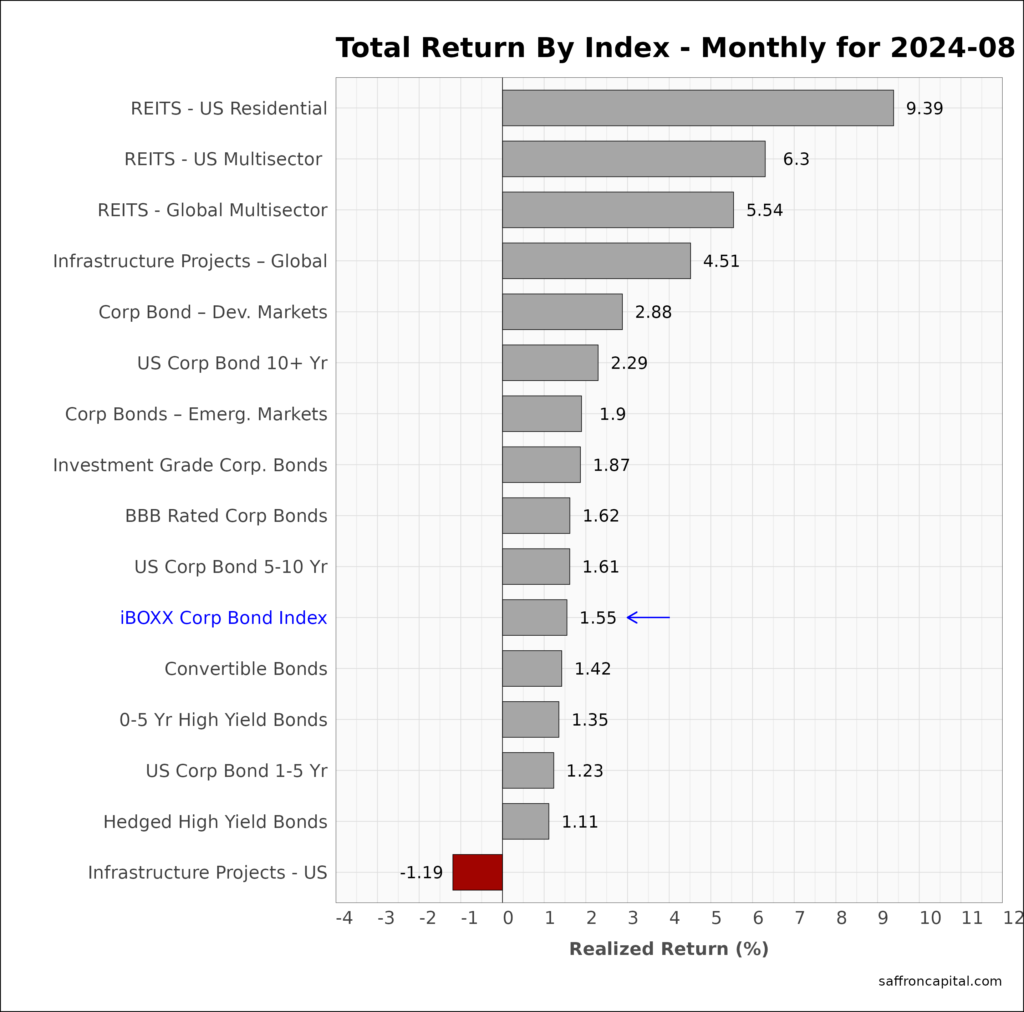
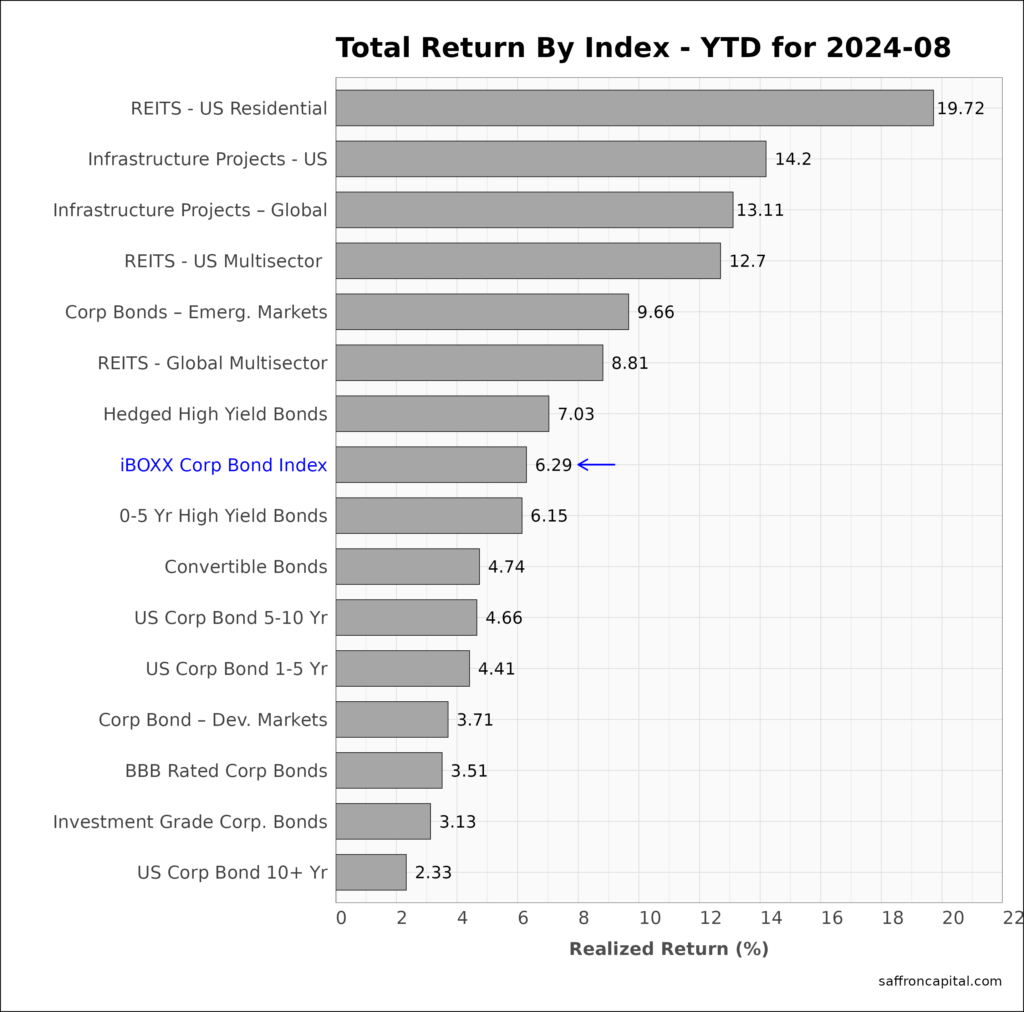
The iBoxx Corporate Bond Index (+1.55%) beat the August returns of the government Aggregate Bond index (+1.46%) only slightly. However, corporate bonds are returning over twice the return of government notes and bonds since January. The key driver has been industries critically sensitive to interest rates, notably real estate and infrastructure project bonds. Returns on REITs since January (19.72%) are beating large cap equities and all other corportae income opportunities. In comparison, August returns for US infrastructure bonds (-1.19%) were negative, but the year-date returns (+14.2%) confirm their appeal.
Click to enlarge
Commodities
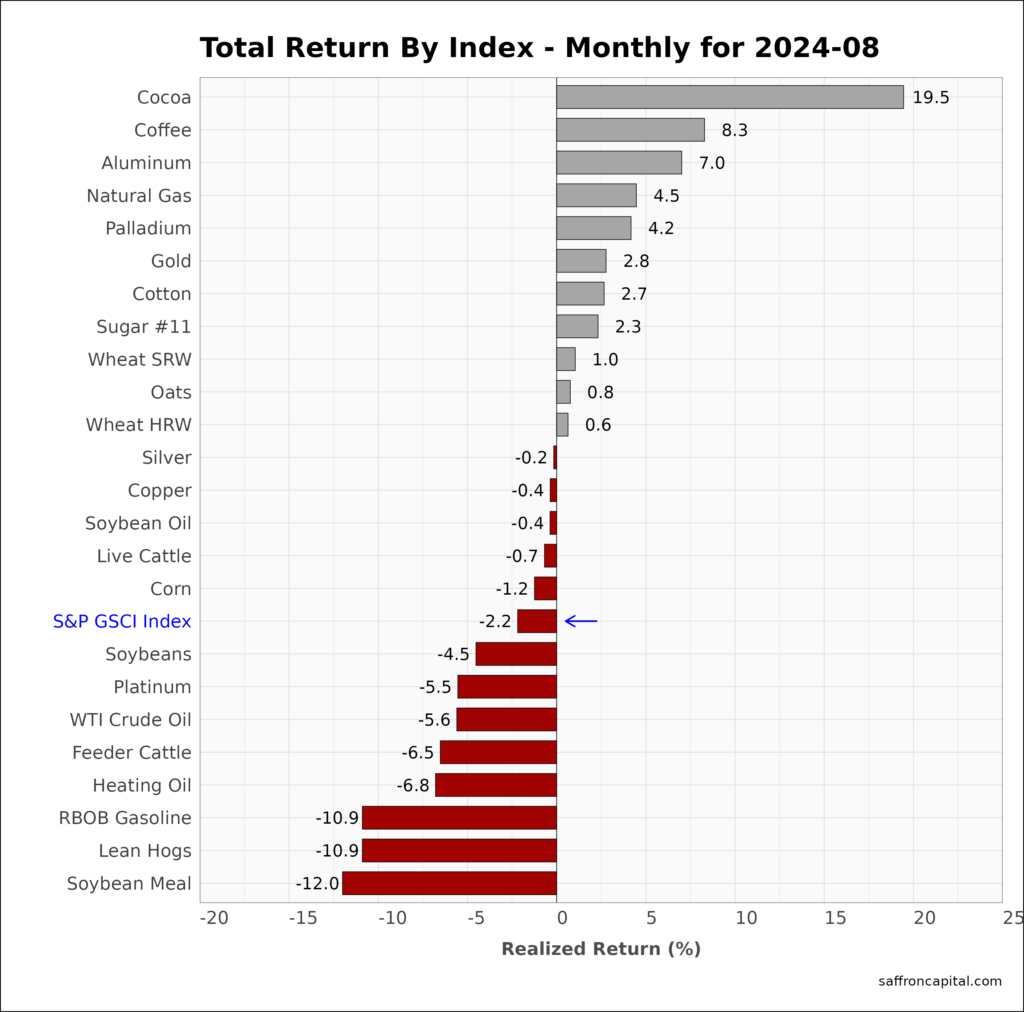
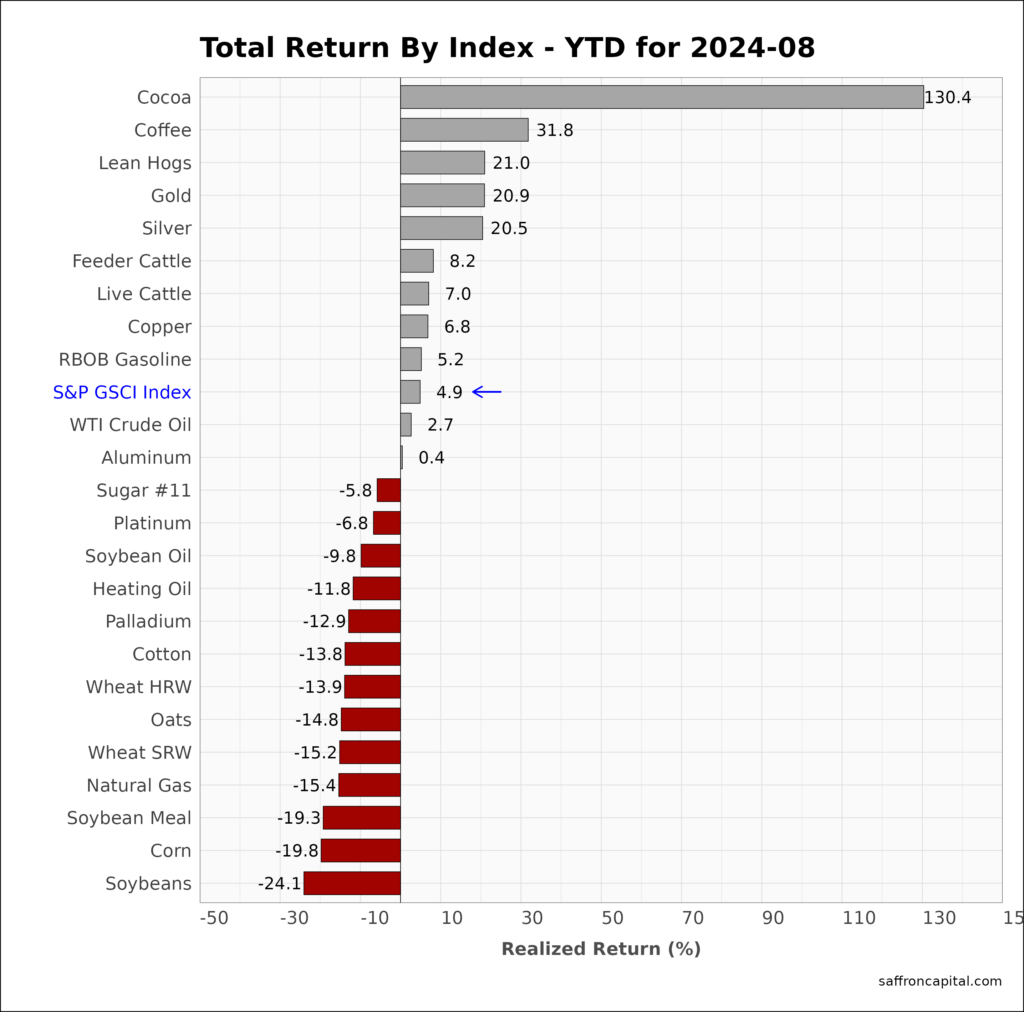
Commodities, as measured by S&P GS Commodity Index (-2.2%) has struggled to gain traction as inflation moderates. However, Cocoa (+19.5%), Coffee (+8.3%) and Aluminum (7.0%) saw outsized gains, while Gold (+2.8%) only modestly beat large cap equities. The weakest markets included Reformulated Gasoline (-10.9%), Lean Hogs (-10.9%) and Soybean Meal (-12.0%). Since December, the GS commodity index is up 4.9%.
Click to enlarge
Currencies
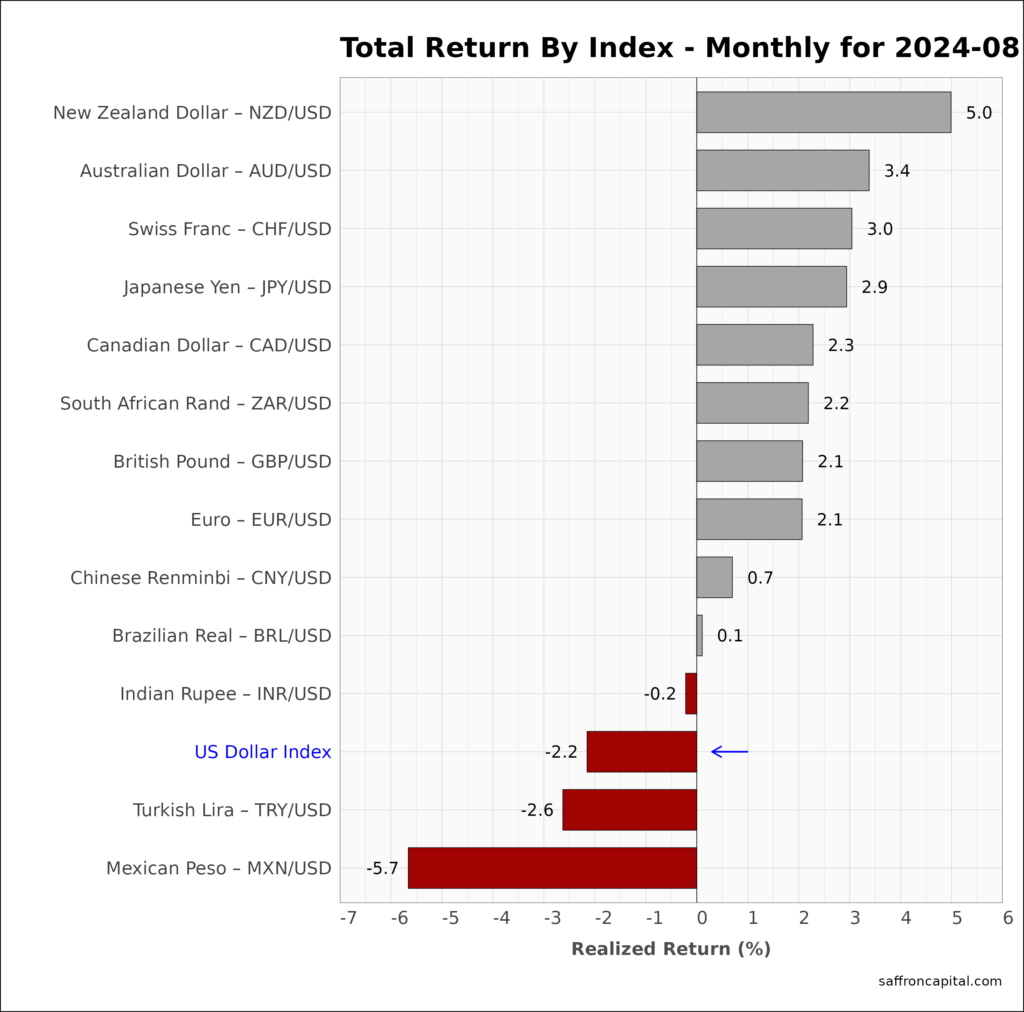
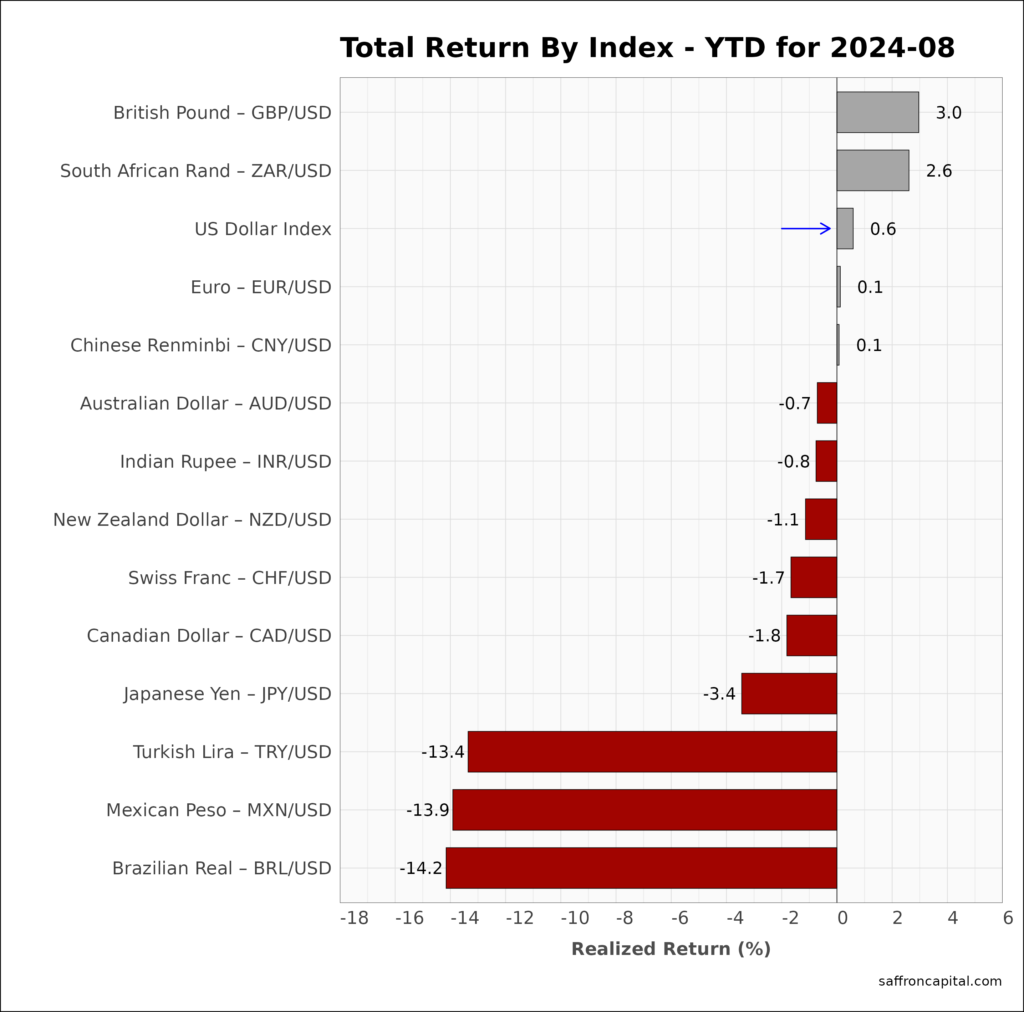
The U.S. Dollar index (-2.2%) fell in August and continues to erode the gains seen in the first half of the year. Year-to-date, the U.S. Dollar index (+0.6%) remain positive but is now being outperformed by gains in the British Pound (+3.0%). The weakest currencies since the first of the year include the Brazilian Real (-14.2%) and the Mexican Peso (-13.9%).
Cryptocurrencies
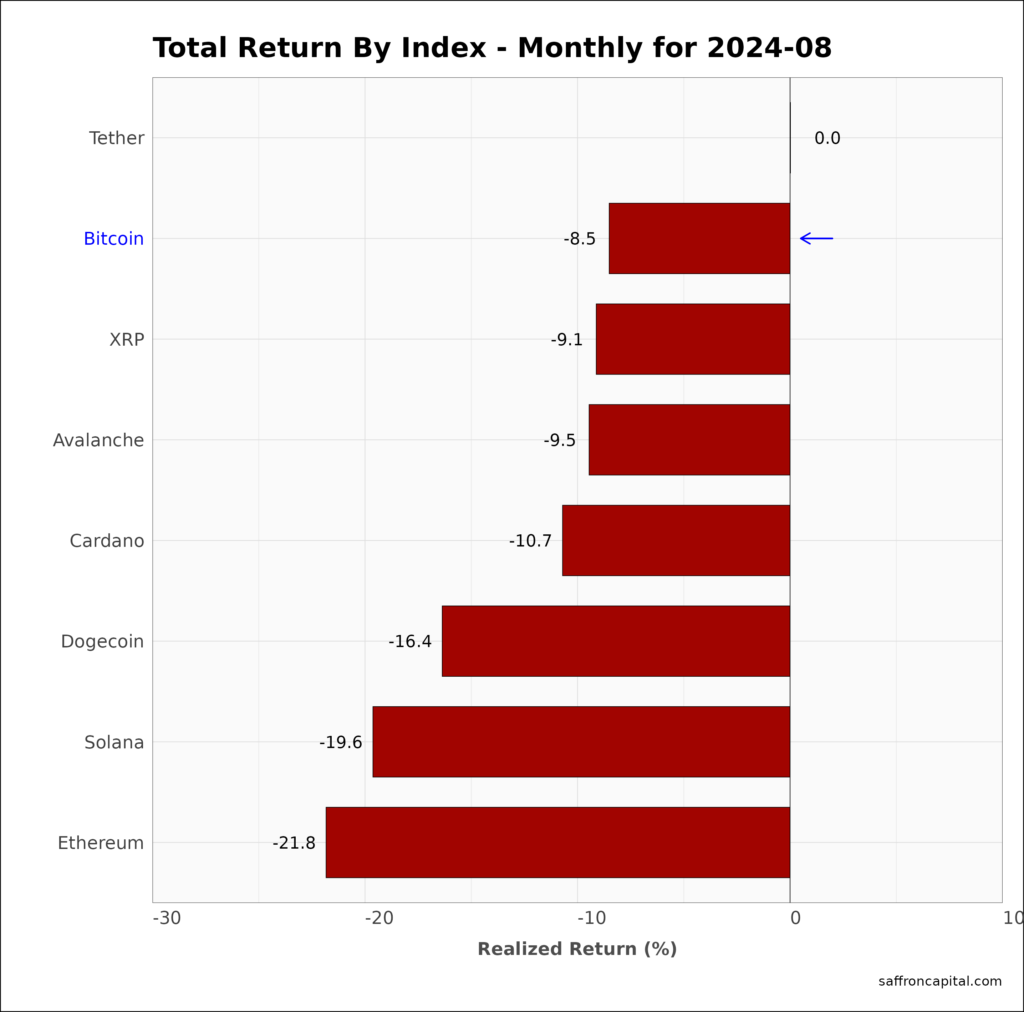
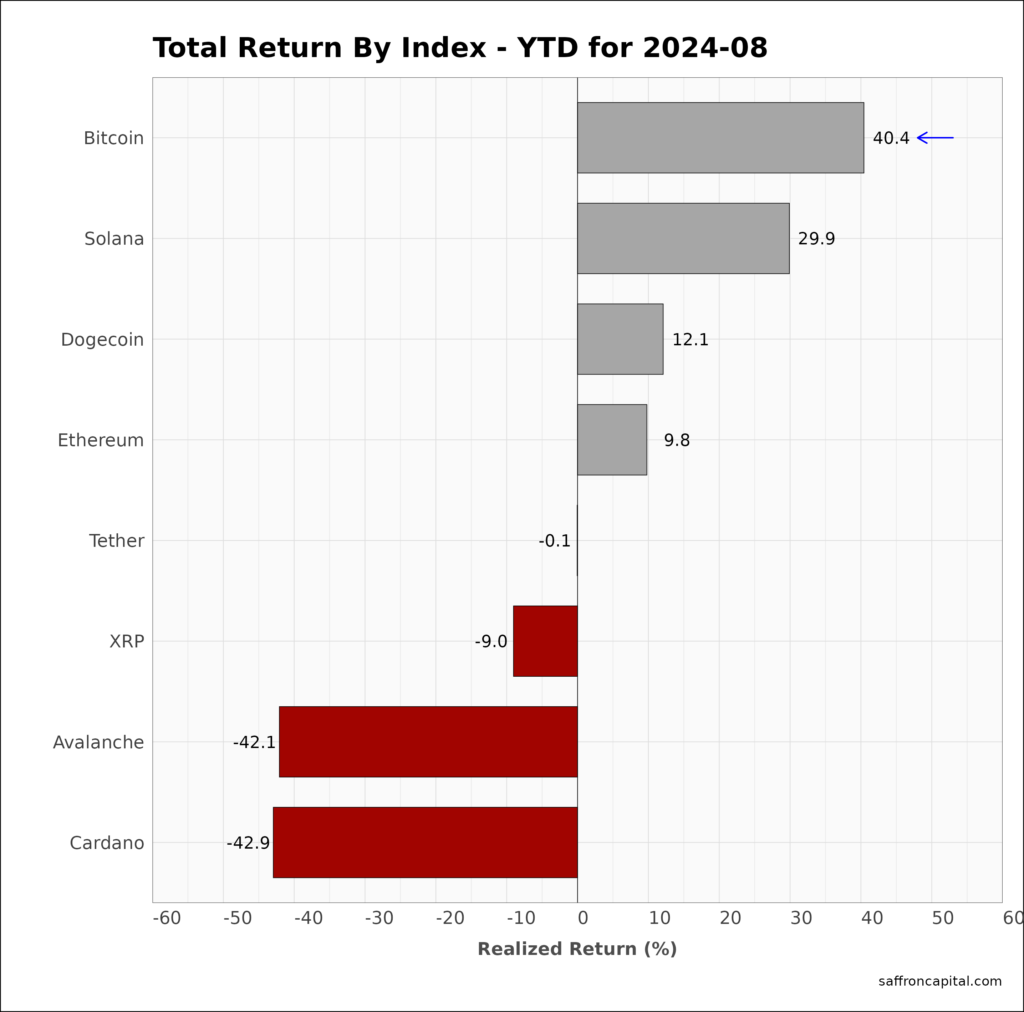
Cryptocurrencies were notably weak in August. Losses on Bitcoin (-8.5%) compare to losses on Dogecoin (-16.4%), Solana (-19.6%) and Ethereum (-21.8%). Year-to-date, gains on Bitcoin (+40.4%) are impressive.
Click to enlarge
Have questions or concerns about the performance of your portfolio? Could you benefit from a custom portfolio formulation that better reflects your goals and risk appetite? Whatever your needs are, we are here to listen and to help. To schedule a call or meeting, please contact us here.
Saffron Capital LLC is employee-owned and Minnesota-based. The company uses Interactive Brokers as its bank custodian and clearing merchant.


