June returns for the S&P 500 (+5.0%) were solid despite volatility from trade tensions, inflation concerns, and geopolitical risks. The last day of the quarter also saw a new all-time high, fueled by strong earnings from big tech and optimism from potential tax cuts. The recent rally is also notable for its breadth, benefiting mid- and small-cap stocks. The horse race between the US, the developed, and the emerging markets shows the US lagging Emerging Markets in June and trailing most developed or emerging markets year-to-date. Finally, long duration Treasuries had good returns in June, but lagged the performance seen across corporate investment grade and infrastructure bonds.
The following analysis reviews June returns by asset group and the key factors behind returns. The visual summary aims to help investors to benchmark portfolio returns and to see emerging trends from asset allocations across markets.
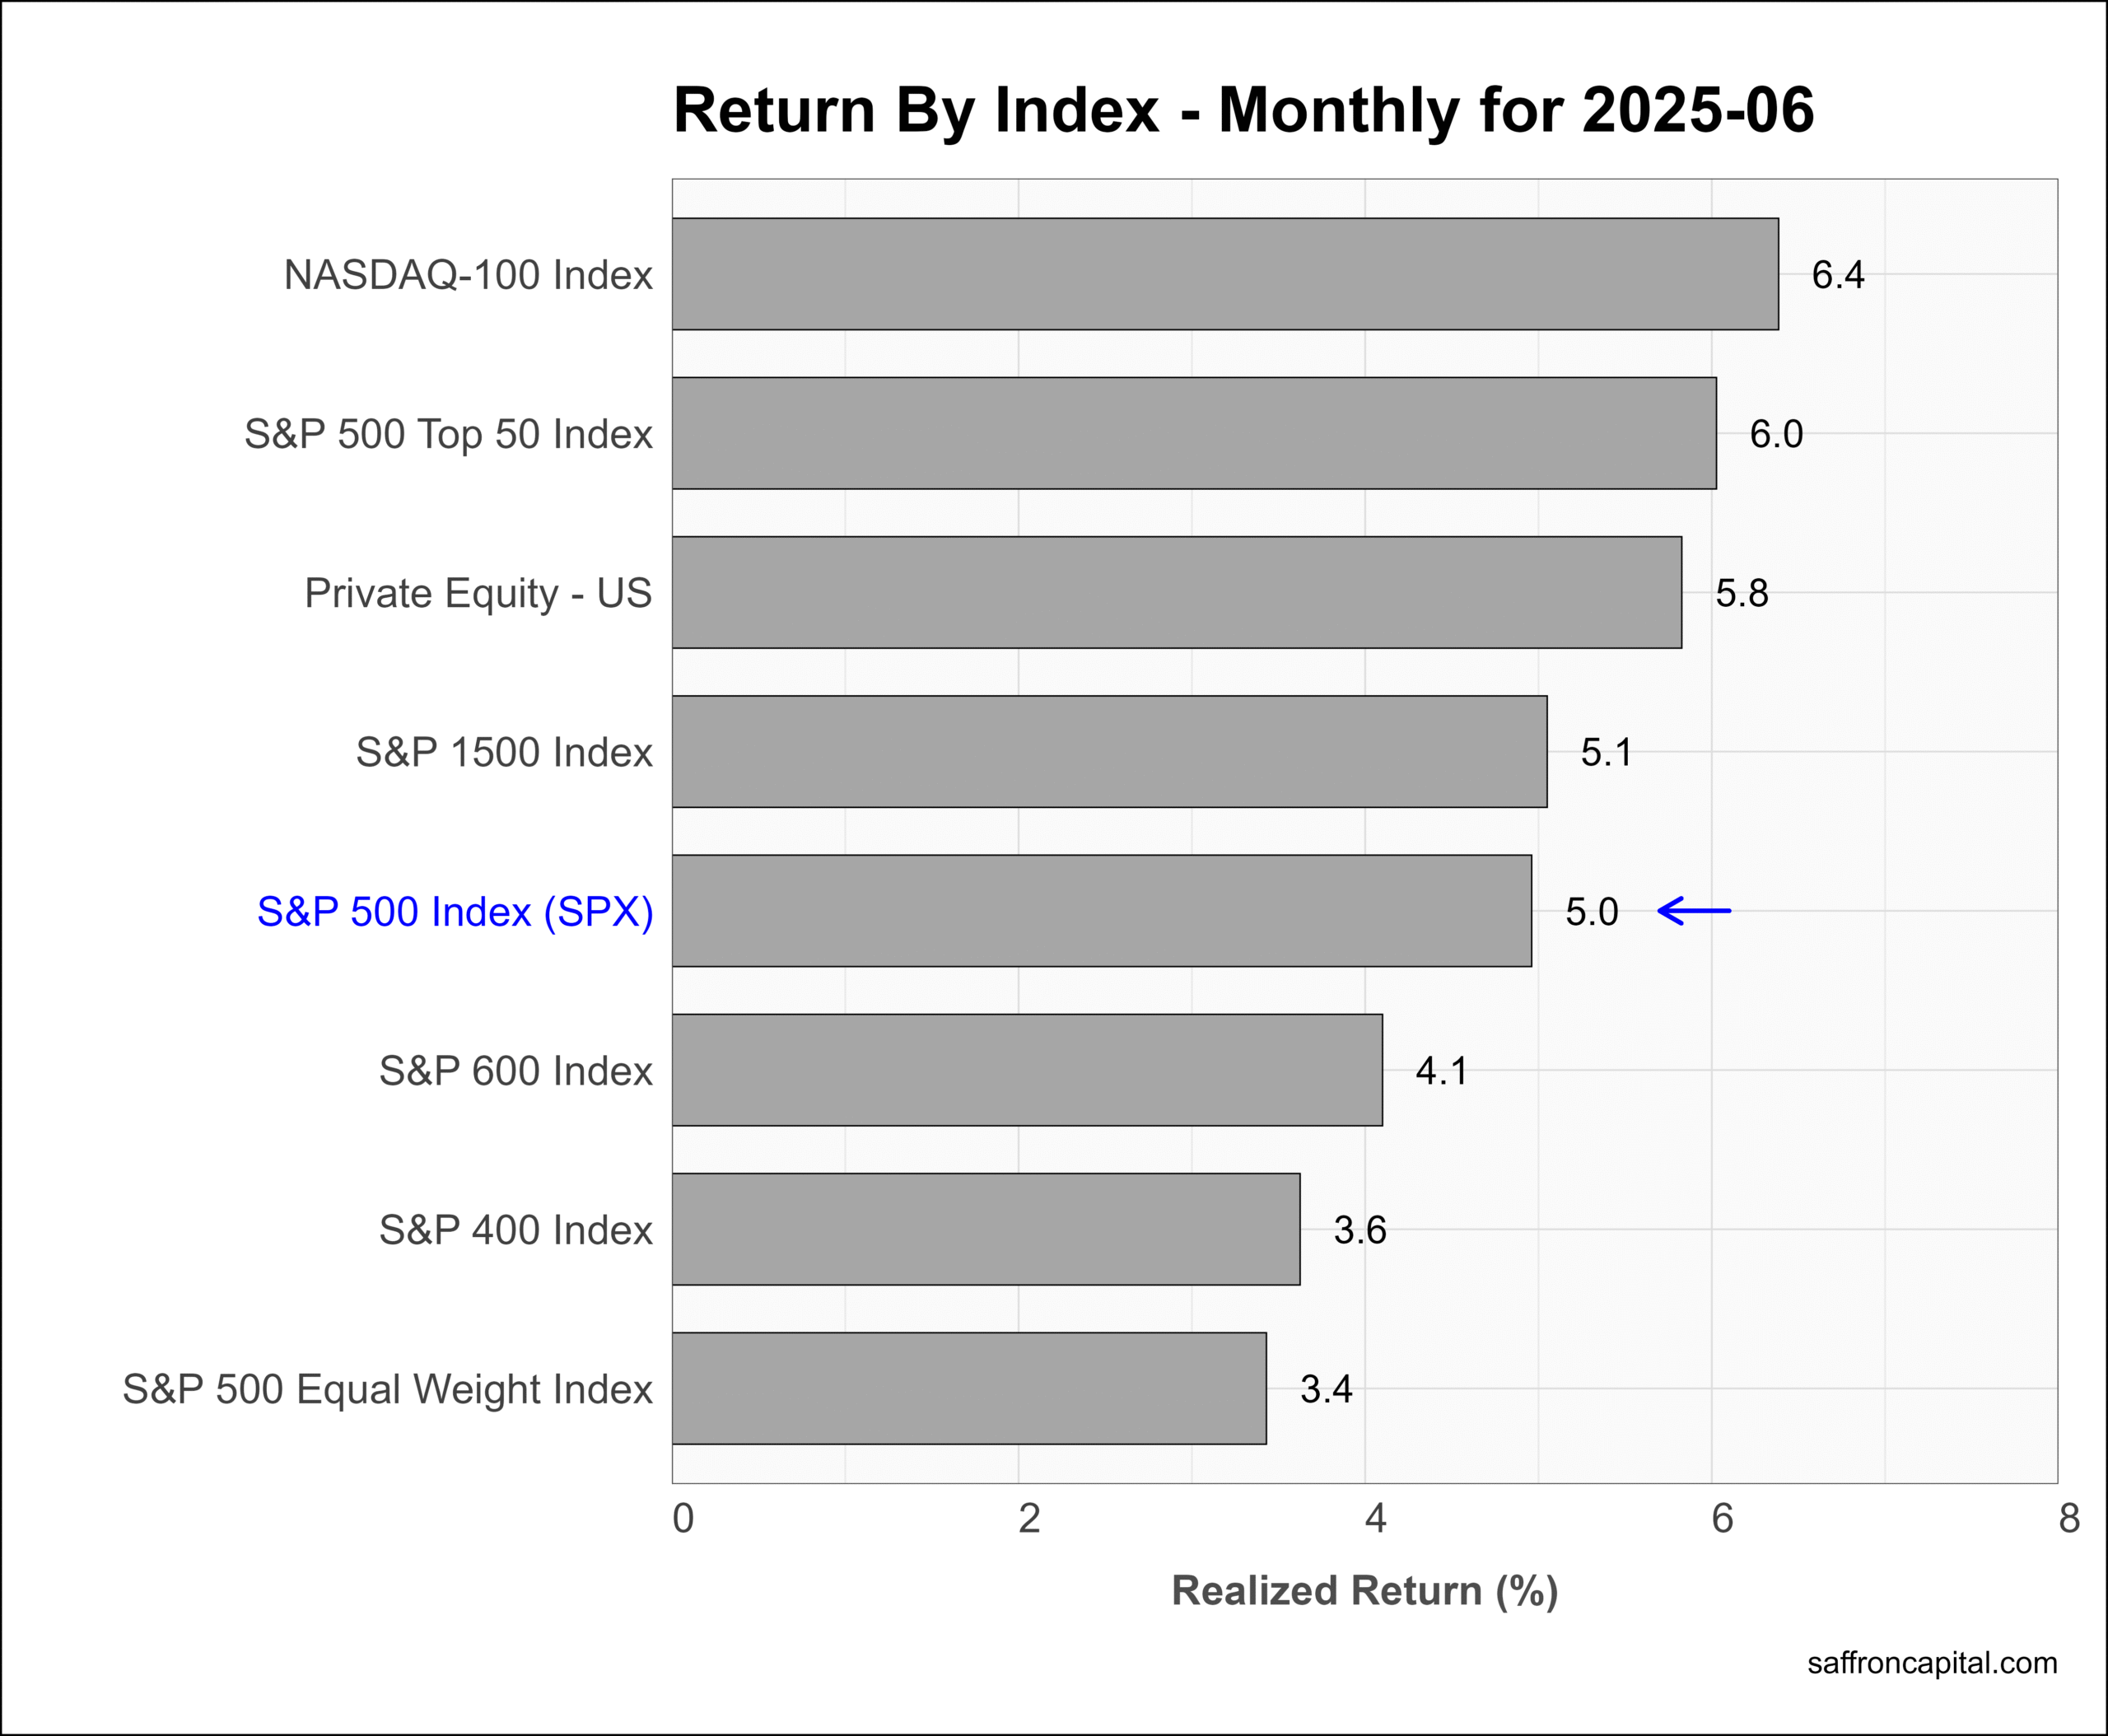
Core US Indices
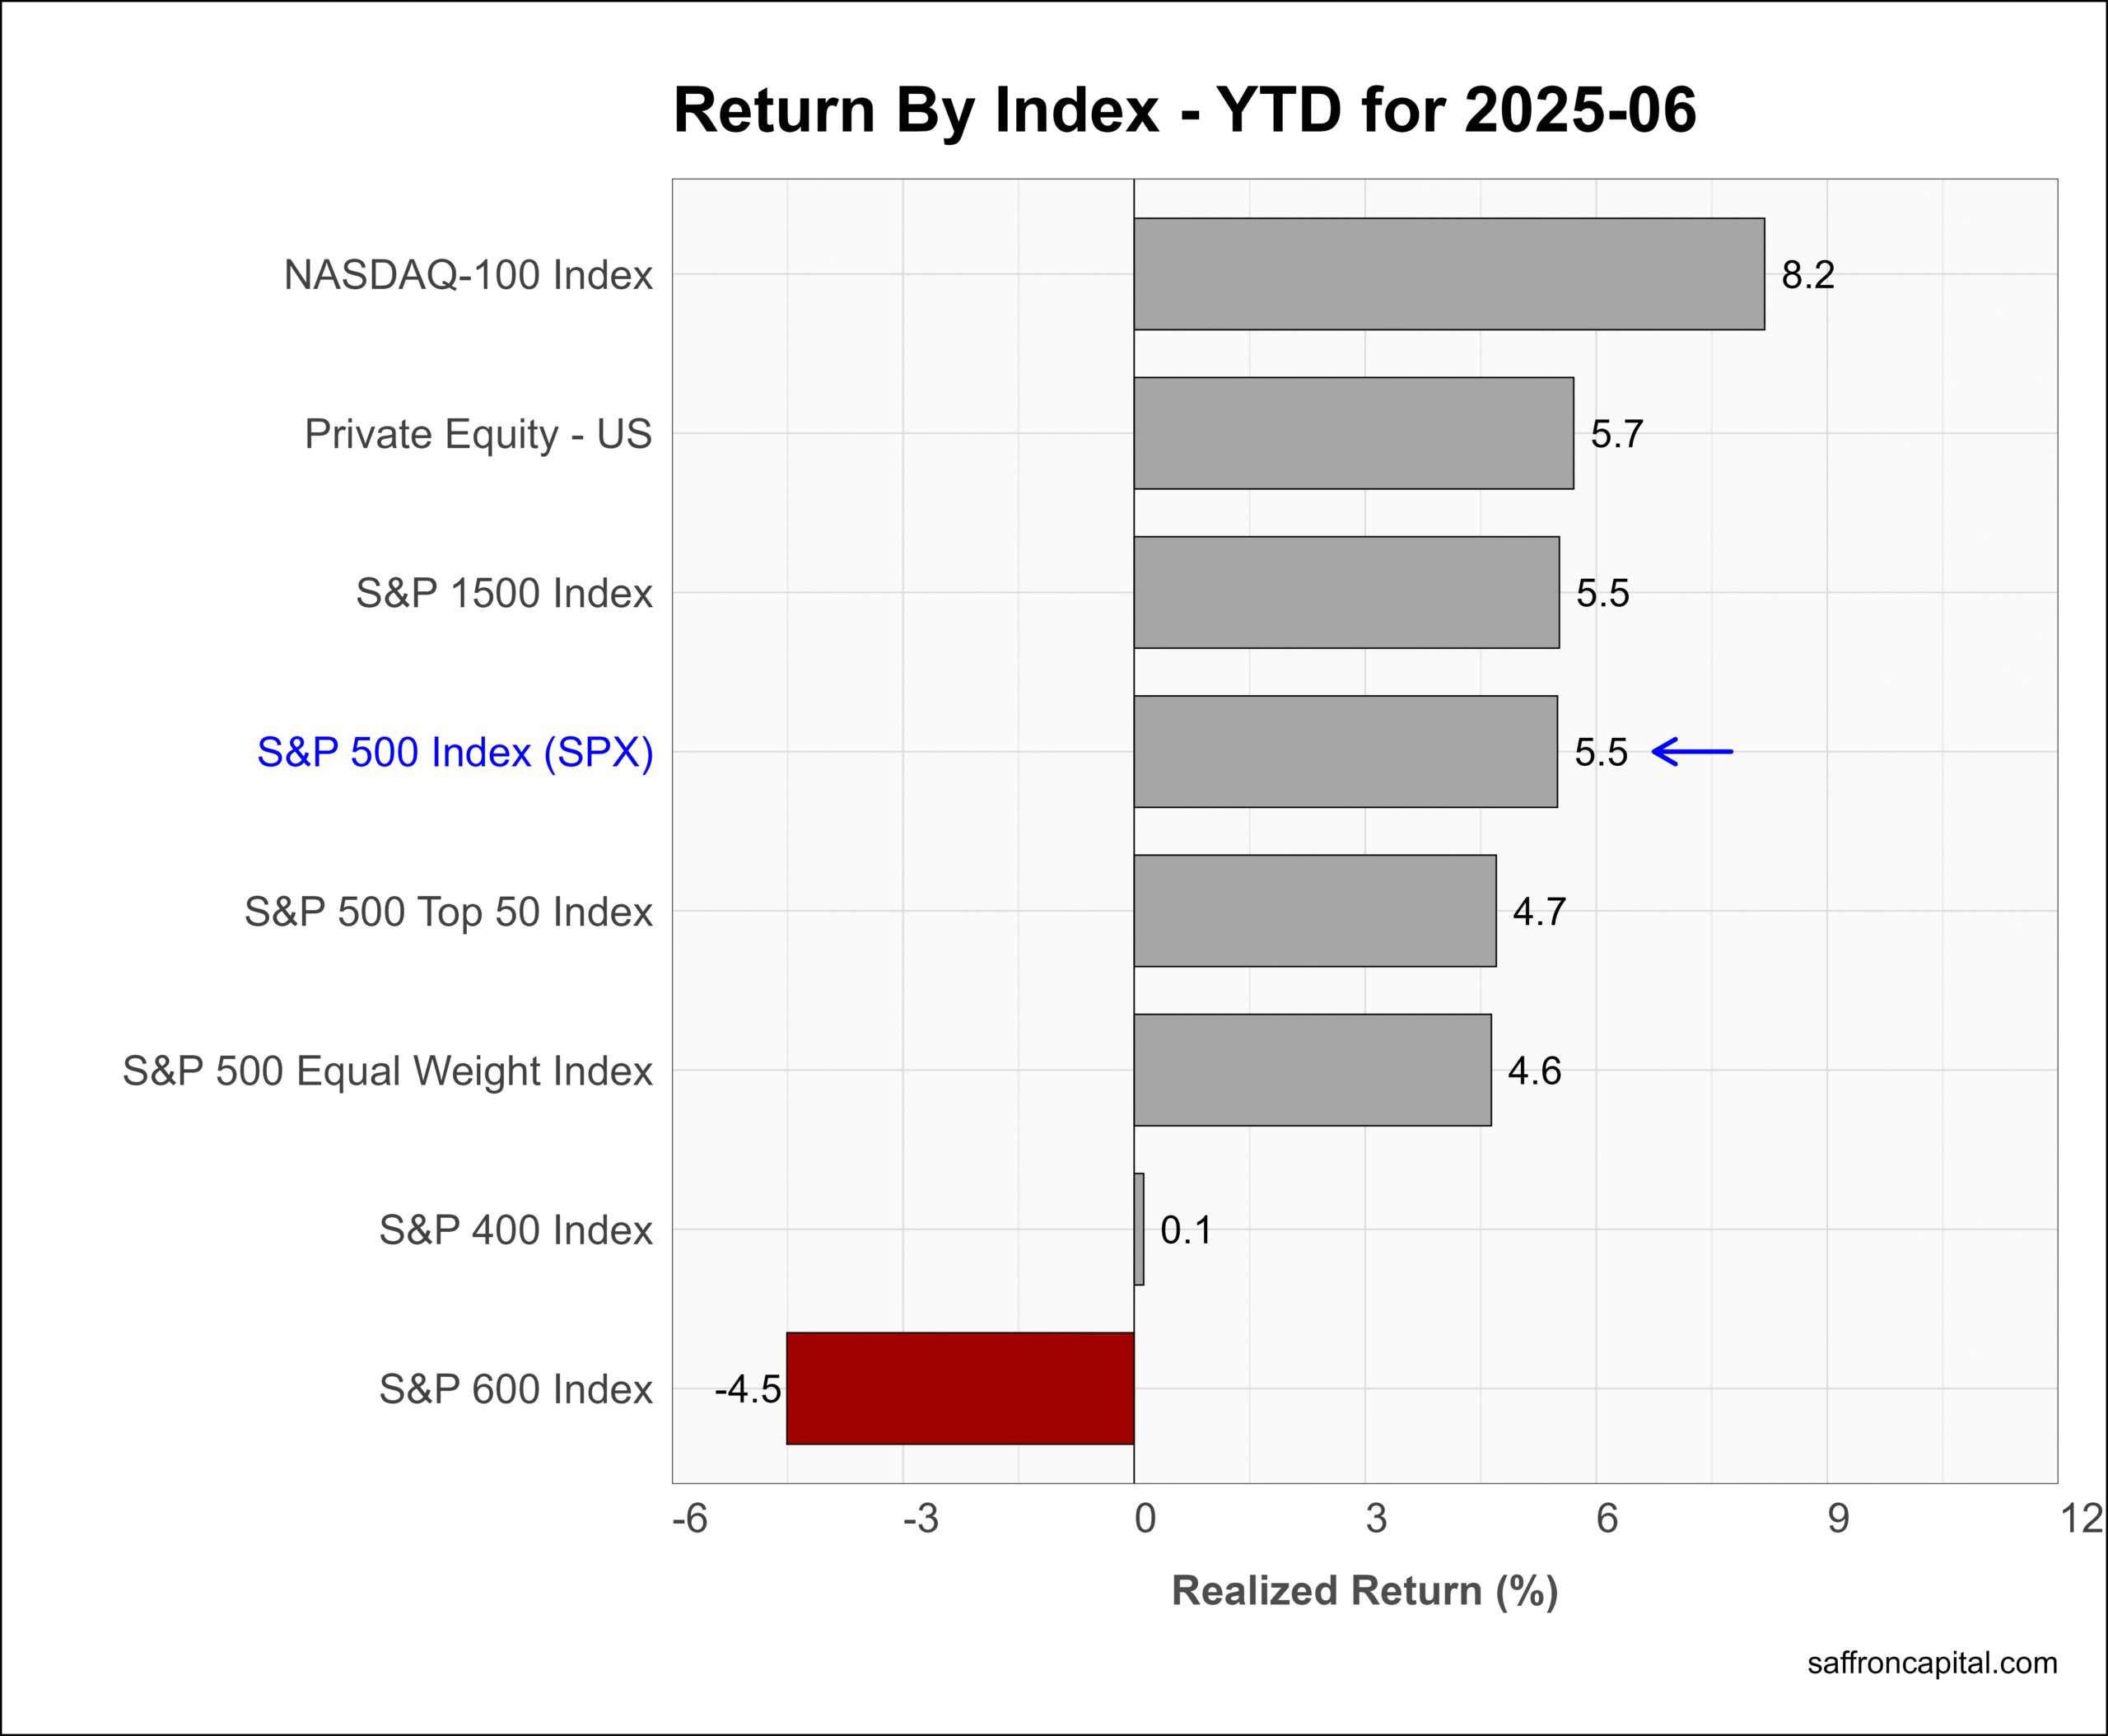
Headline indices posted gains in June with the technology-heavy NASDAQ index (+6.4%) leading the pack, followed by the S&P 500 Top 50 index (+6.0%). The mid-cap S&P 400 (+3.6%) had its best month of the year but lagged the small-cap S&P 600 index (+4.1%) and the large-cap S&P 500 index (+5.0%). Year-date, the S&P 500 index (-5.5%) lost its prior leadership over the NASDAQ-100 index (+8.2%). Finally, almost every risk measure for index volatility declined into the month-end, unlocking new capital flows.
Click to enlarge
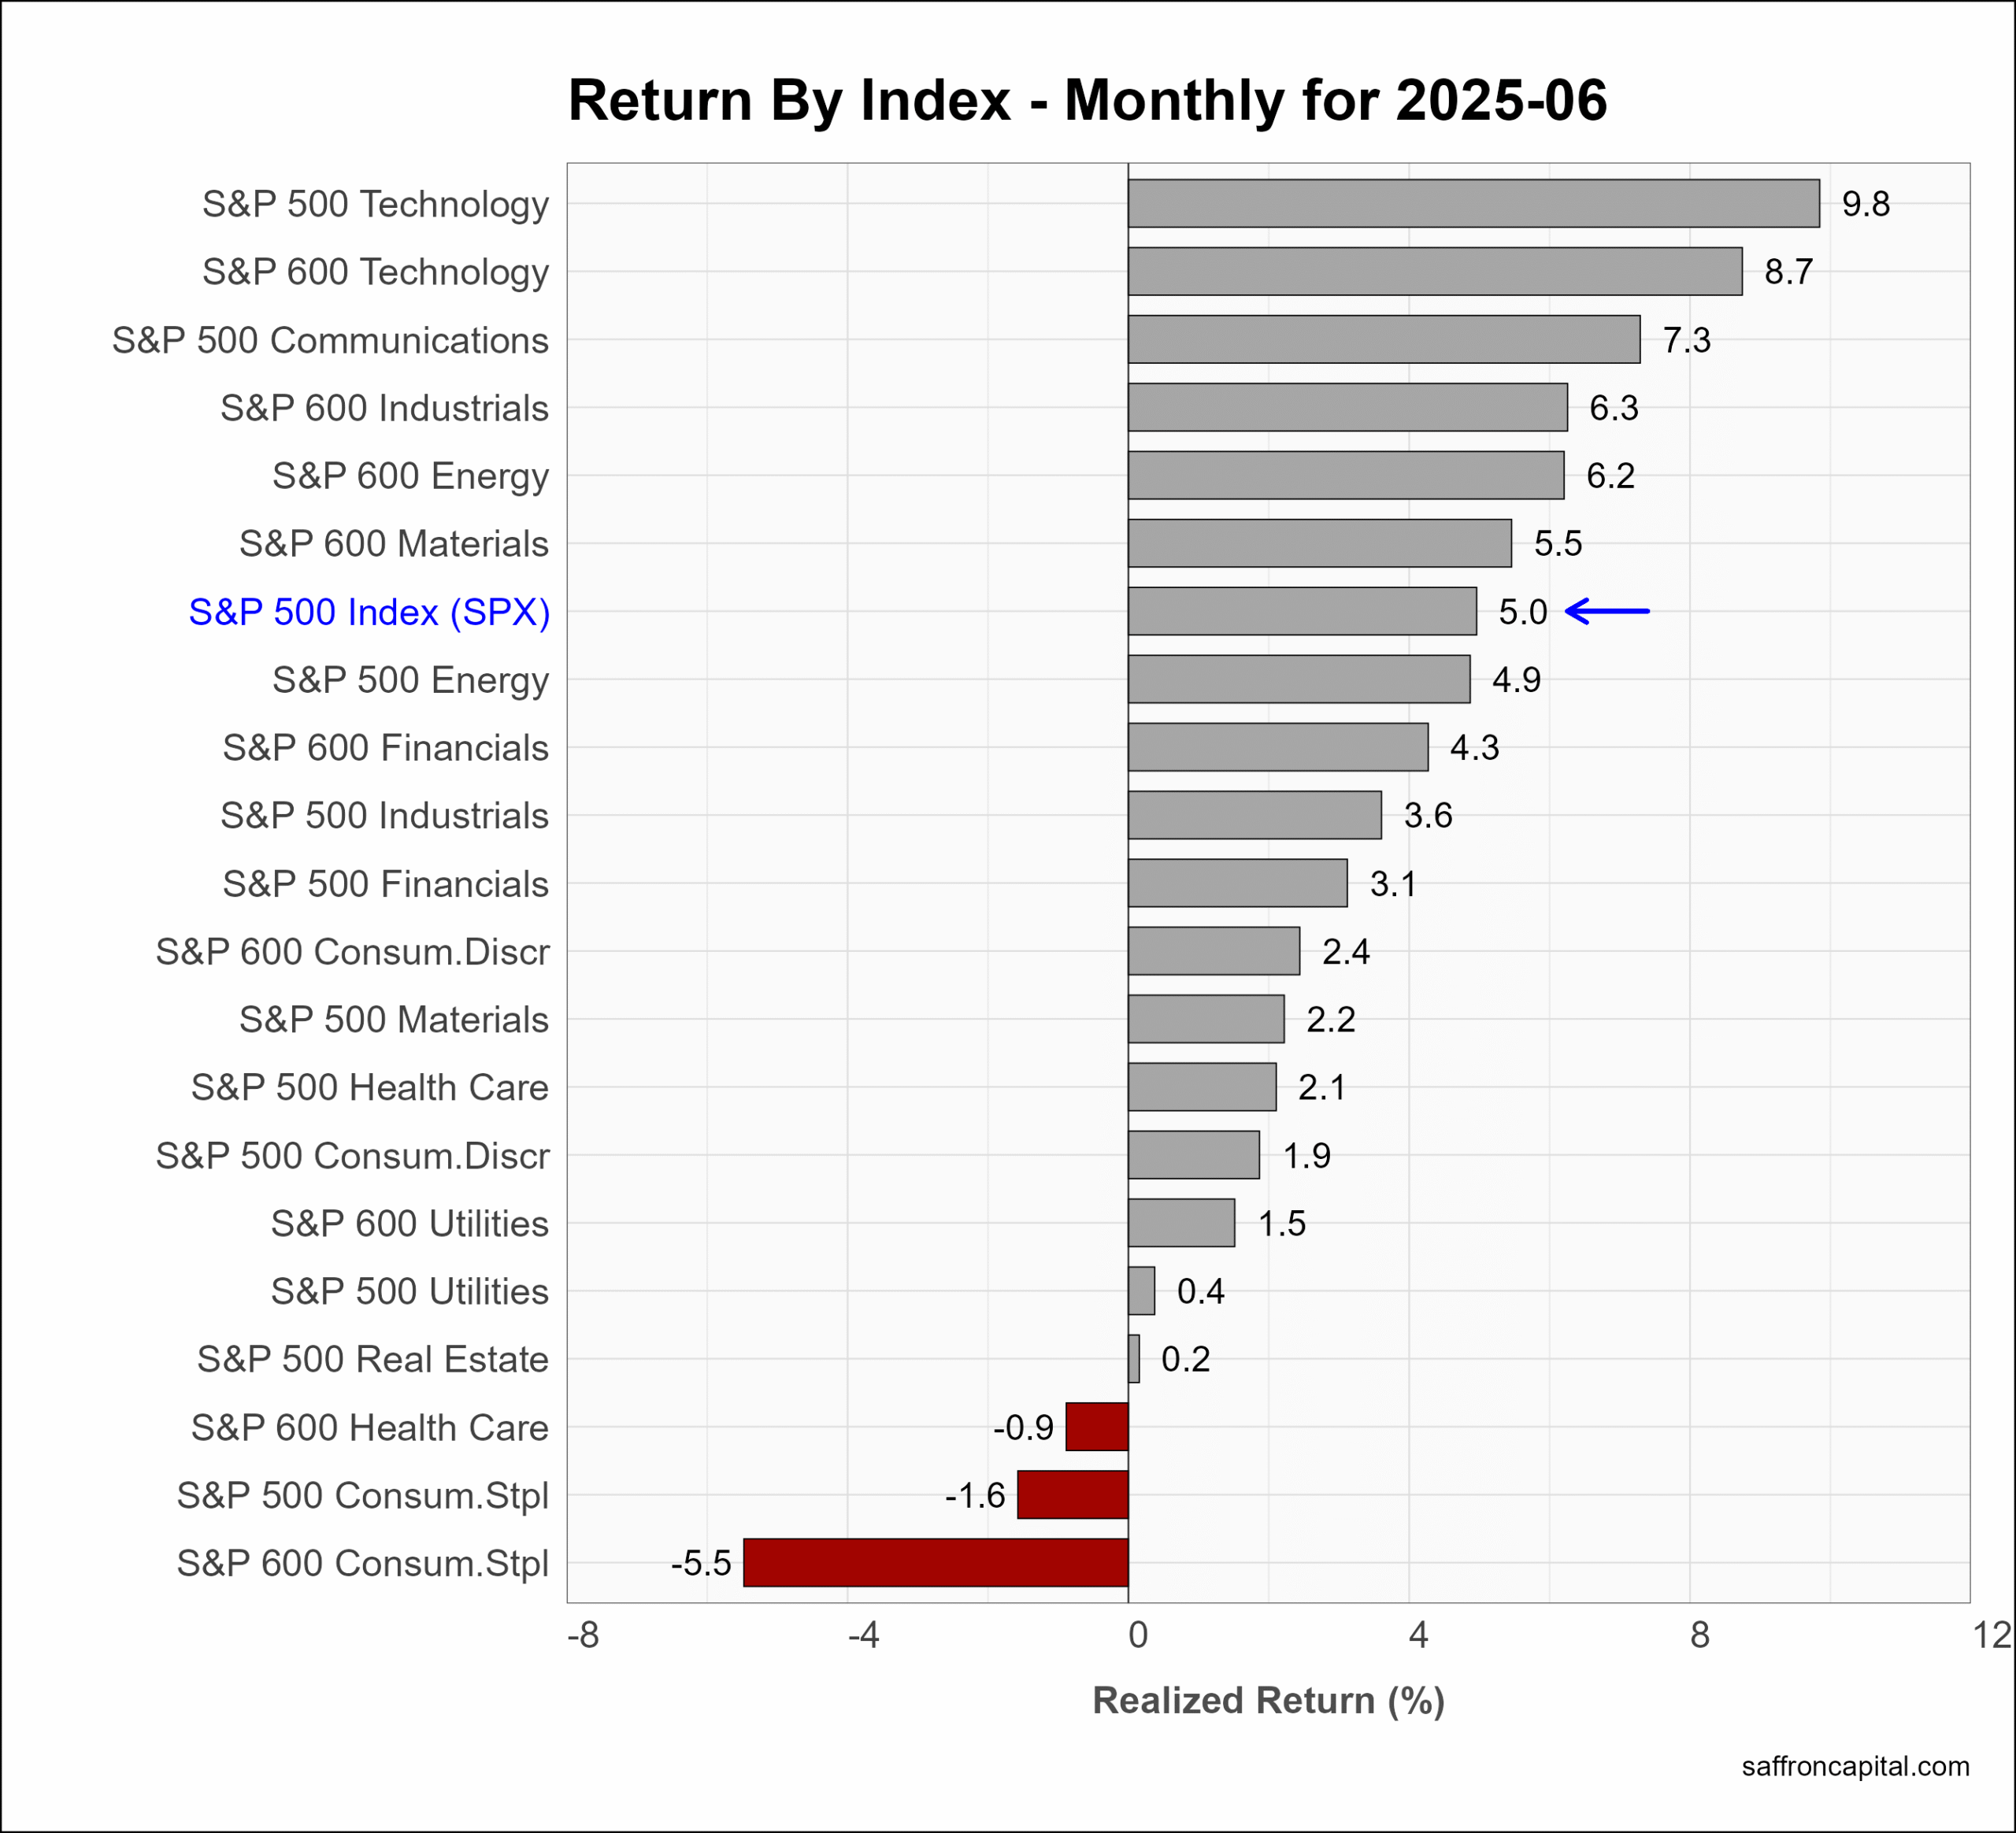
US Sector Indices
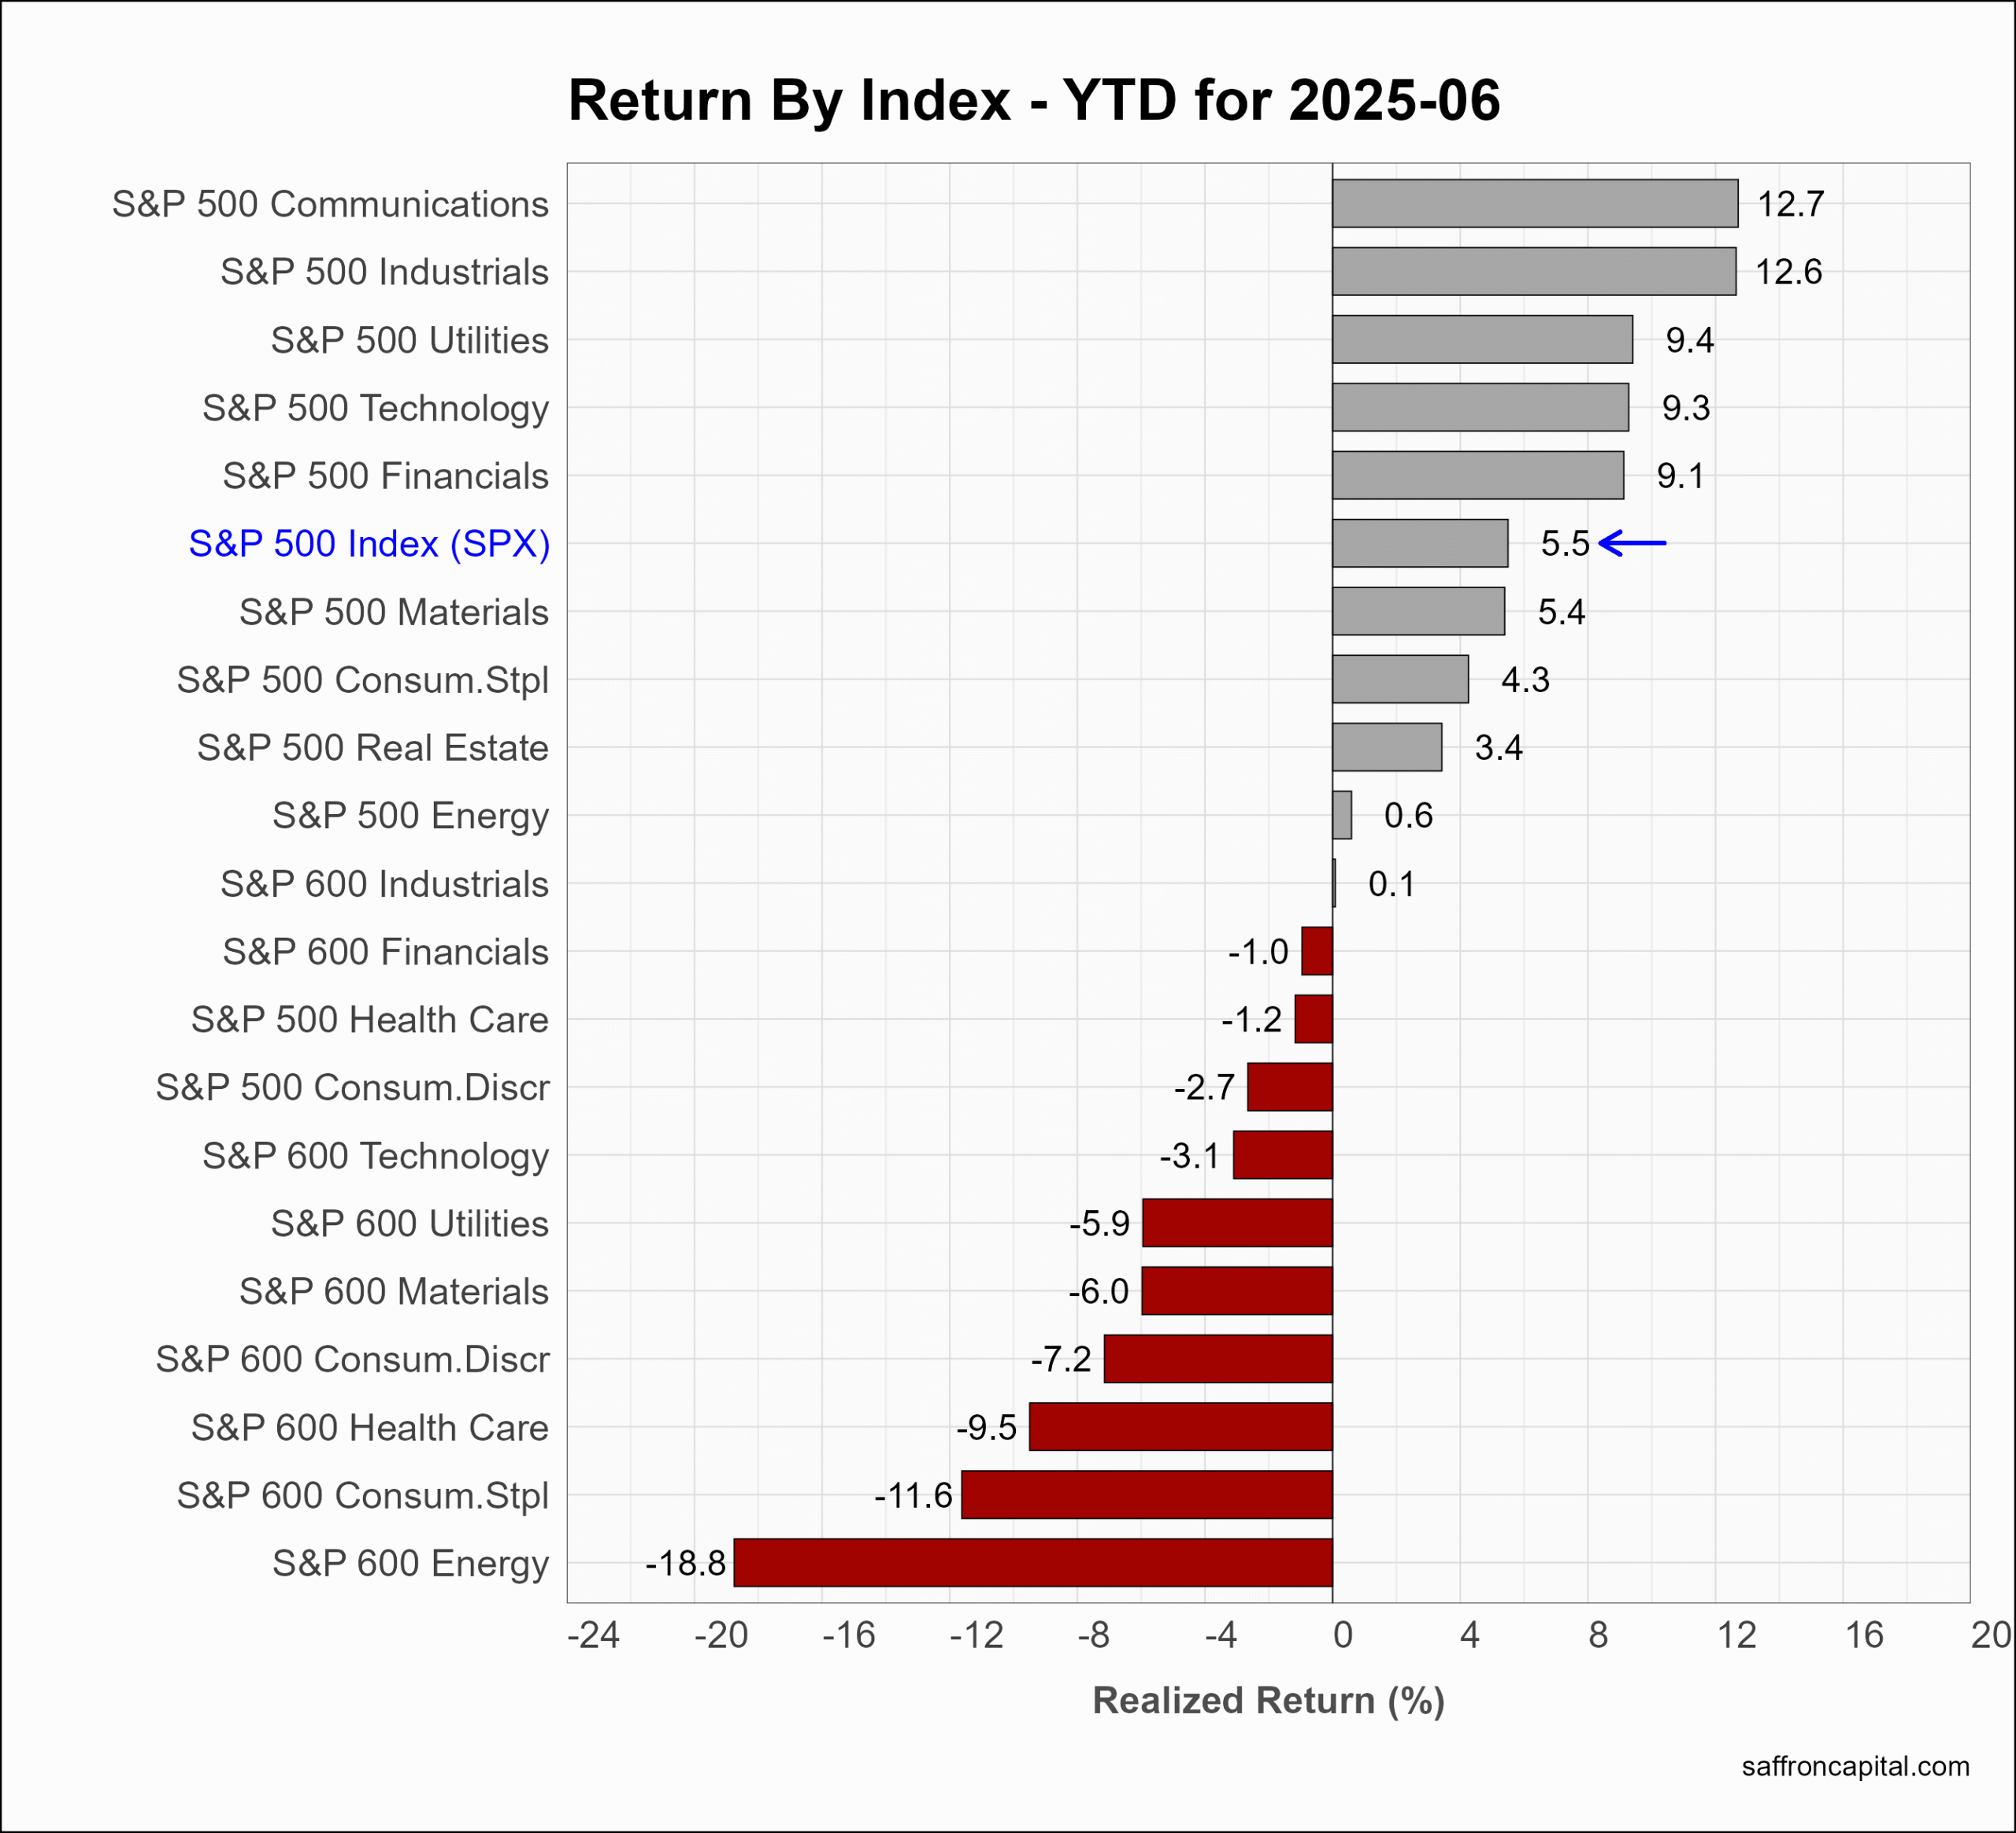
June returns saw a shift away from defensive sectors to large-cap Technology (+9.8%), Communication Services (+7.3%), and Energy (+4.9%). Other beneficiaries included small cap Technology (+8.7%), Industrials (+6.3%), and Energy (+6.2%). The resilient sectors year-to-date include large-cap Communication Services (+12.7%), Industrials (+12.6%), and Utilities (+9.4%). Lots of red ink is also evident among many small-cap sectors. Lastly, note that high interest rates have not suppressed returns for large-cap Real Estate (+3.4%).
Click to enlarge
US Factor Indices
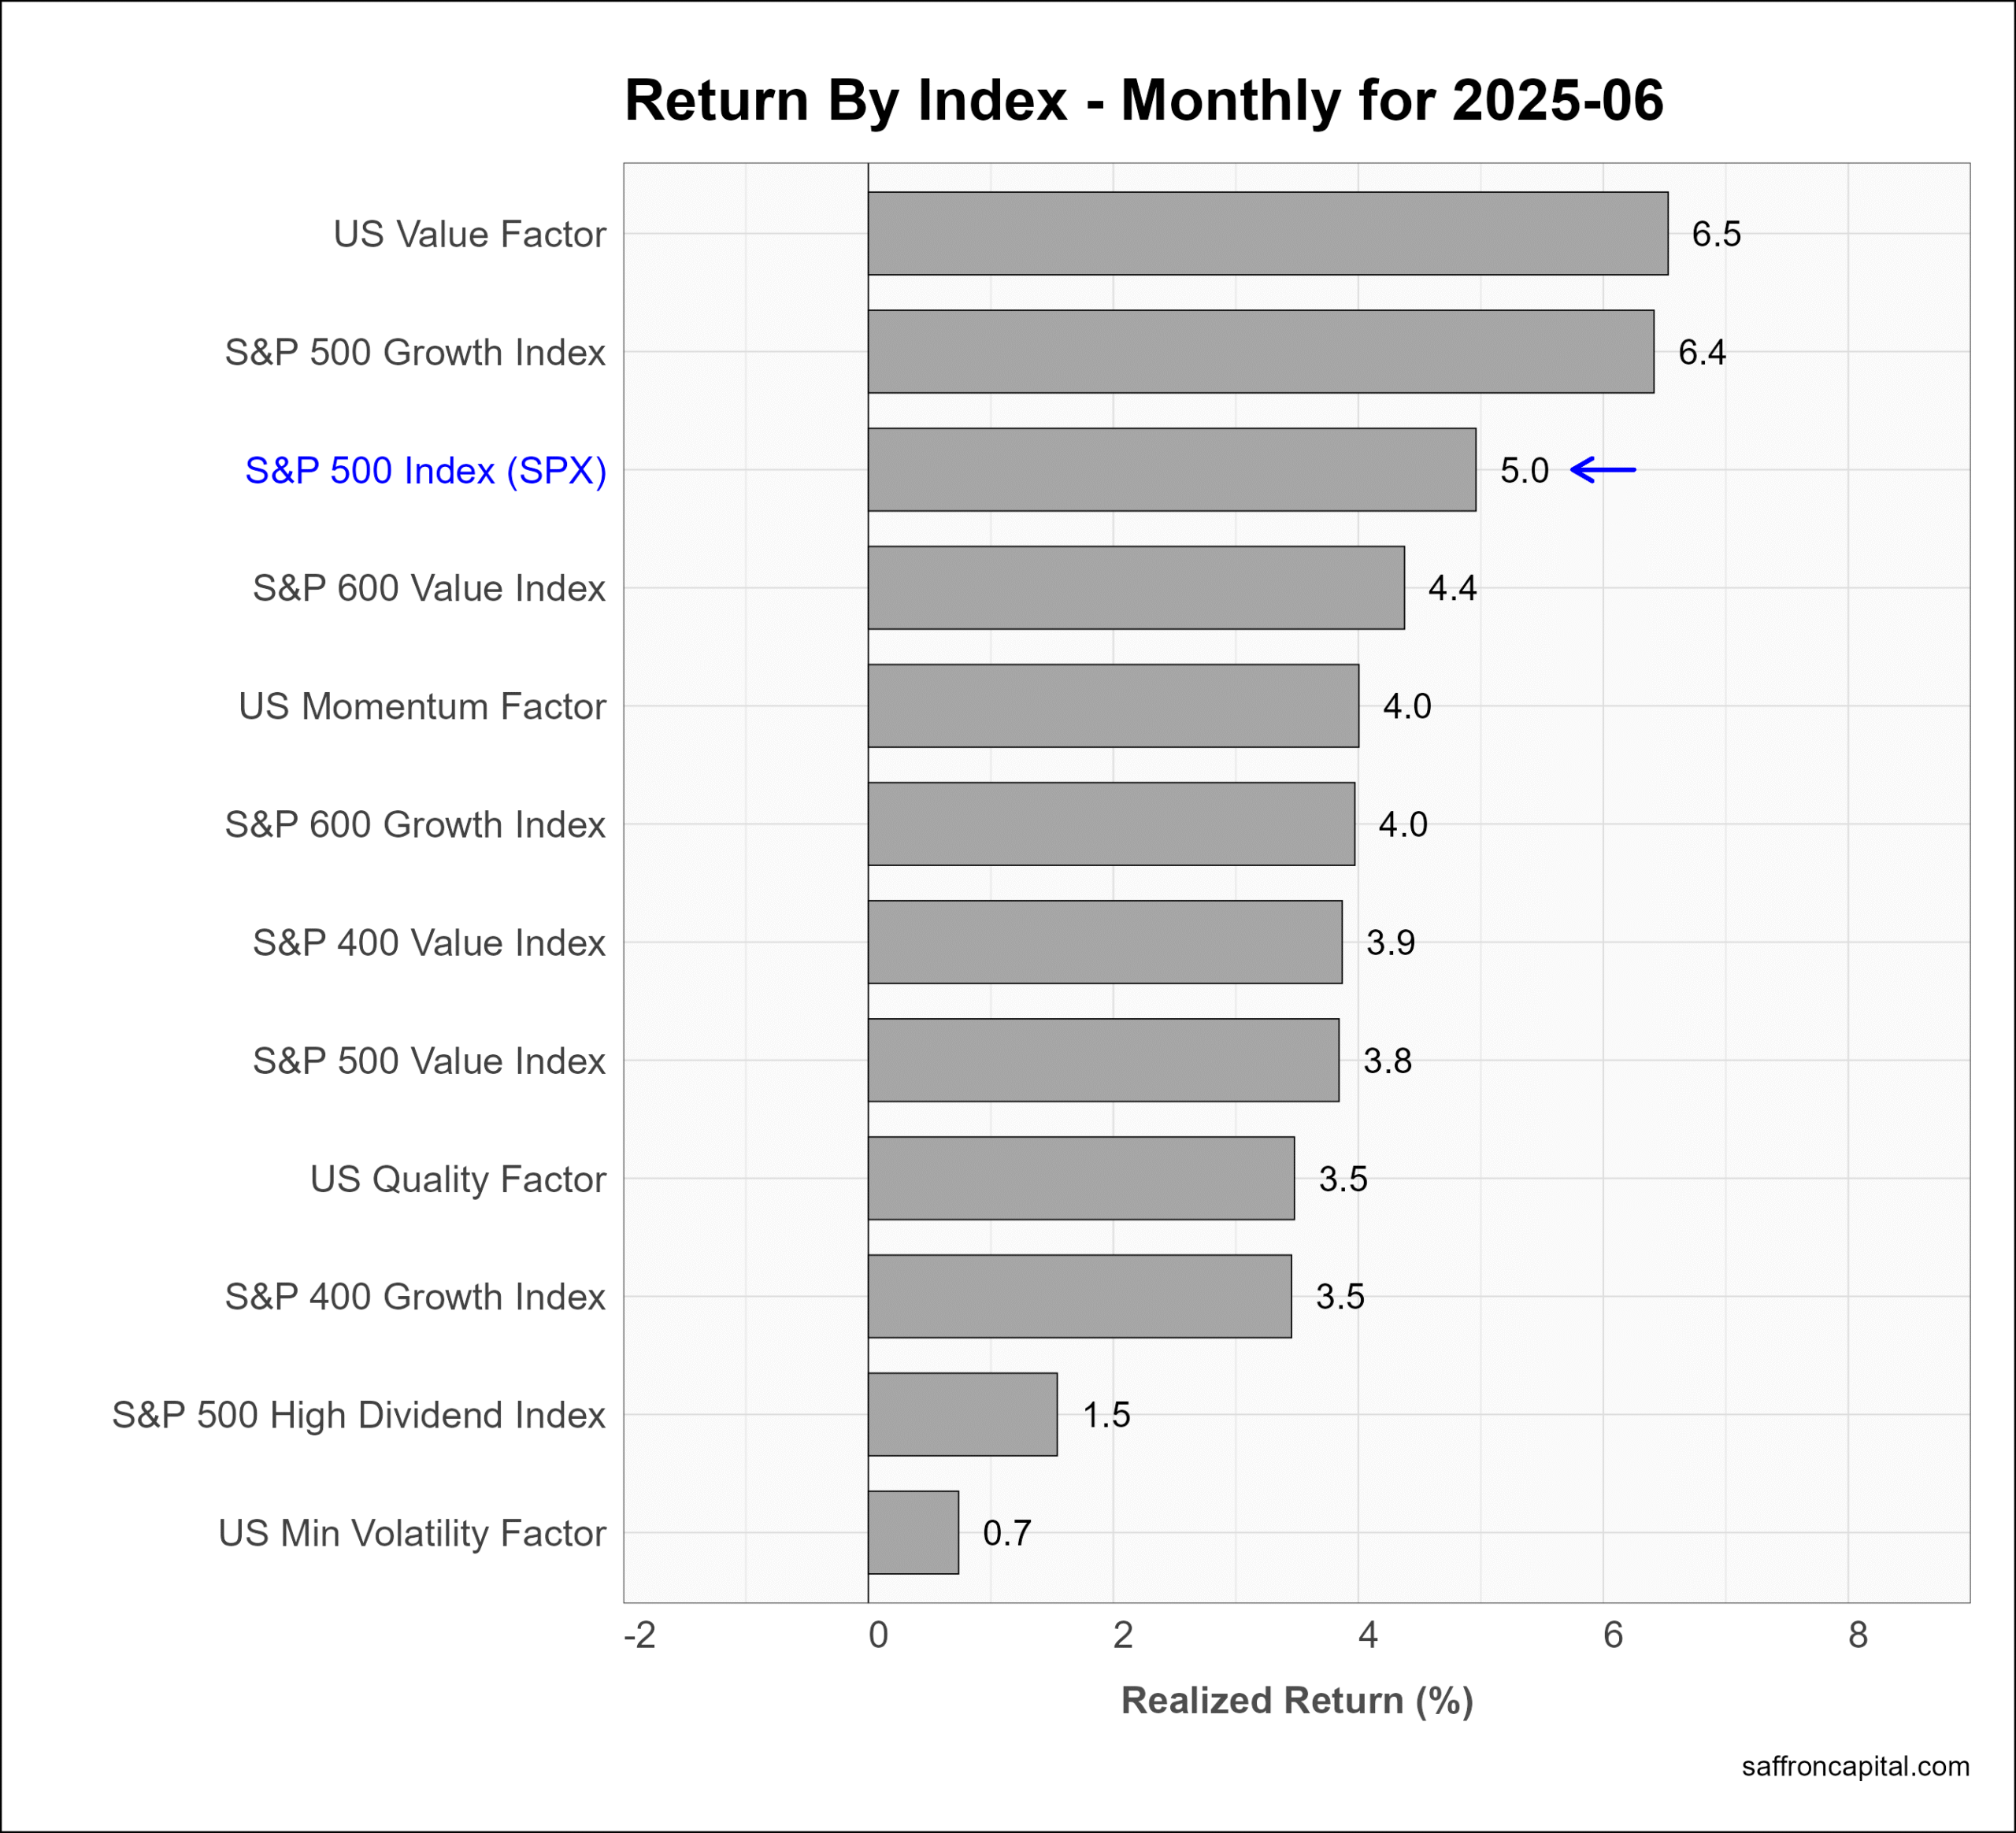
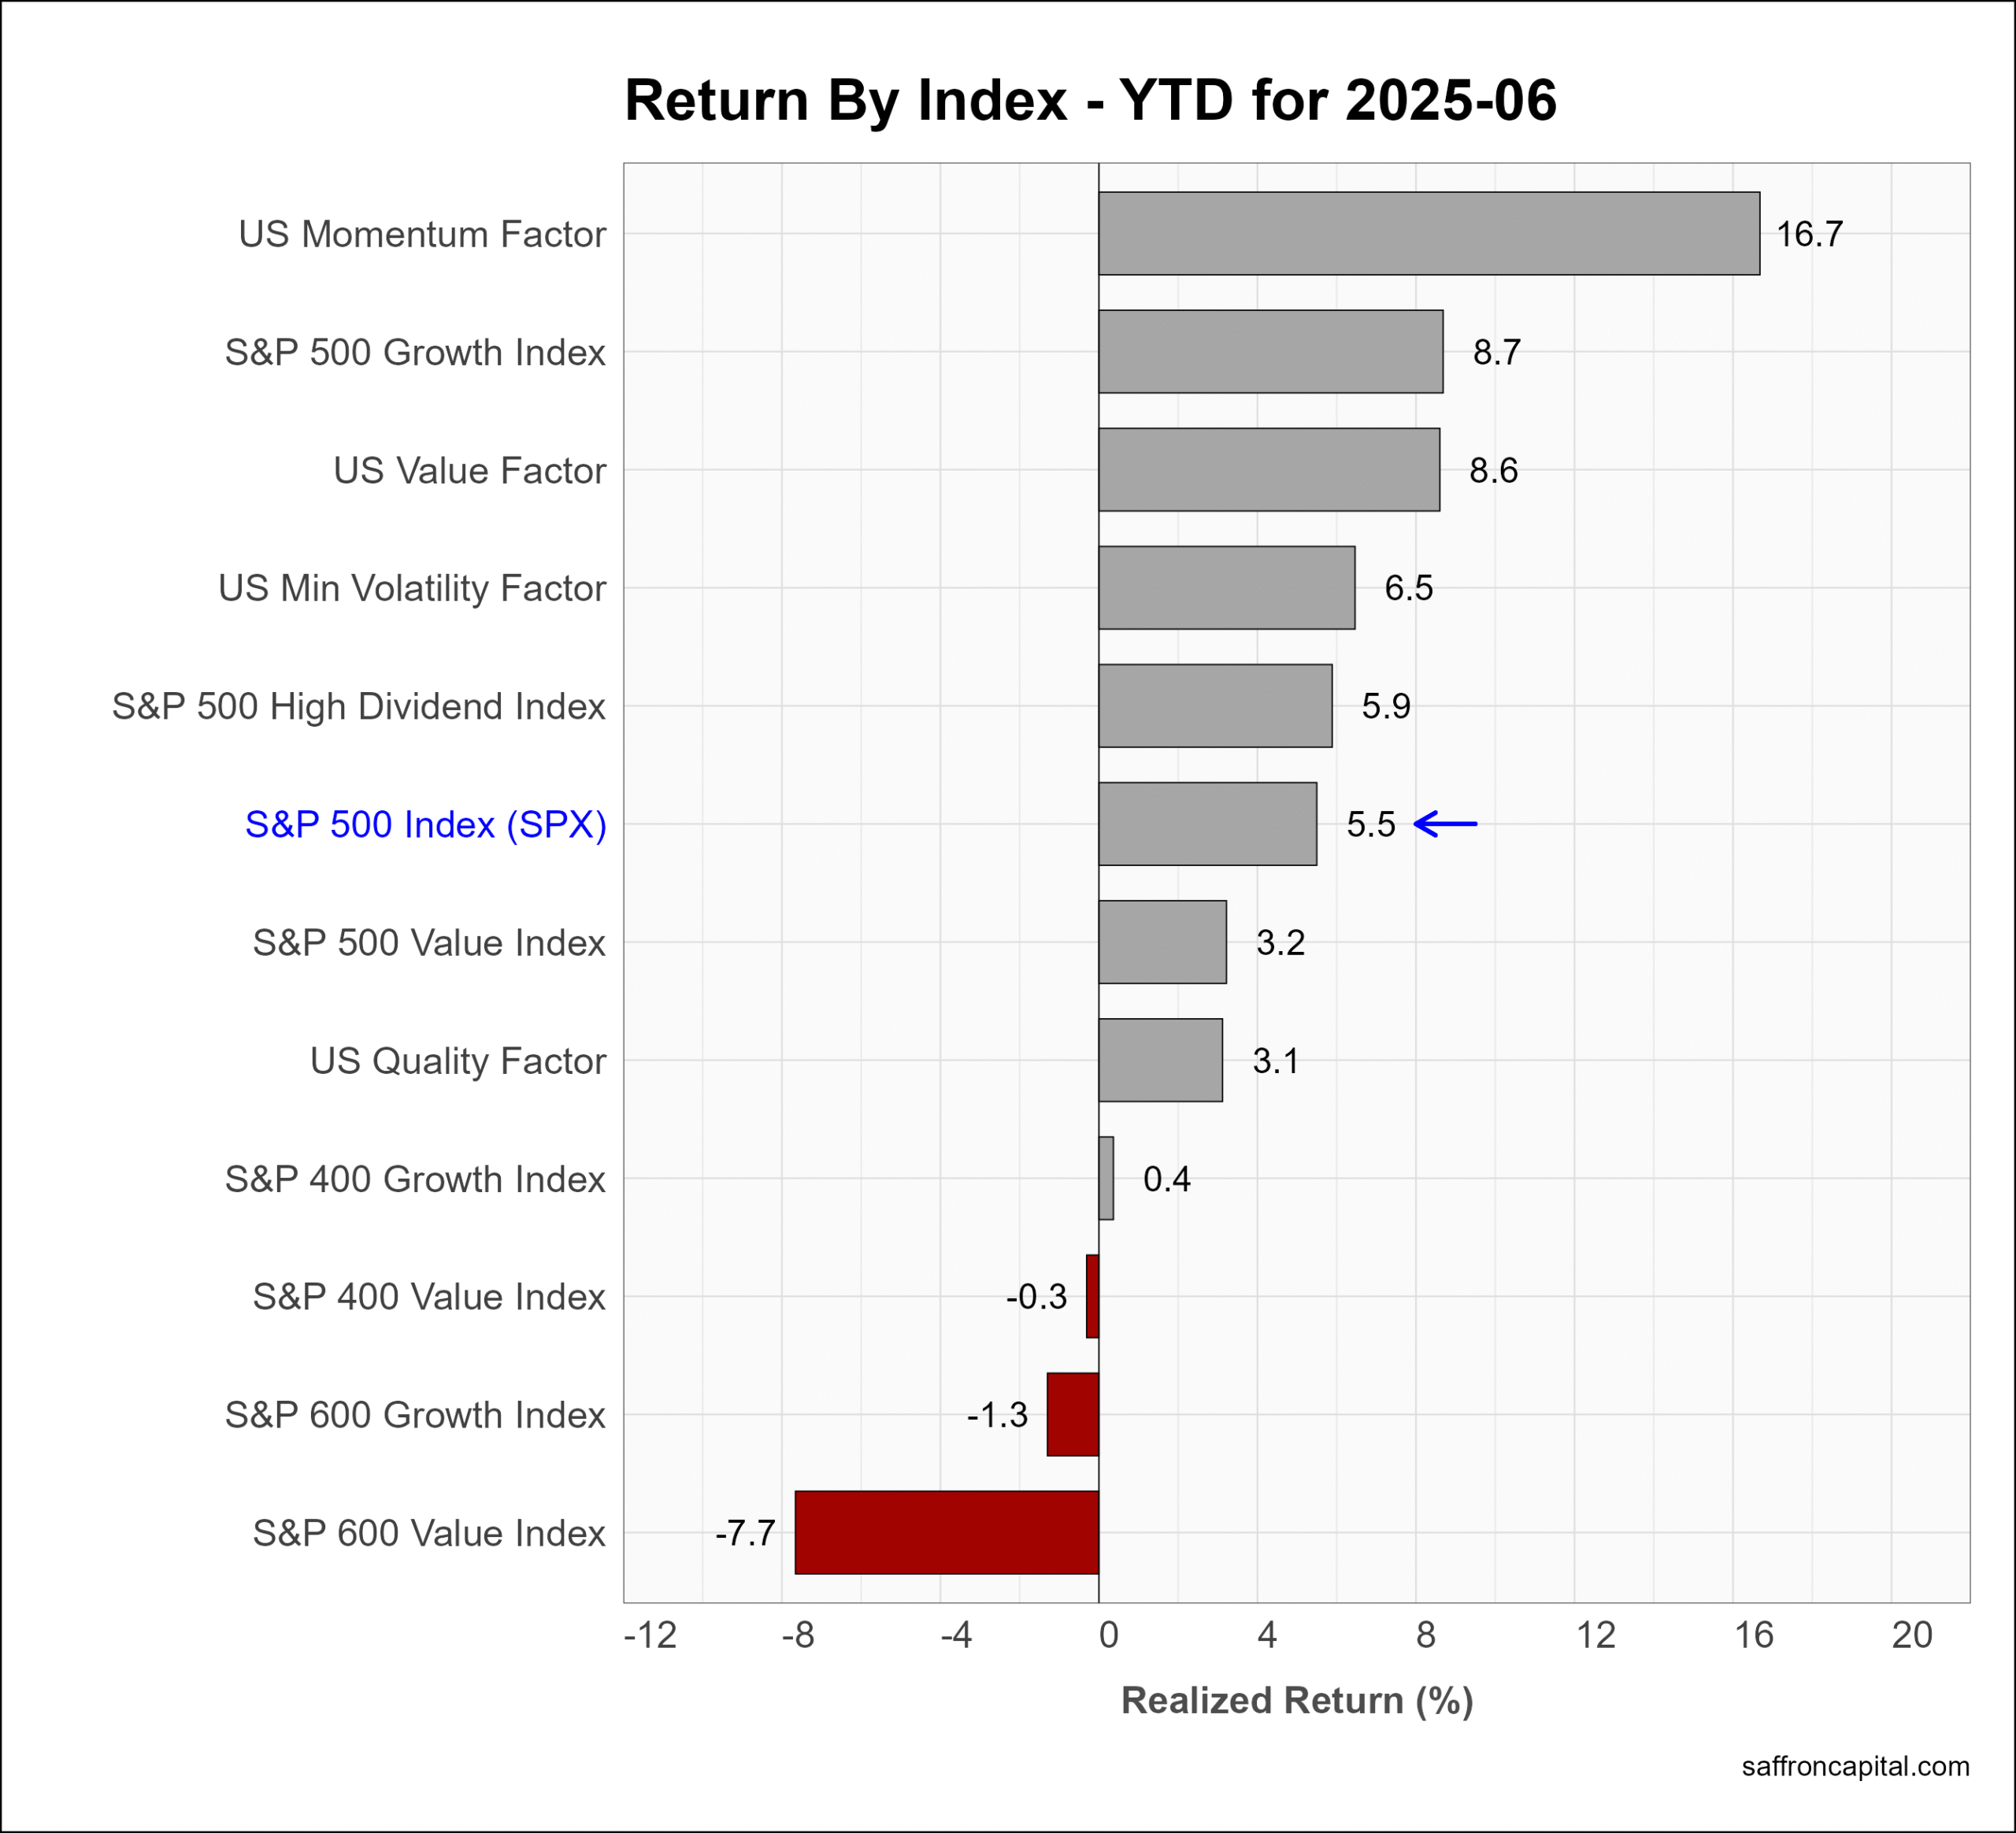
Factor portfolios are constructed to capture the core drivers behind returns, which include company size, relative value, profitability, growth, and momentum. Multi-factor portfolios combine two or more factors. In June, only the Value portfolio (+6.5%) and large-cap growth shares (+6.4%) outperformed the S&P 500 index. The US Momentum portfolio (+4.0%) had good returns but lagged the index. Year to date, Momentum (+16.7%) is the clear leader, followed by the Growth (+8.7%) and Value (+8.6%) portfolios. Small-cap Value (-7.7%) and Growth (-1.3%) are lagging but may catch up to index in the second half of 2025 as market breadth improves.
Click to enlarge
US Thematic Portfolios
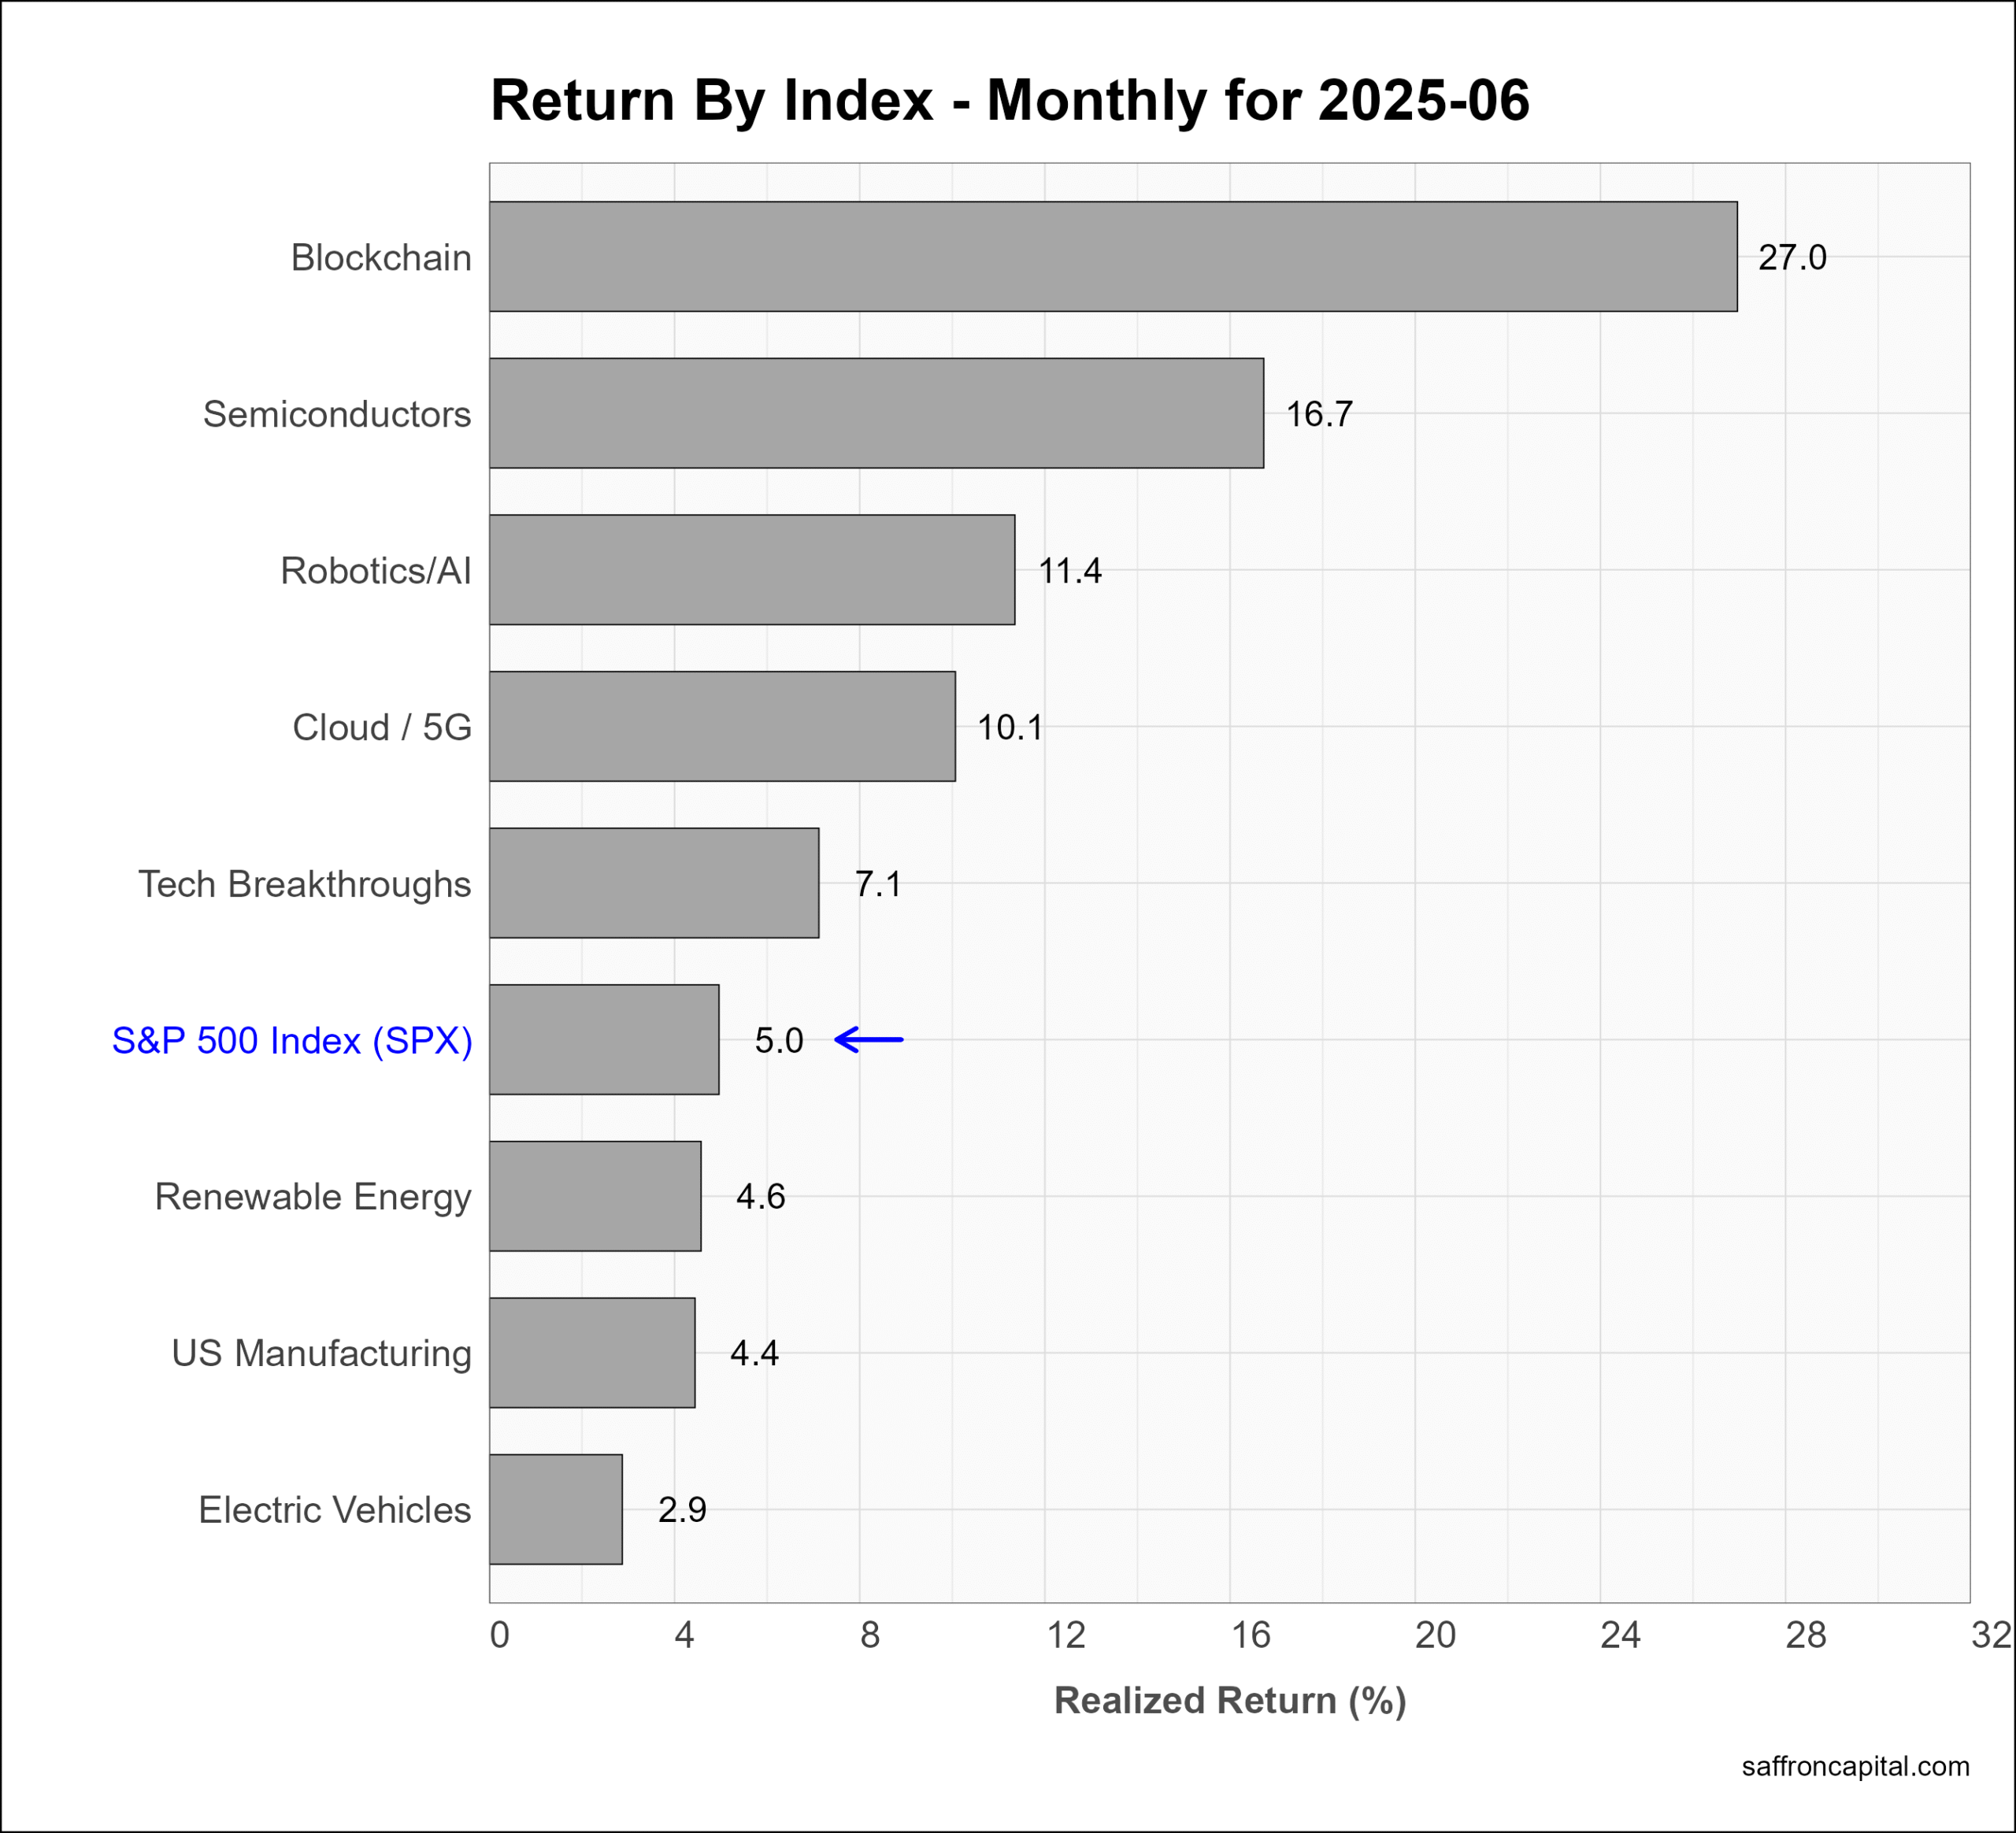
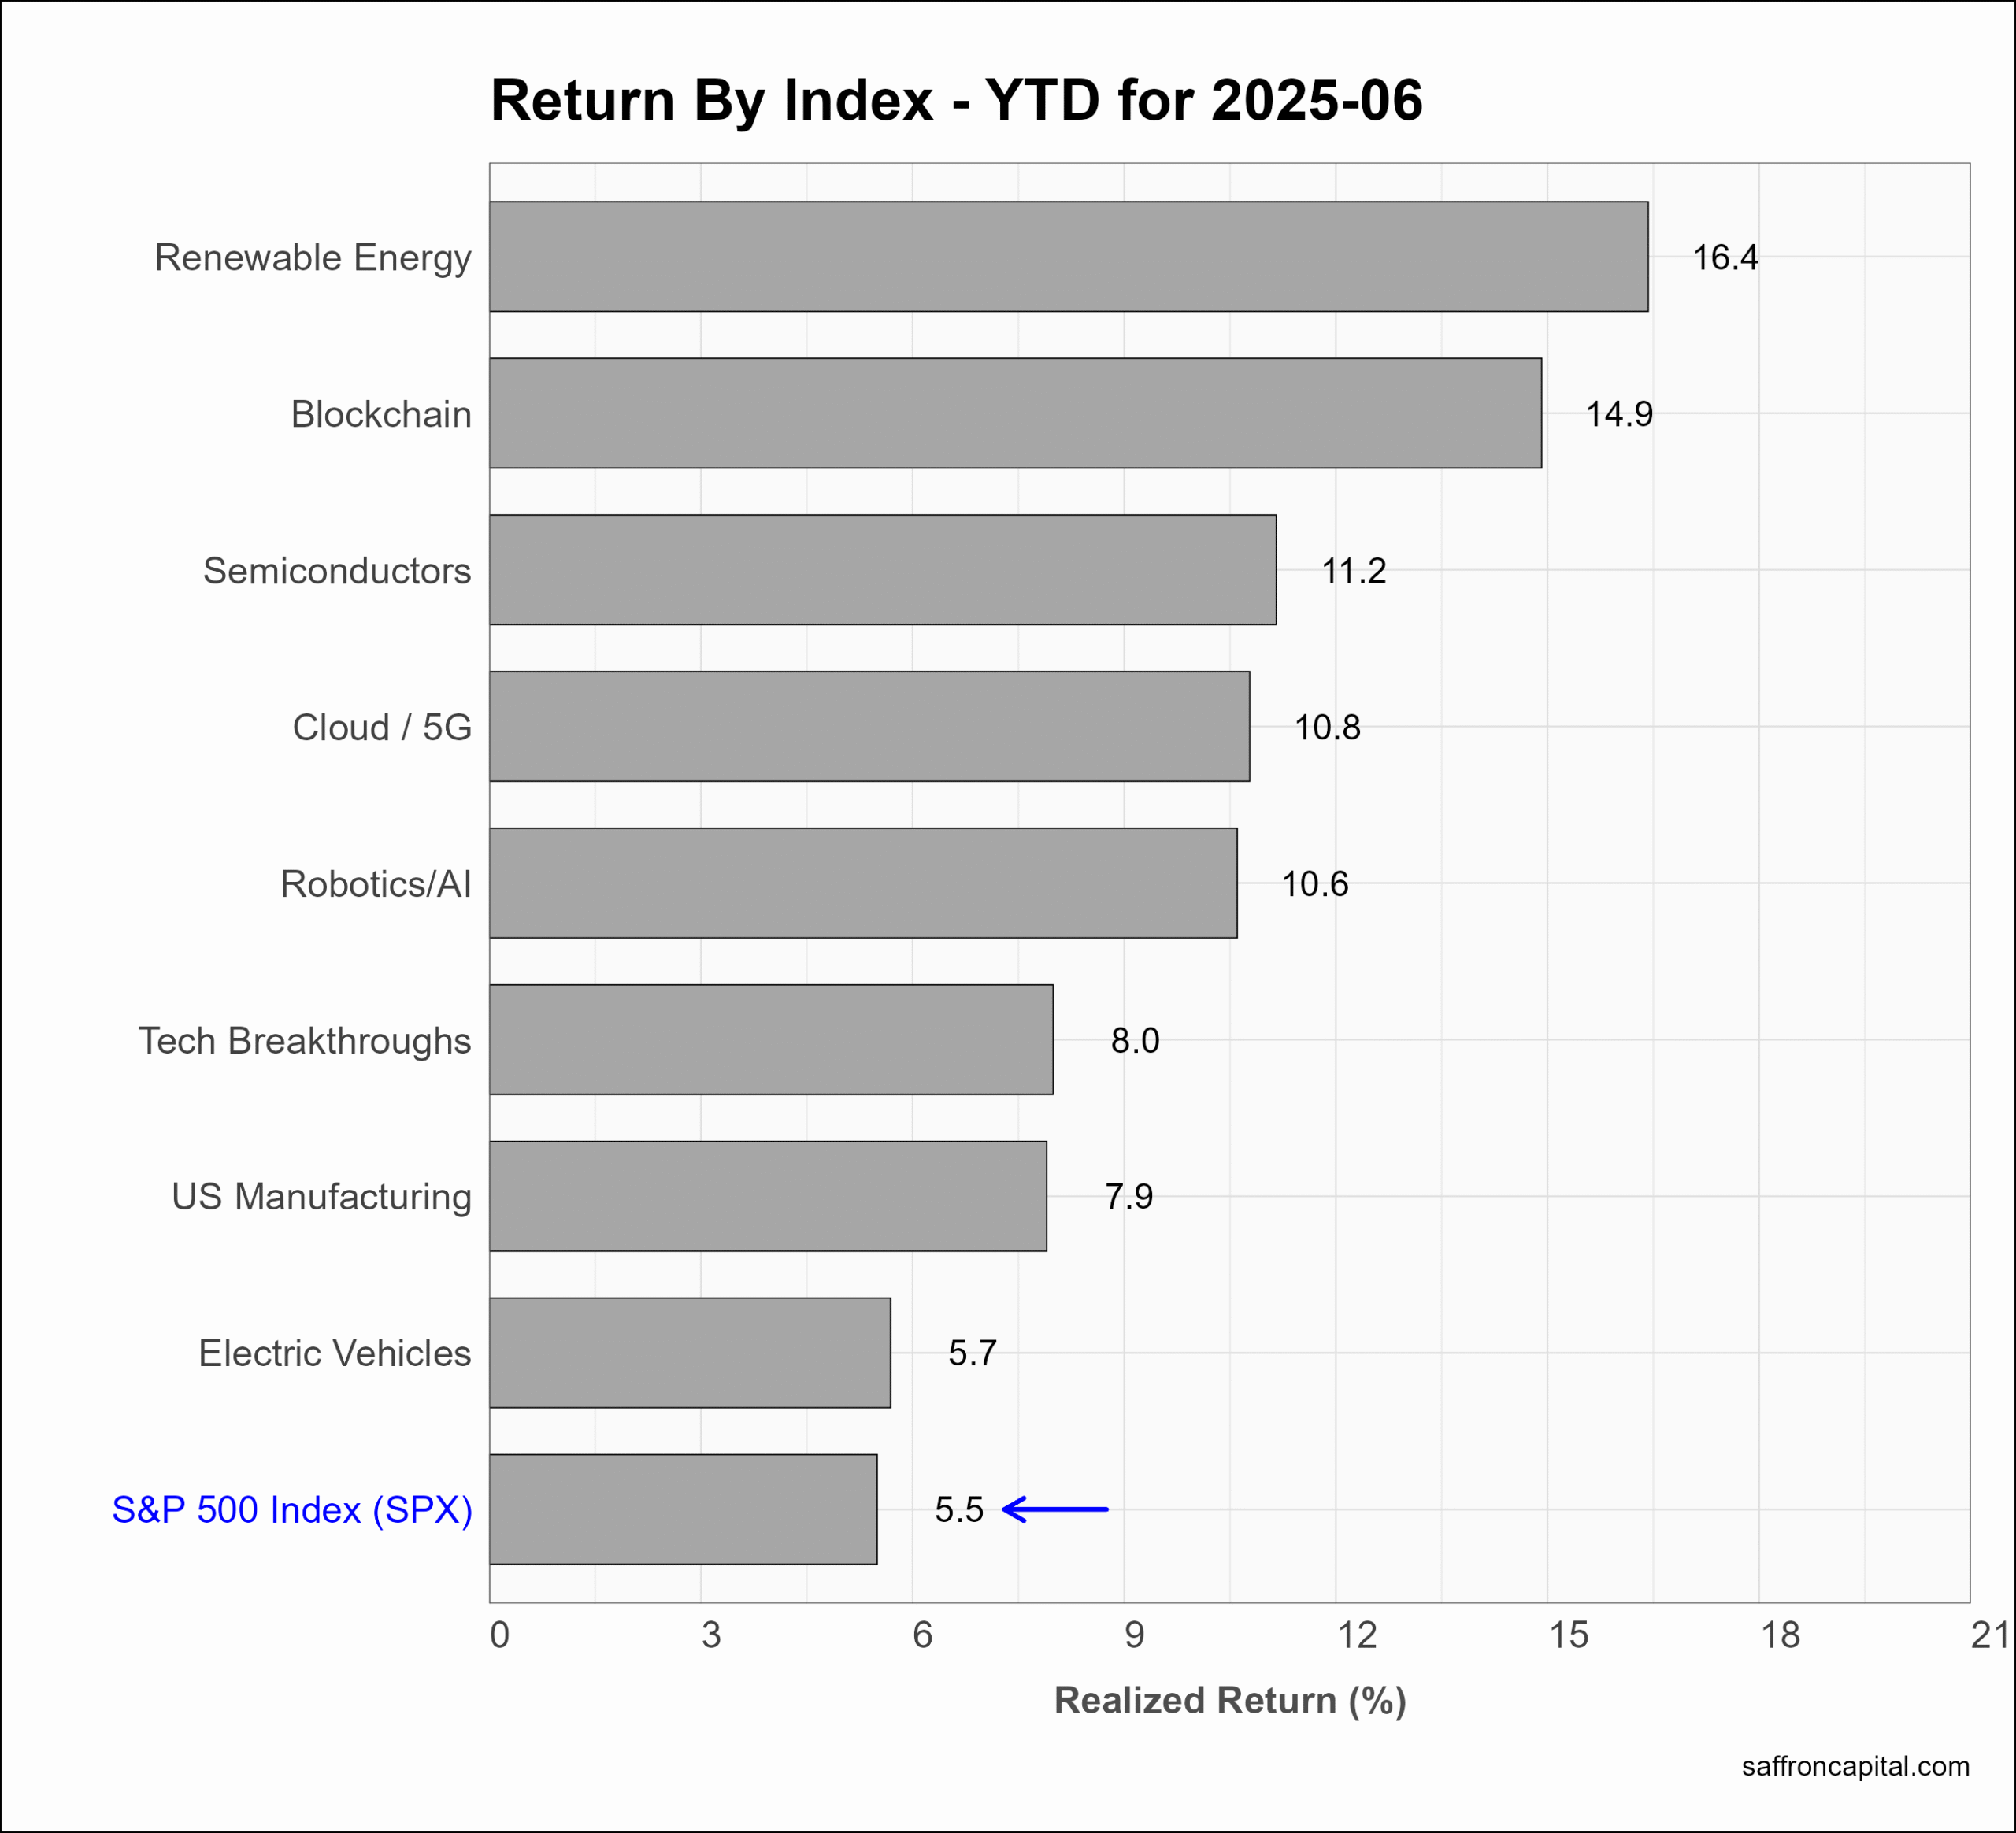
US thematic portfolios are portfolios that seek to capture the primary growth trends of the U.S. economy. June returns were led by Blockchain shares (+27.0%), Semiconductors (+16.7%), Robotics/AI (+11.4%), and Cloud/5G (+10.1%). Year-to-date, Renewable Energy (+16.4%) has emerged as top portfolio, followed by Blockchain shares (+14.9%) and Semiconductors (+11.2%). At mid-year, all the thematic portfolios are outperforming the index.
Click to enlarge
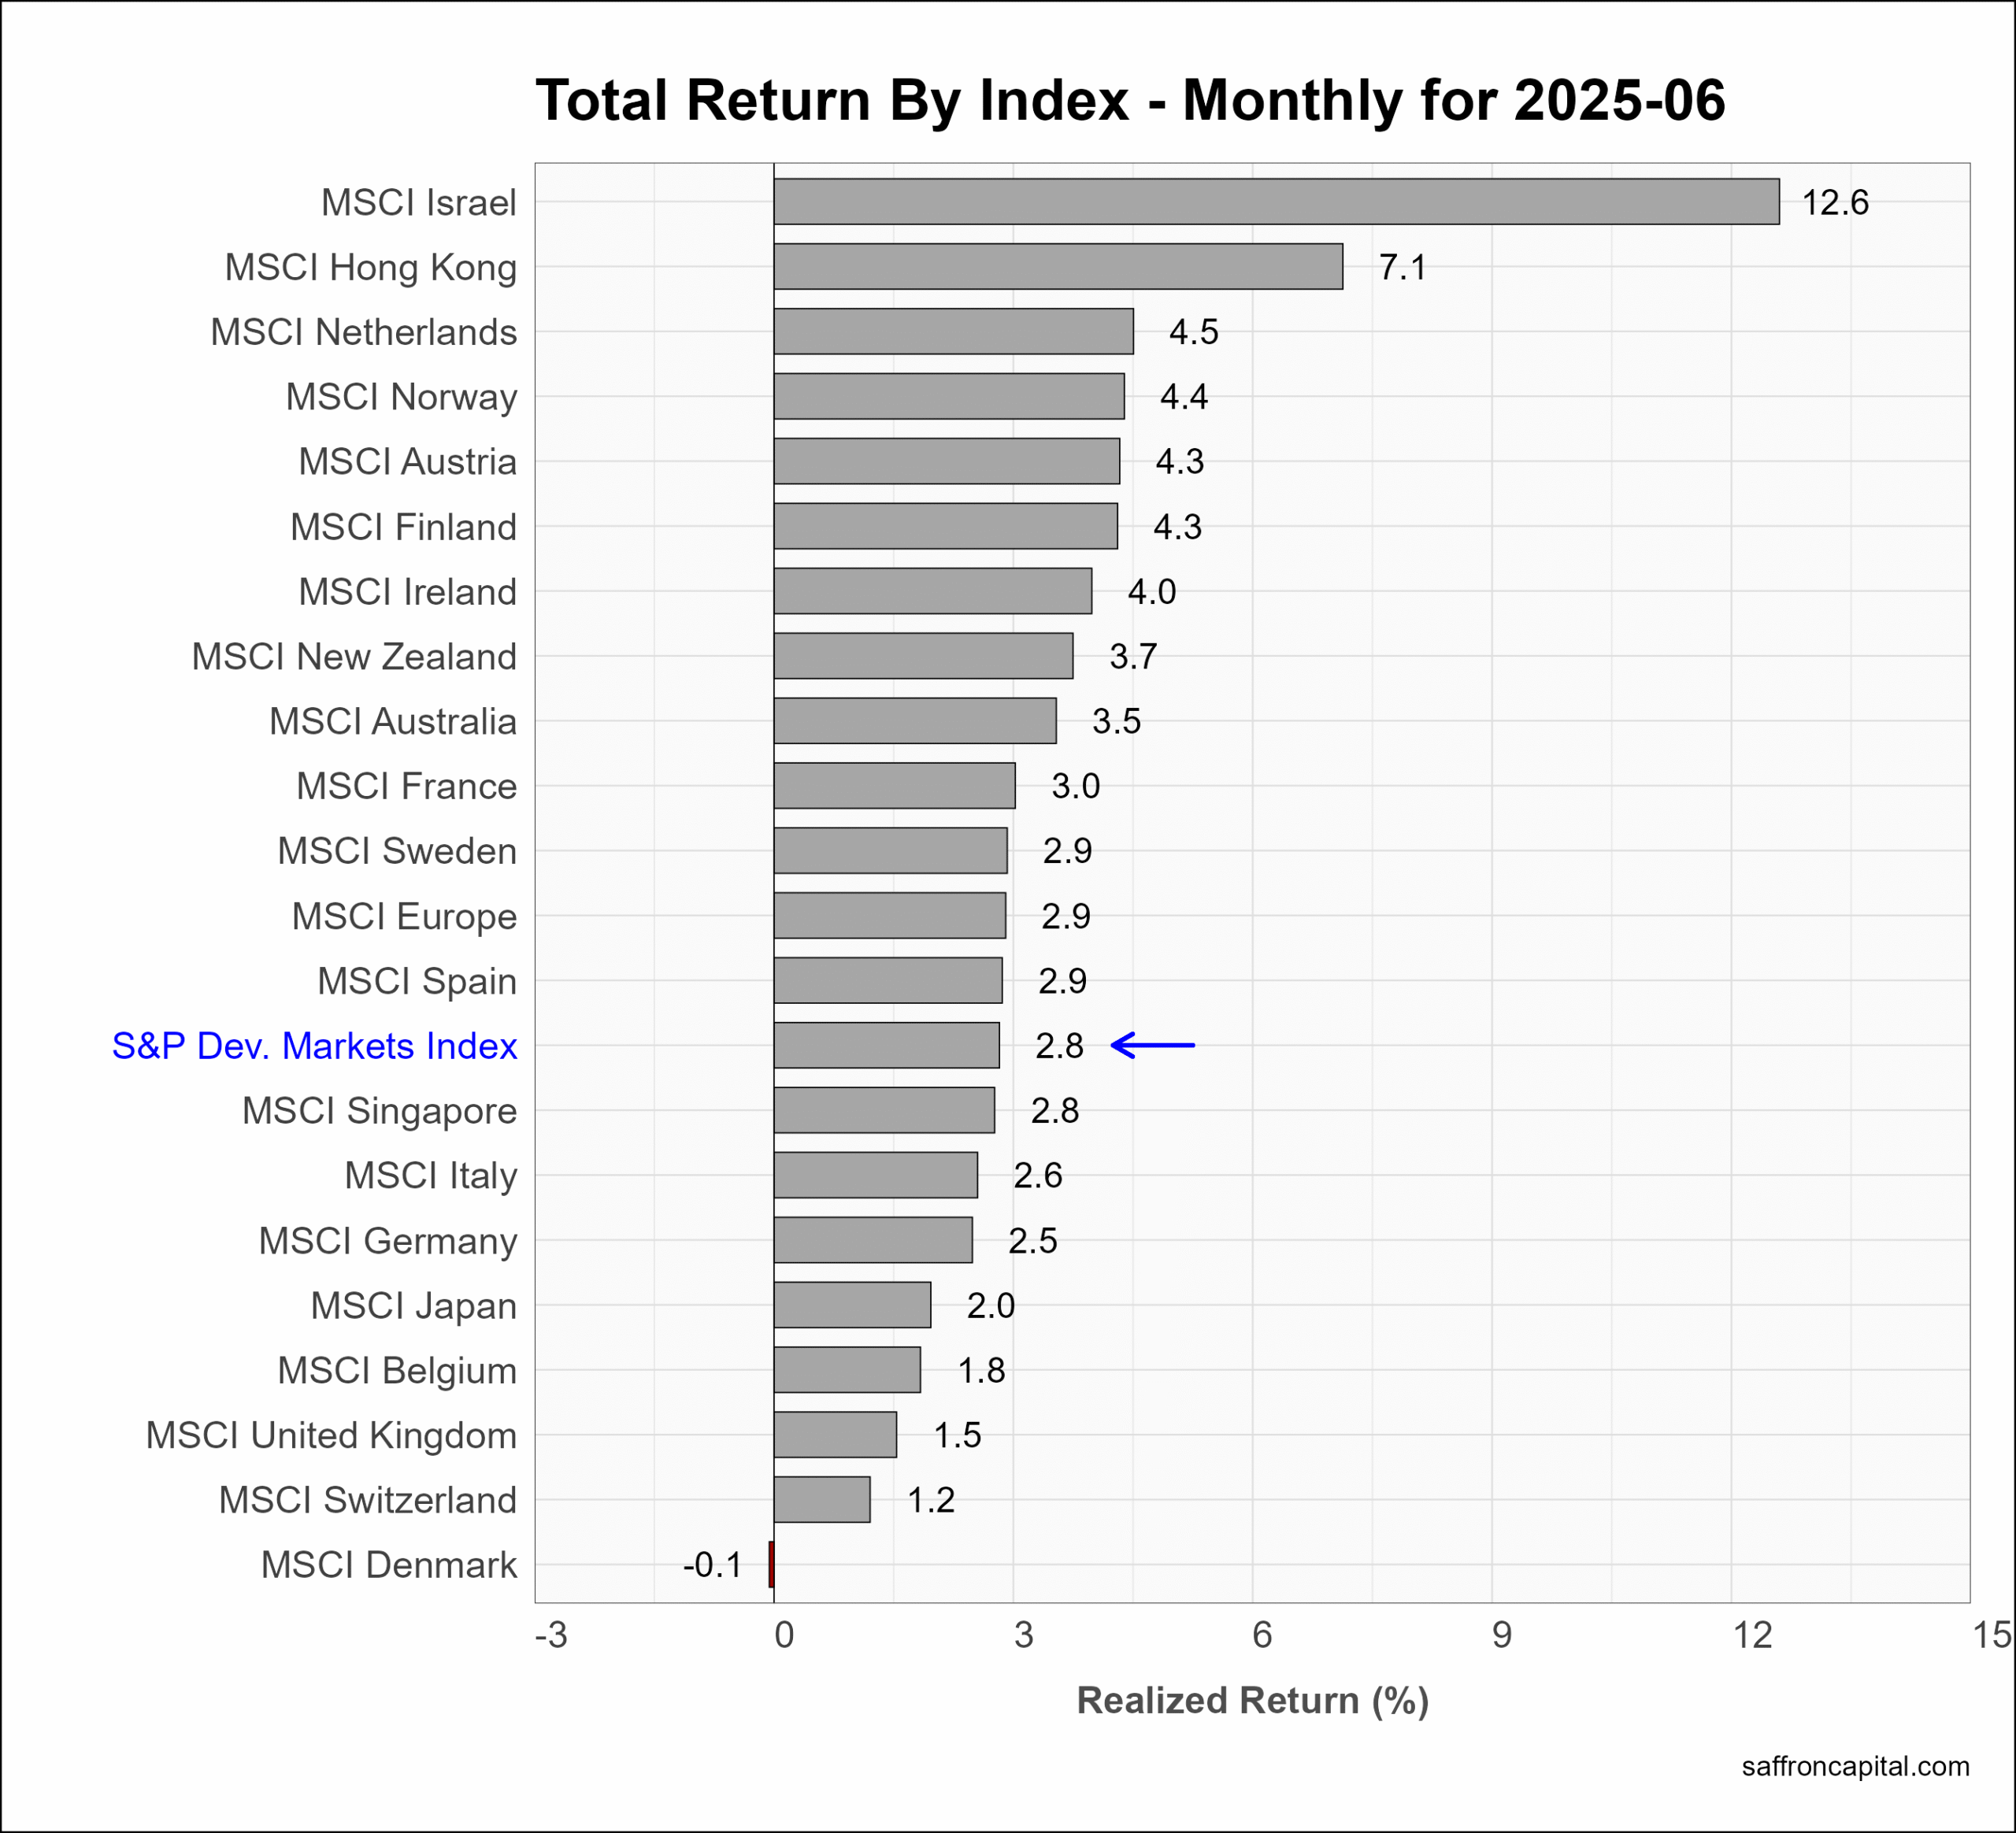
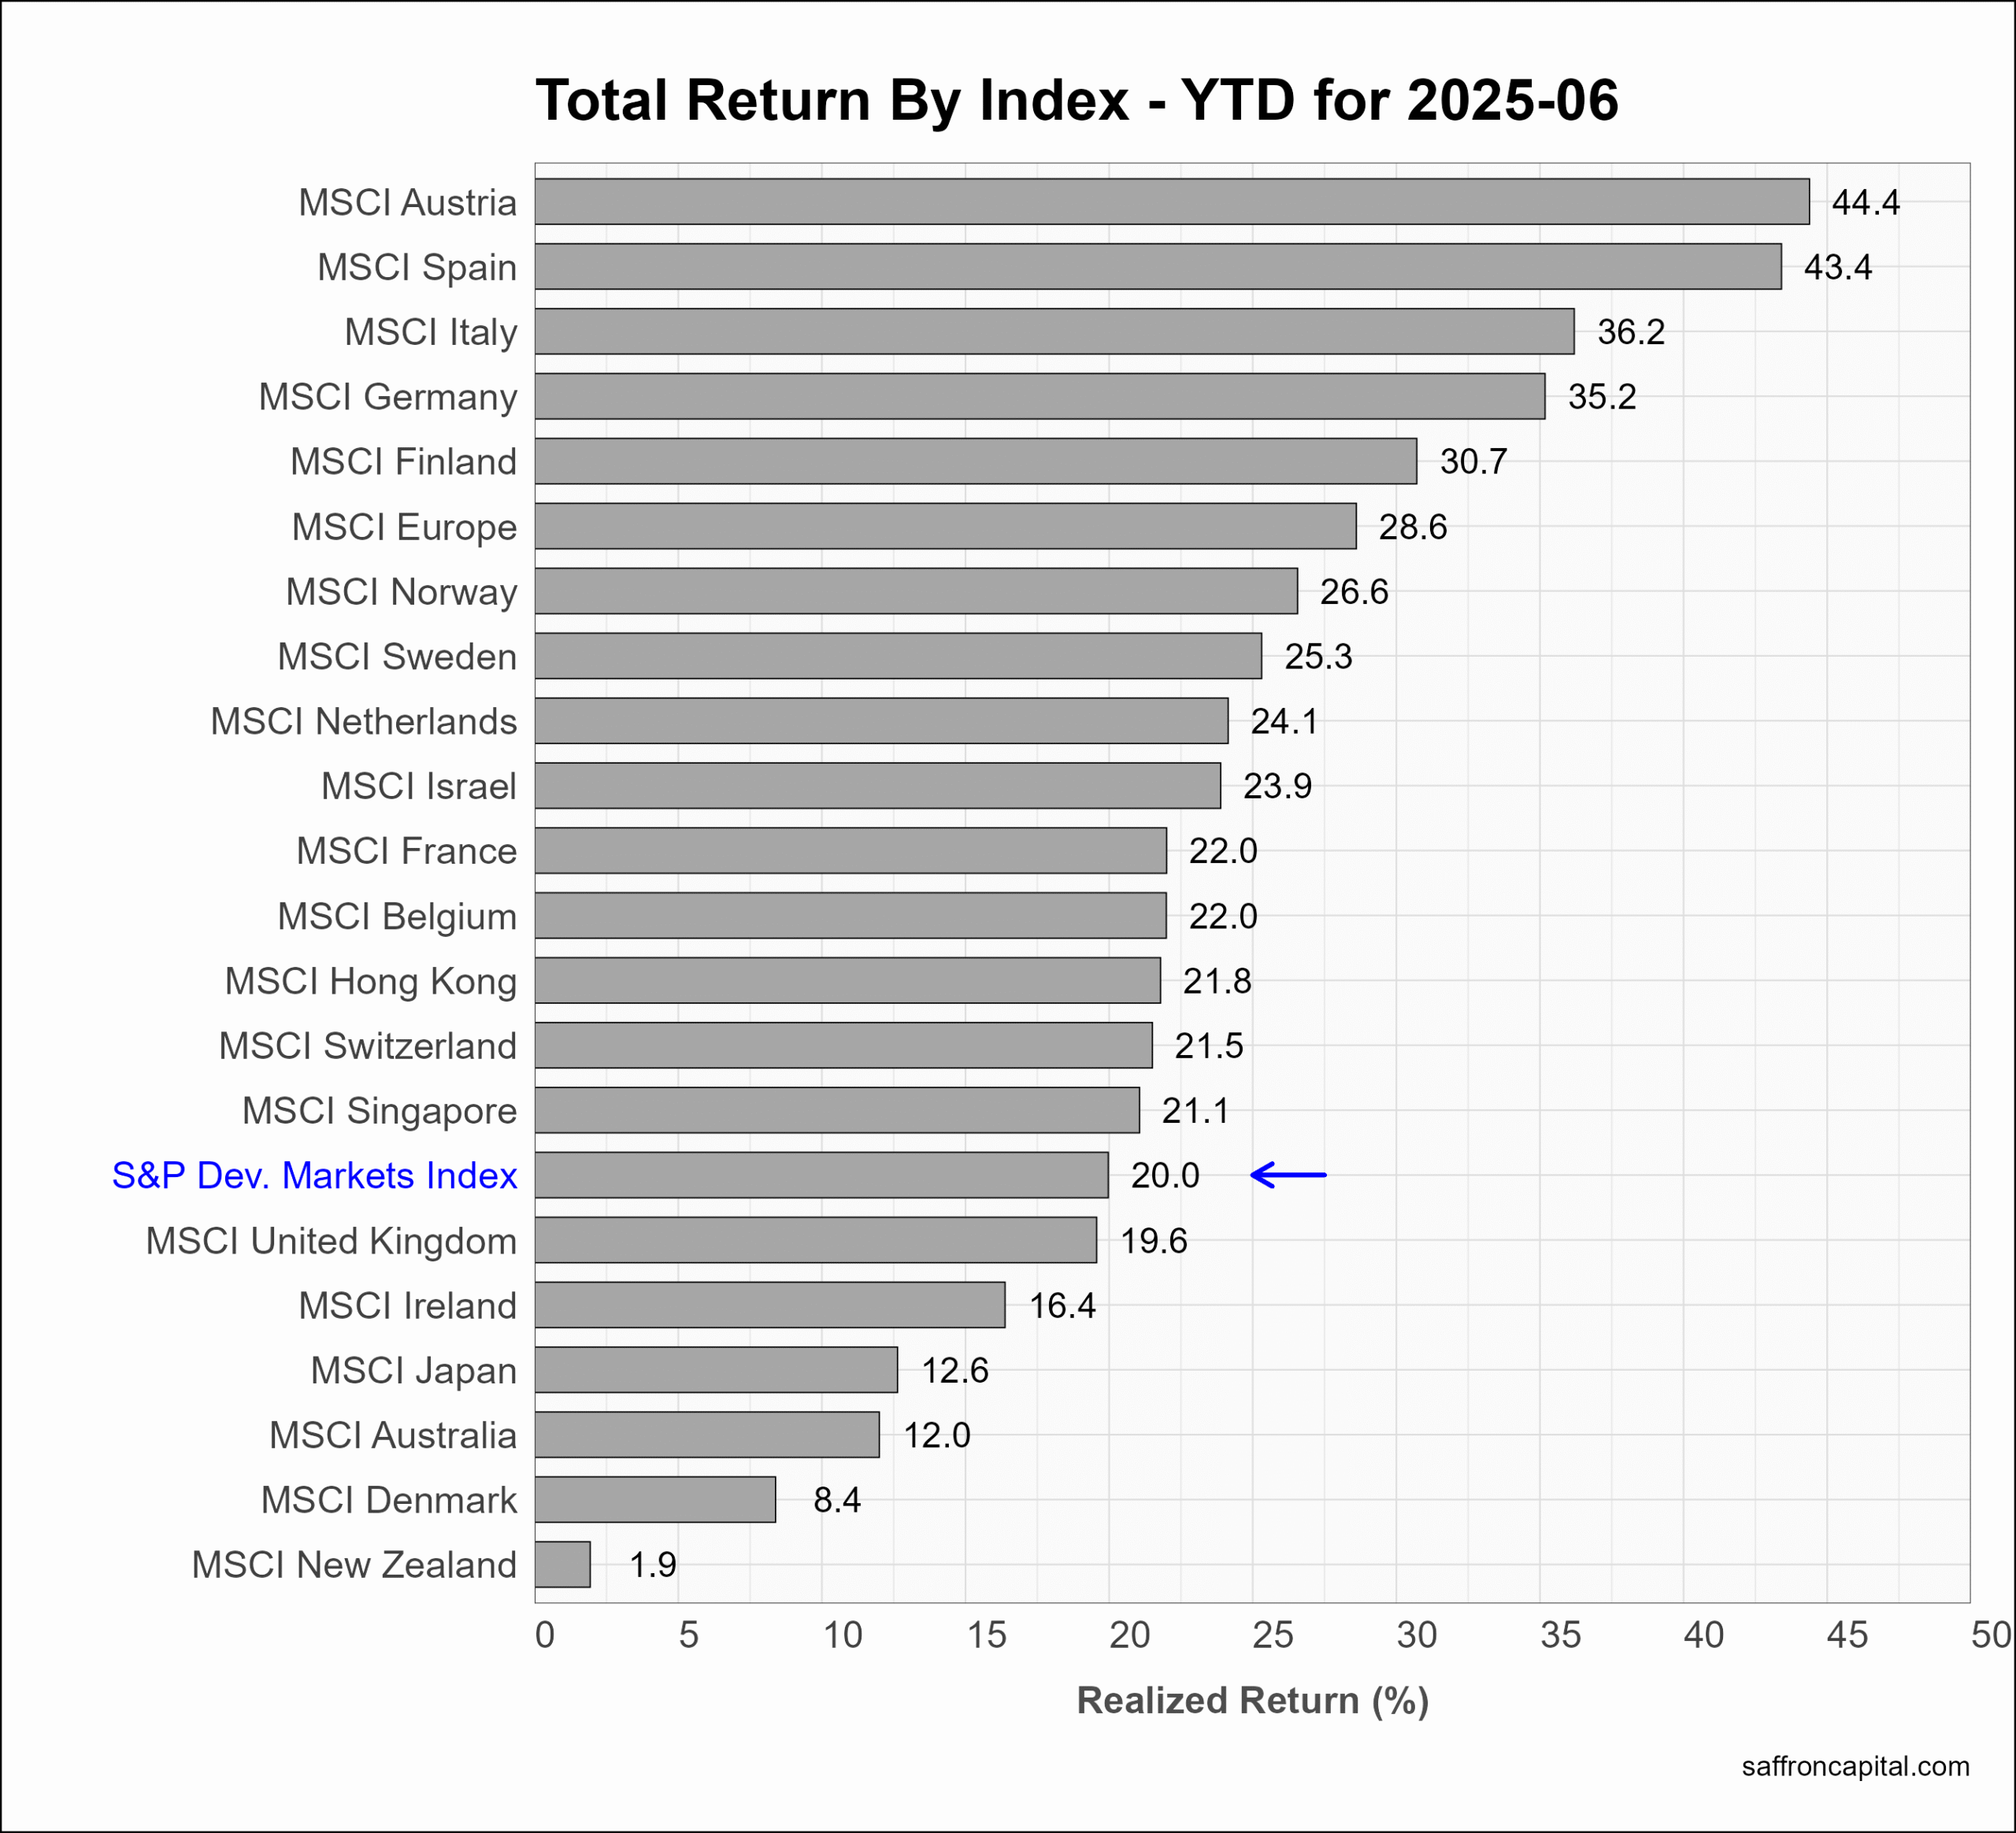
Developed Market Equities
International Developed Markets index (+2.8%) had modest relative returns in June. However, the MSCI Israel index (+12.6%) outperformed, along with Hong Kong (+7.1%). European shares (+1.9%) lagged the US, as did Japan (+2.0%). Since December, the Developed markets index (+20.0%) is significantly ahead of the US, led by Austria (+44.4%), Spain (+43.4%), and Italy (+36.2%).
Click to enlarge
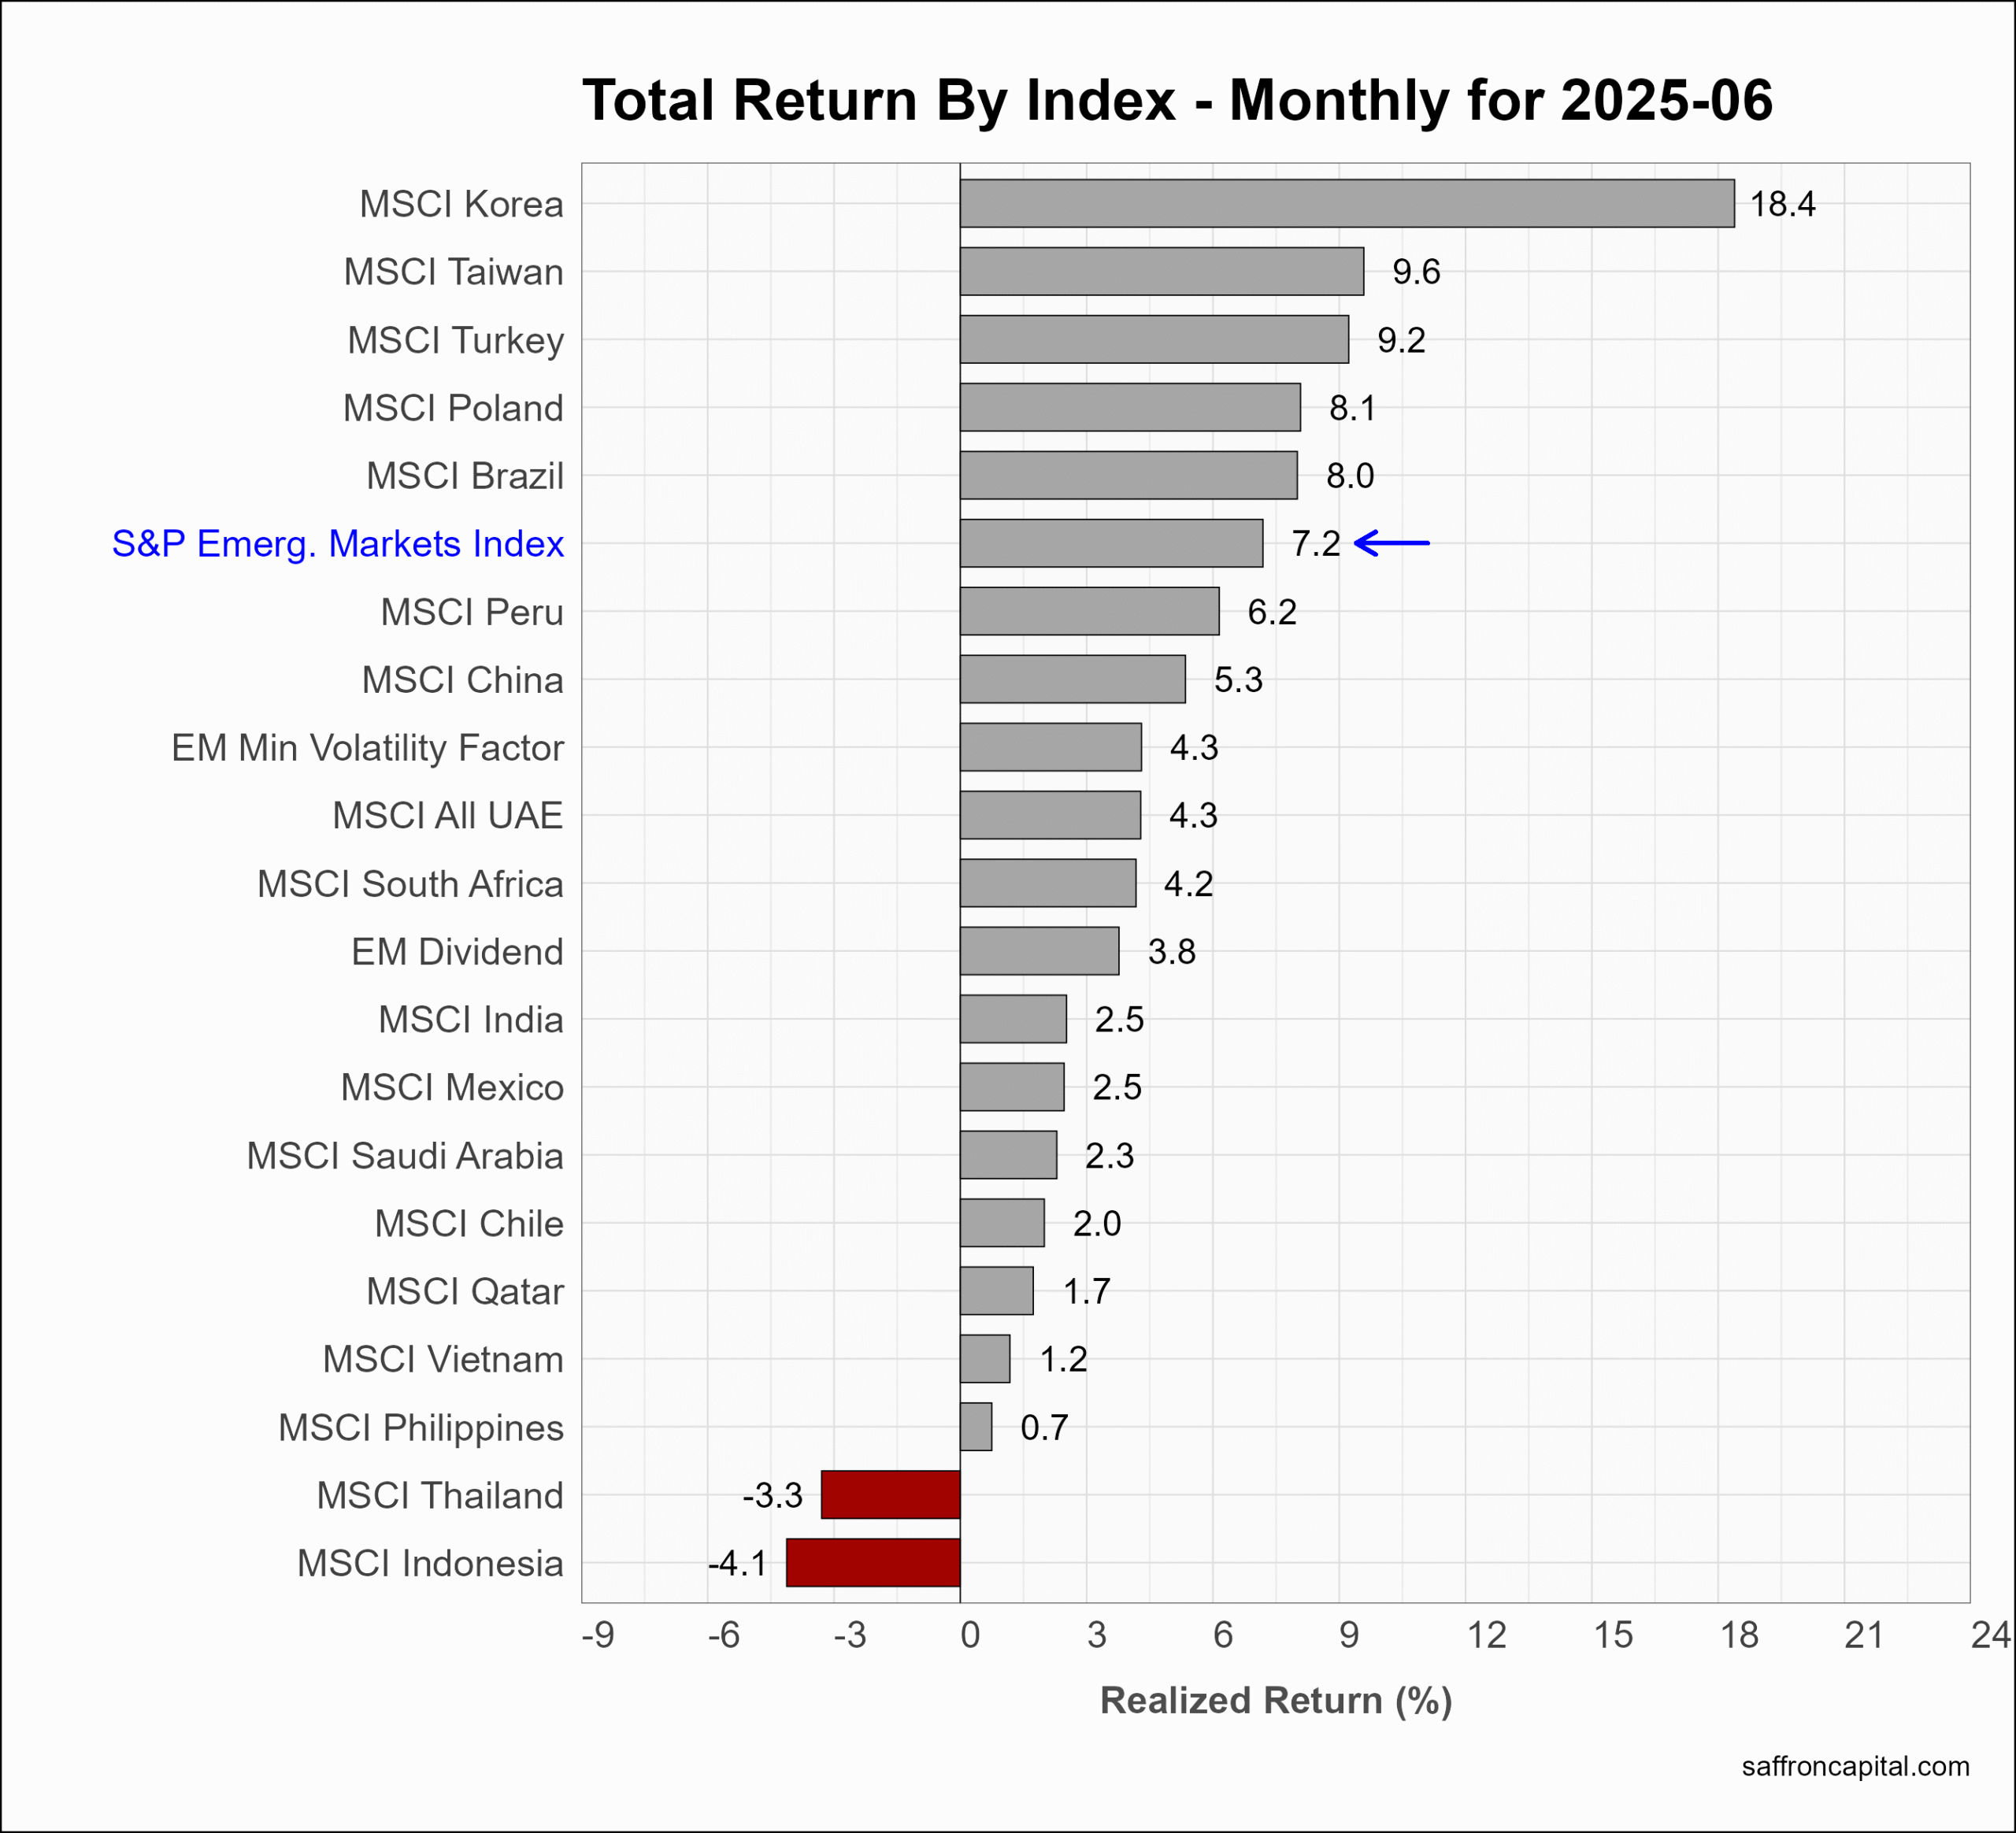
Emerging Market Equities
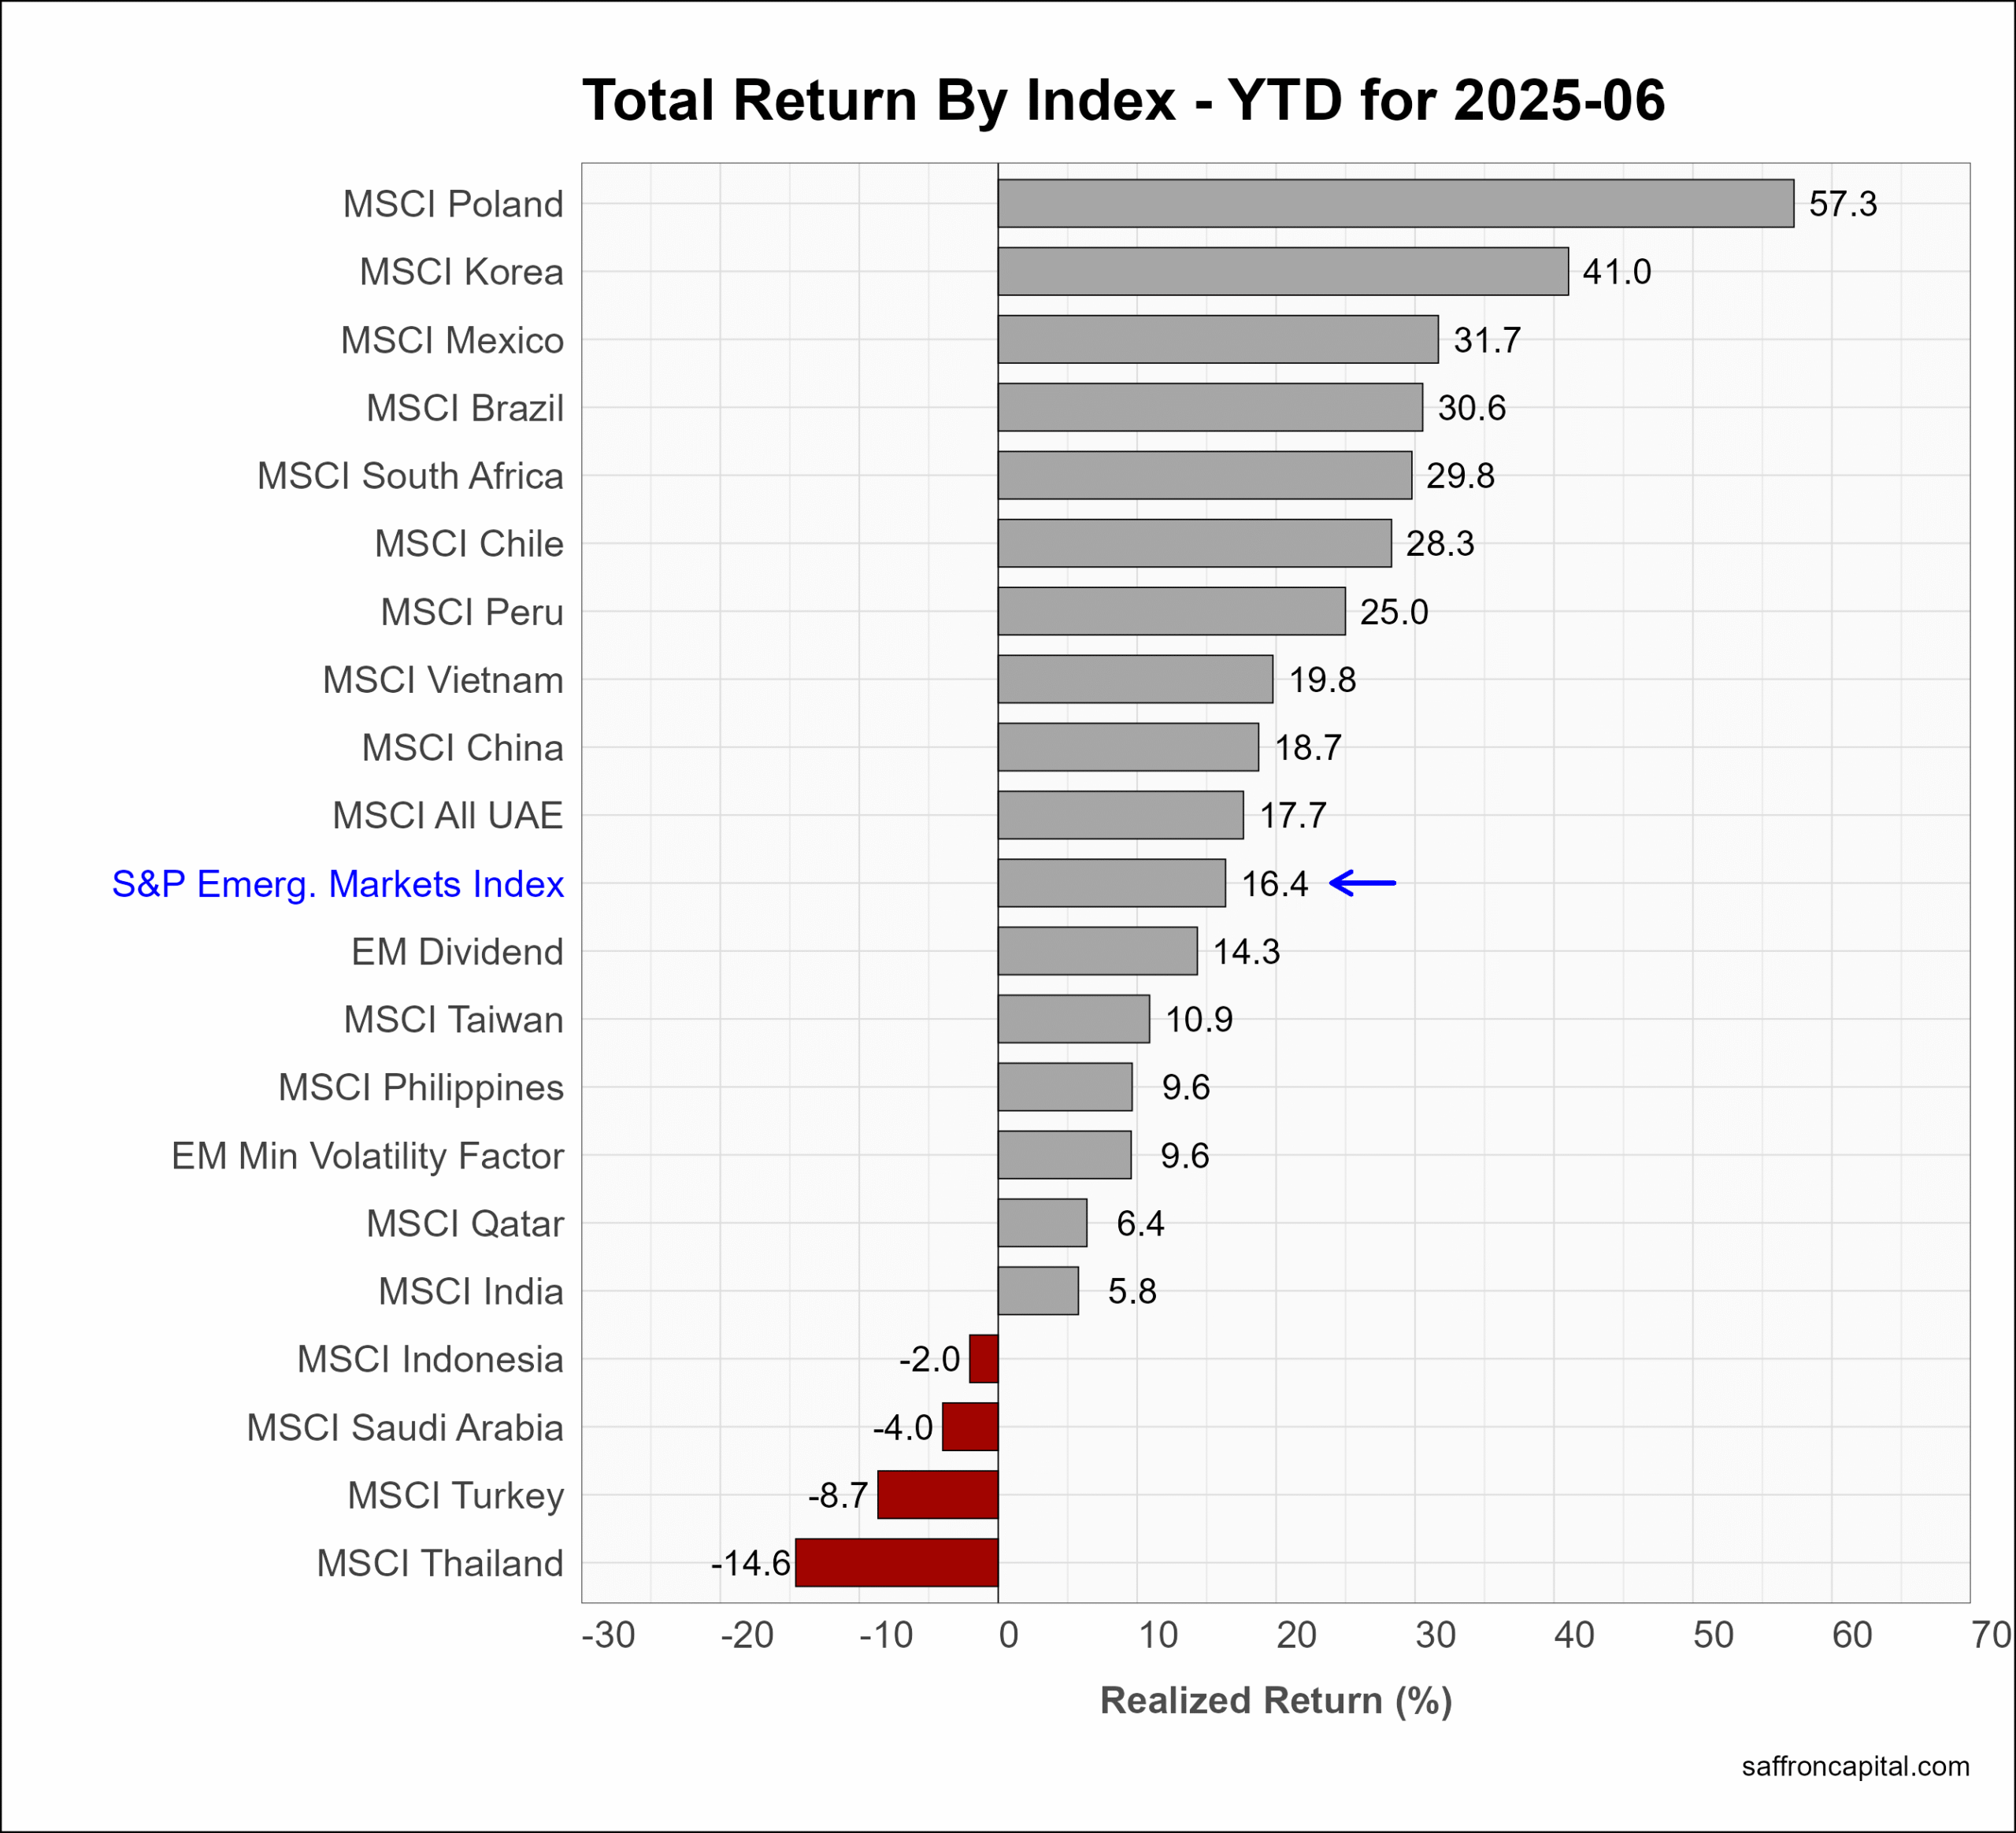
The S&P Emerging Markets Index (+7.2%) was the top performing asset group in June. Outsized returns were seen in Korea (18.4%), Taiwan (+9.6%), and Turkey (+9.2%), Poland (+8.1%), and Brazil (+8.0%). India (+2.5%) and Mexico (+2.5%) both lagged the group index in June. Over the first half, Poland (+57.3%) was the best performing market, followed by Korea (+41.0%) and Mexico (+31.7%).
Click to enlarge
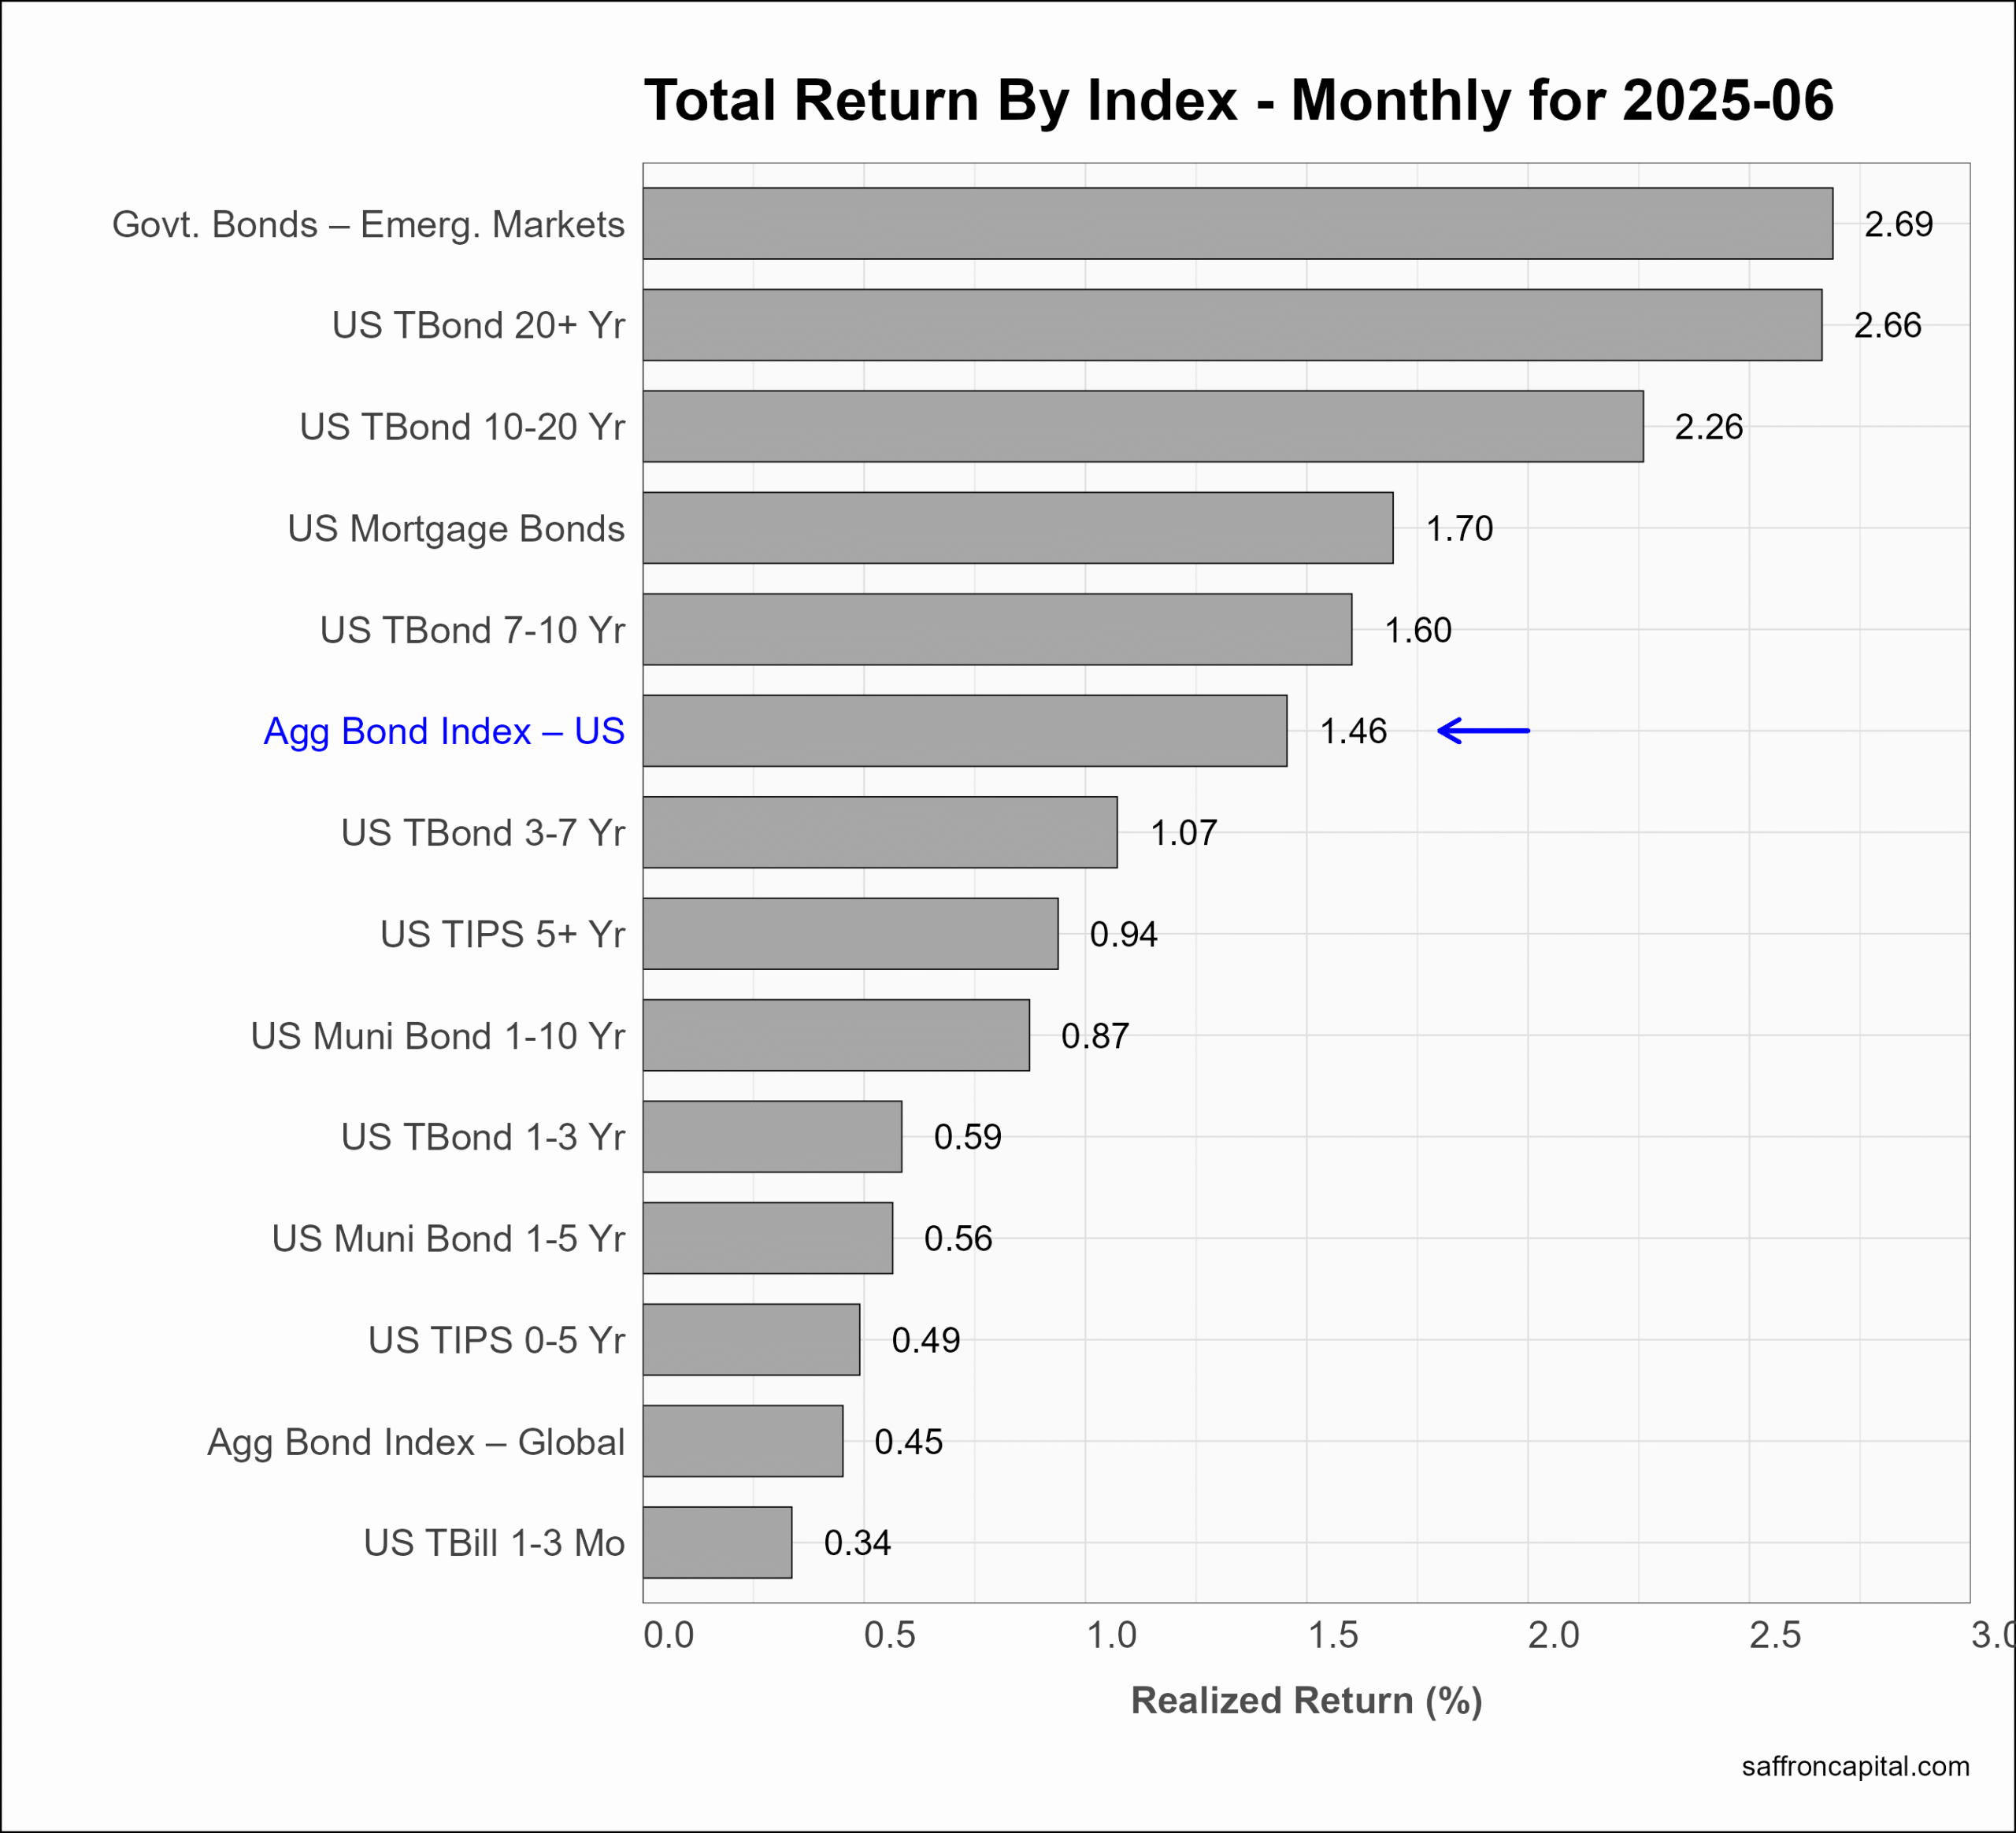
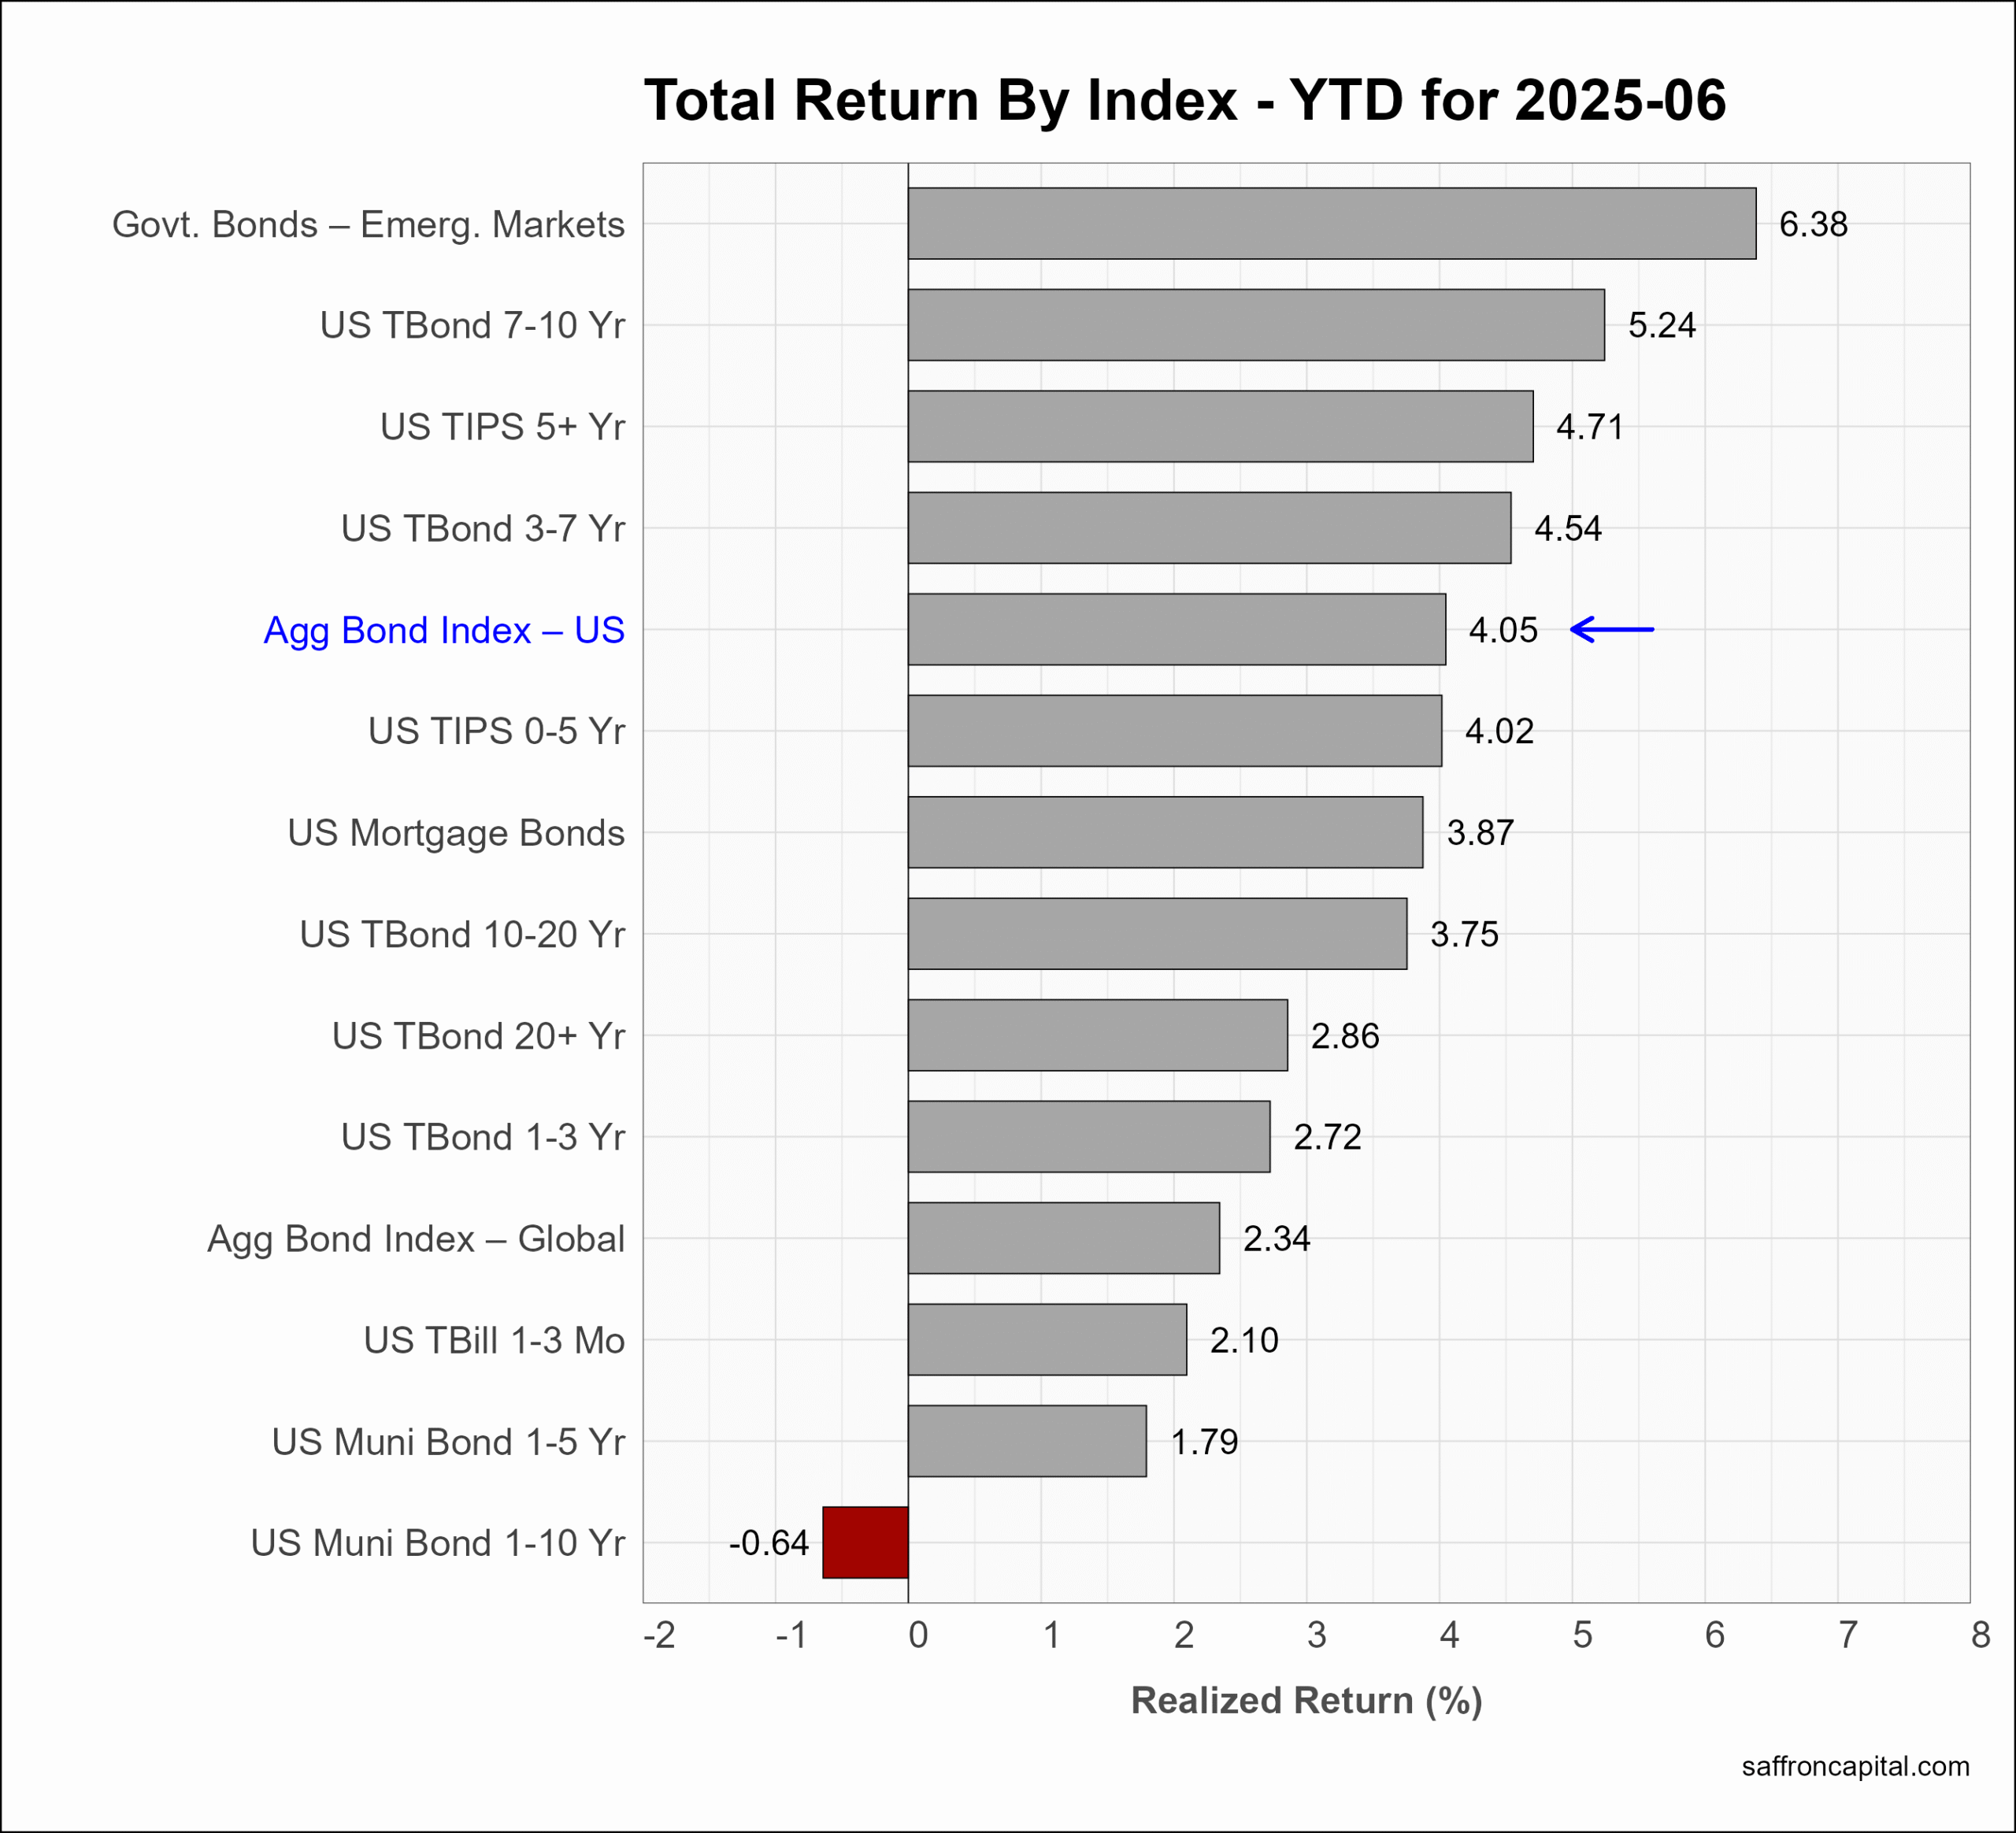
Government Bonds
During June, the yield-to-maturity on the 10-year Treasury Note spiked early to 4.52% before settling at 4.23%. As a result, the US Aggregate Bond Index (+1.46%) had modest gains tied to yield curve flattening. US long duration bonds (+2.66%). Emerging Market Government Bonds (+2.69%) also outperformed the Global Aggregate Bond Index (+0.45%). Year-to-date, the Aggregate Bond Index (+4.05%) has given up its return leadership to US equities.
Click to enlarge
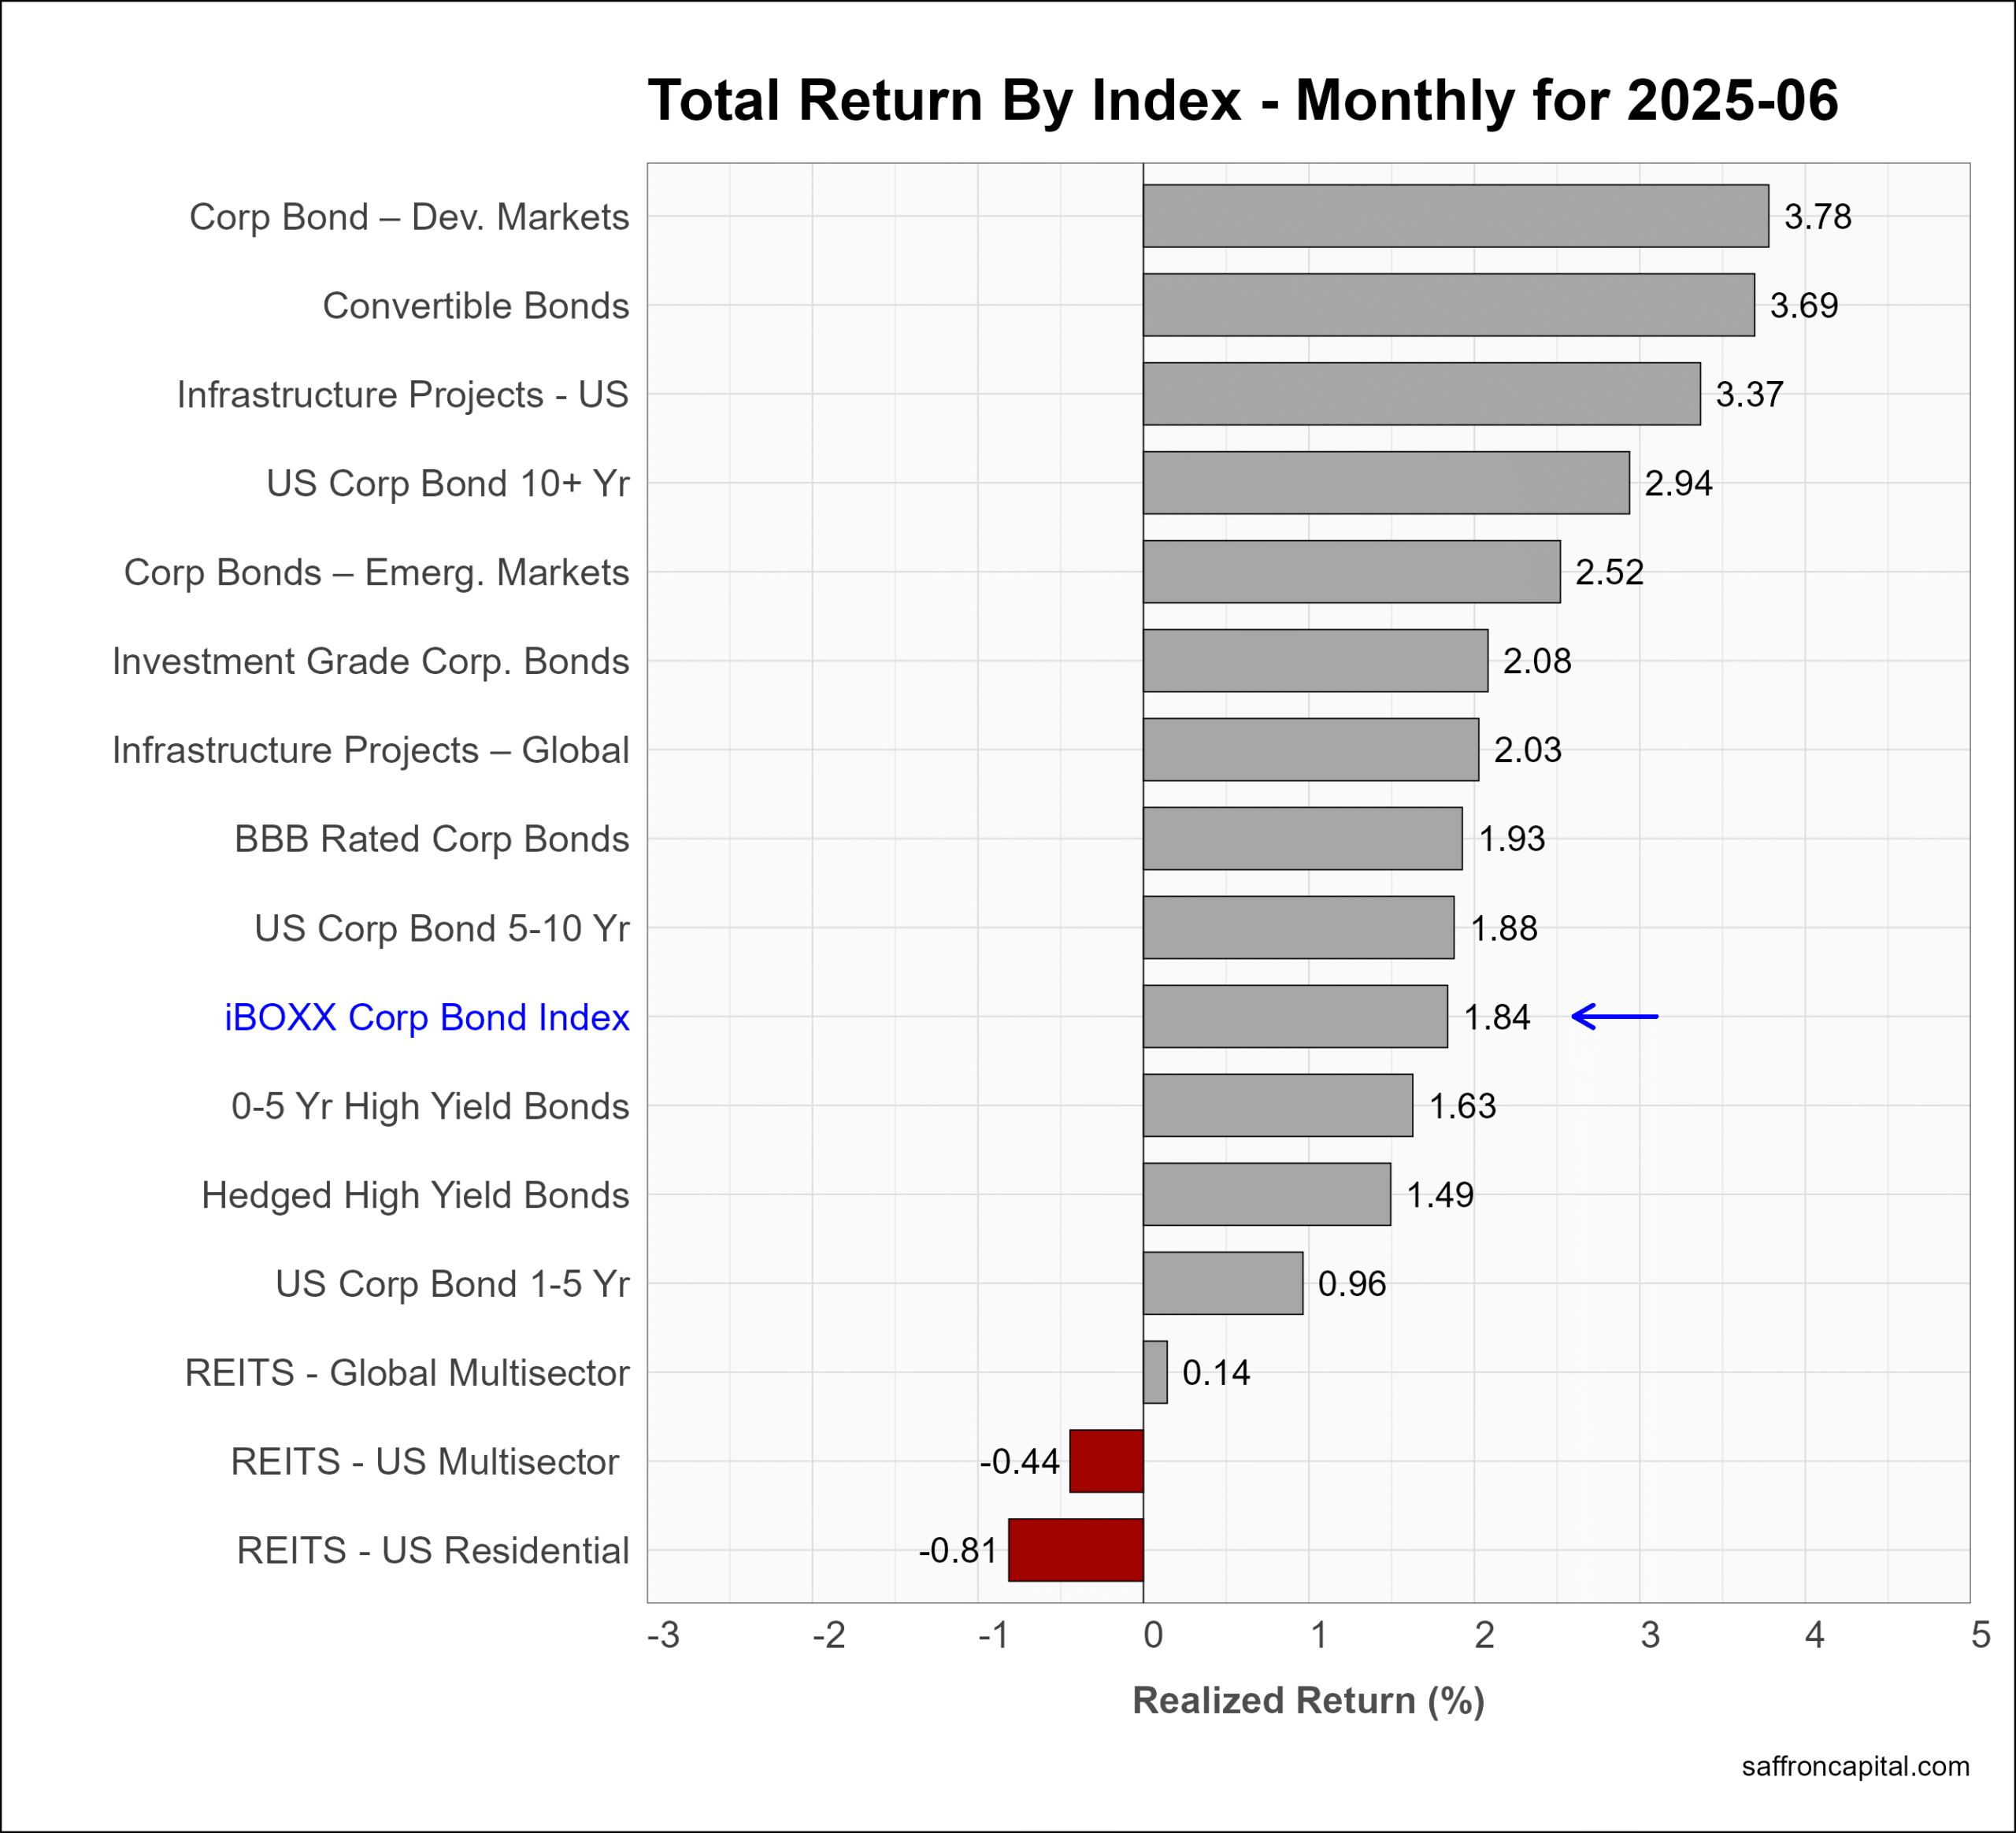
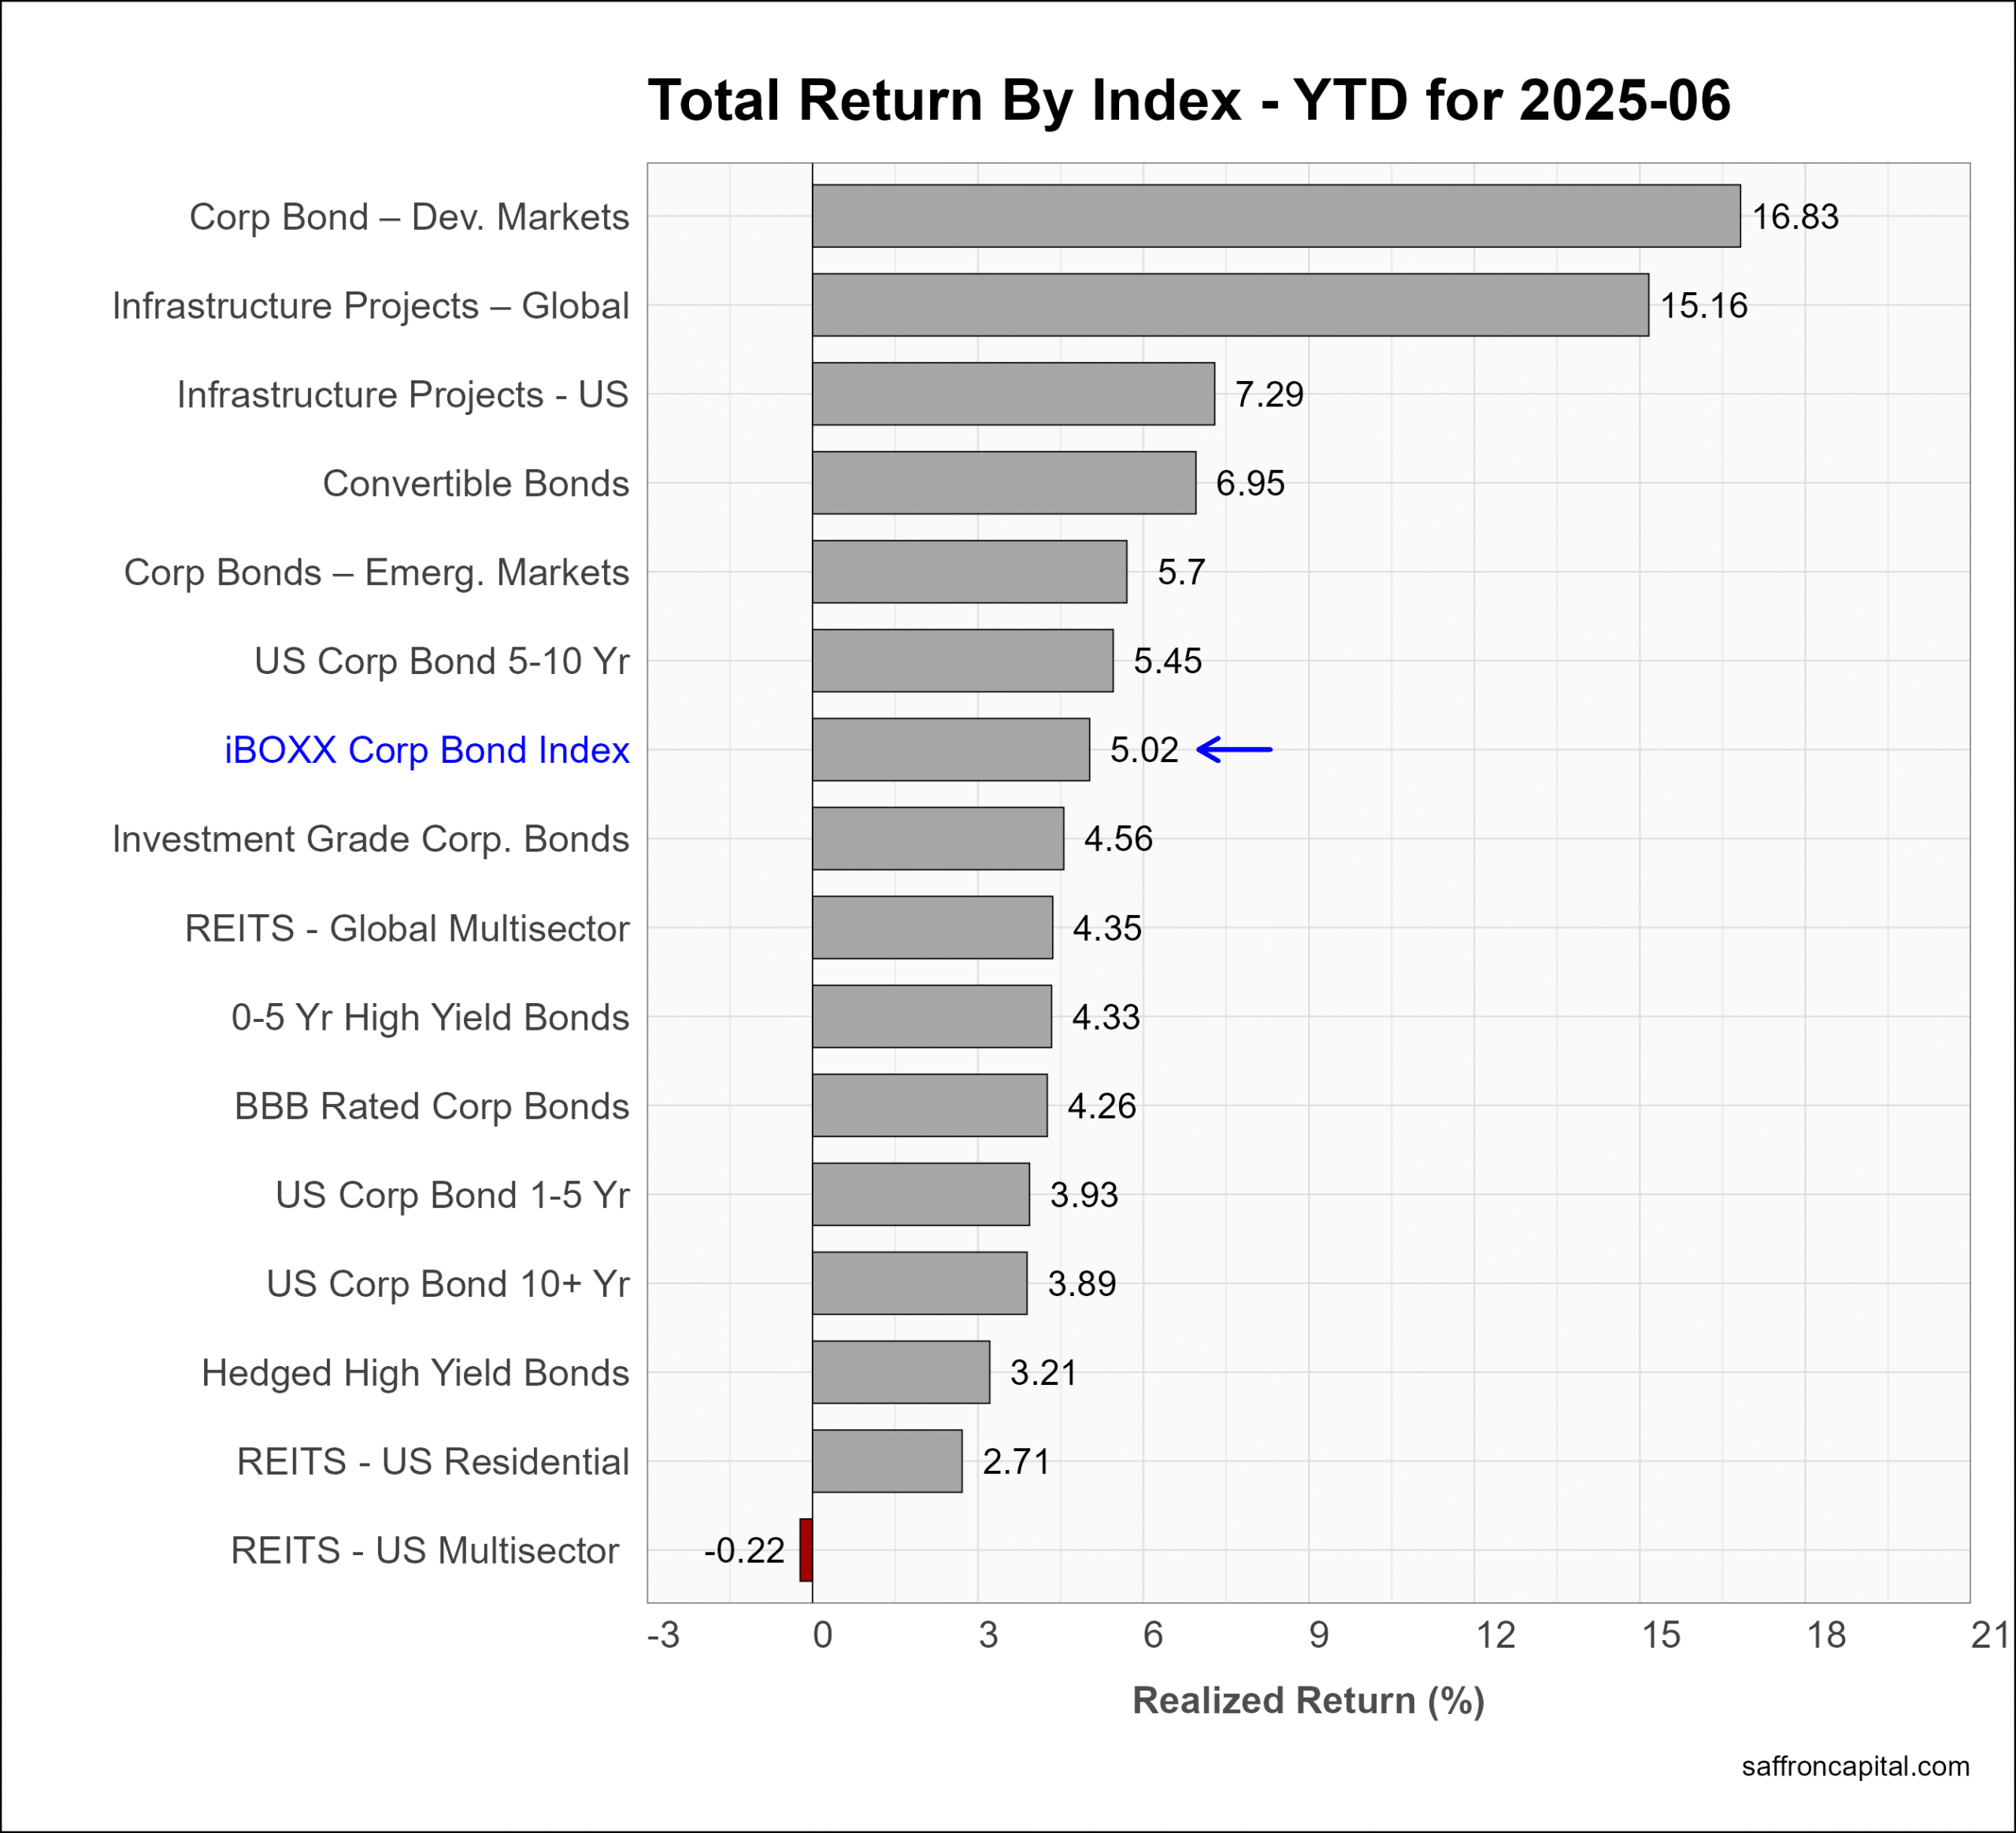
Corporate & Infrastructure Bonds
The iBoxx Corporate Bond Index (+1.84%) outperformed the US Treasury aggregate index in June. Developed market corporate bonds (+3.76%) topped the leader board, followed by Convertible Bonds (+3.69%), and US Infrastructure Project Bonds (+3.37%). REITSs performed badly in June. Year-to-date, the group index (+5.02%) is flat to the performance of the S&P 500 index. Exceptional returns are tied to Developed market corporate bonds (+16.83%) and global infrastructure project bonds (+15.16%) owing to more flexible central bank policies.
Click to enlarge
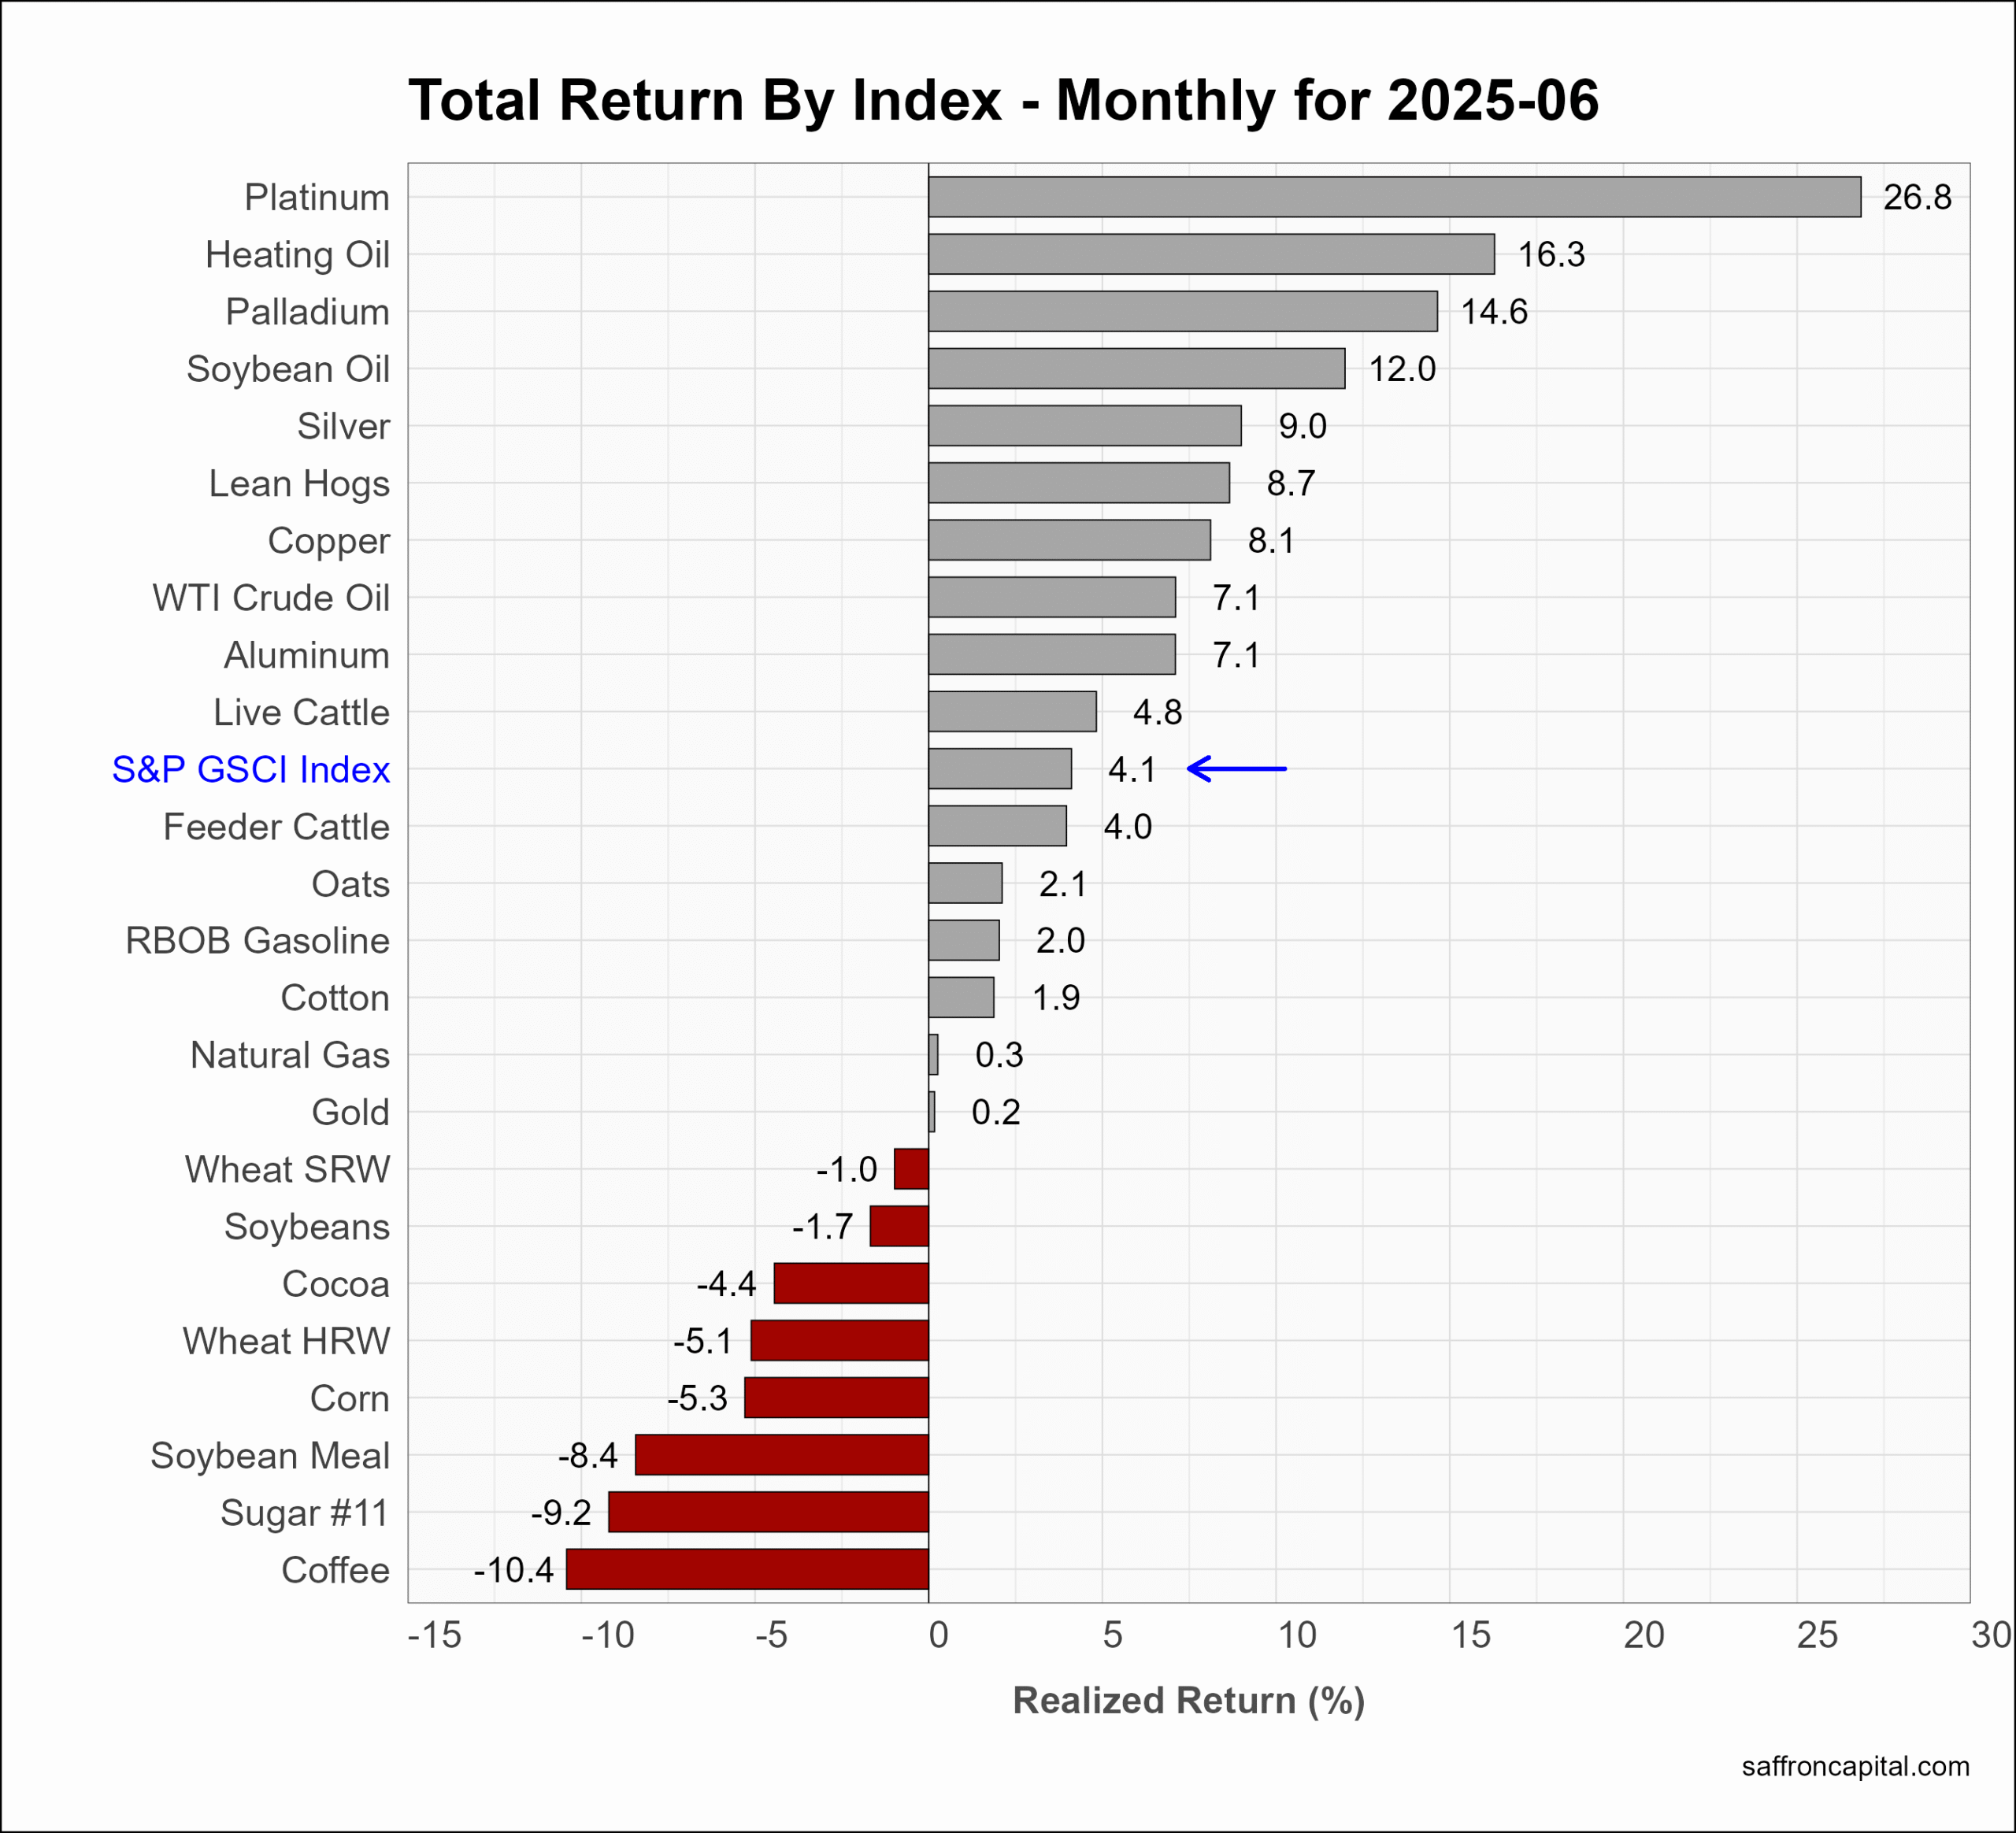
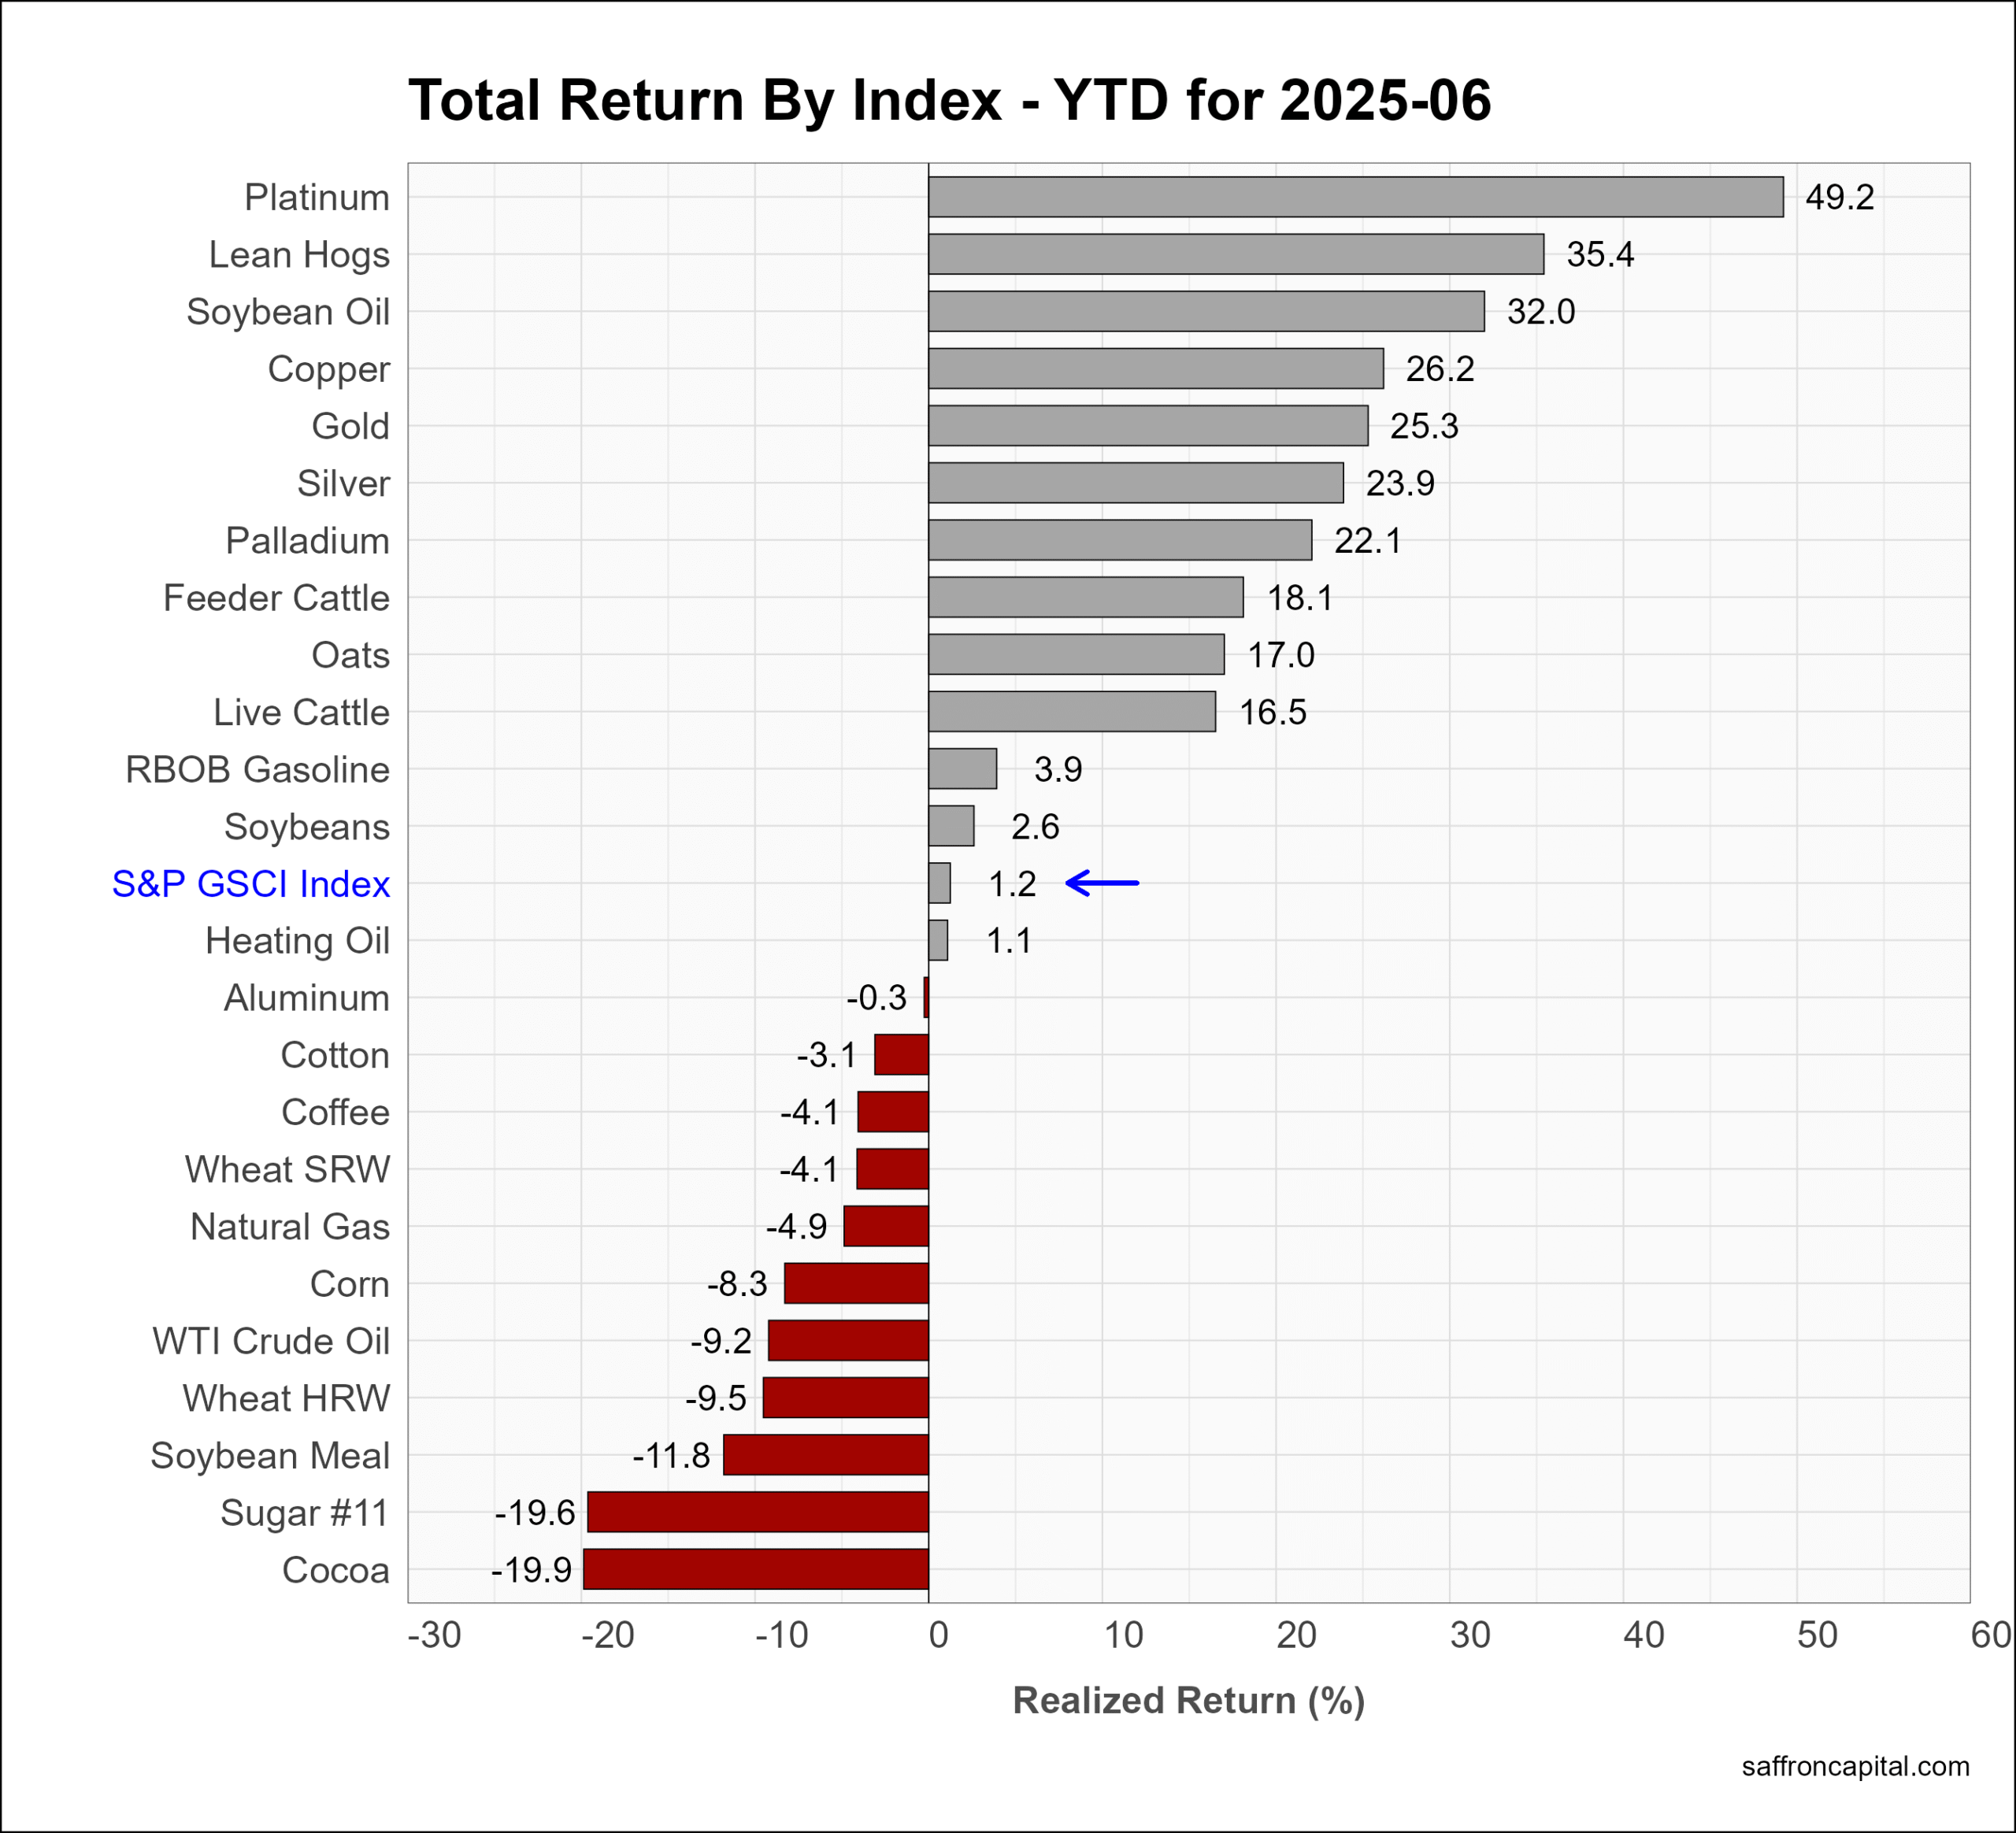
Commodities
Commodities, as measured by the S&P GS Commodity Index (+4.1%) was up in June. Platinum (26.8%) had its best rally in decades. Strong gains were also seen in Jet Fuel, which impacted Heating Oil (+16.3%) prices. Palladium (+14.6%) also benefited form the rally in platinum-group metals. Year-to-date, the commodity index (+1.2%) is up only modestly.
Click to enlarge
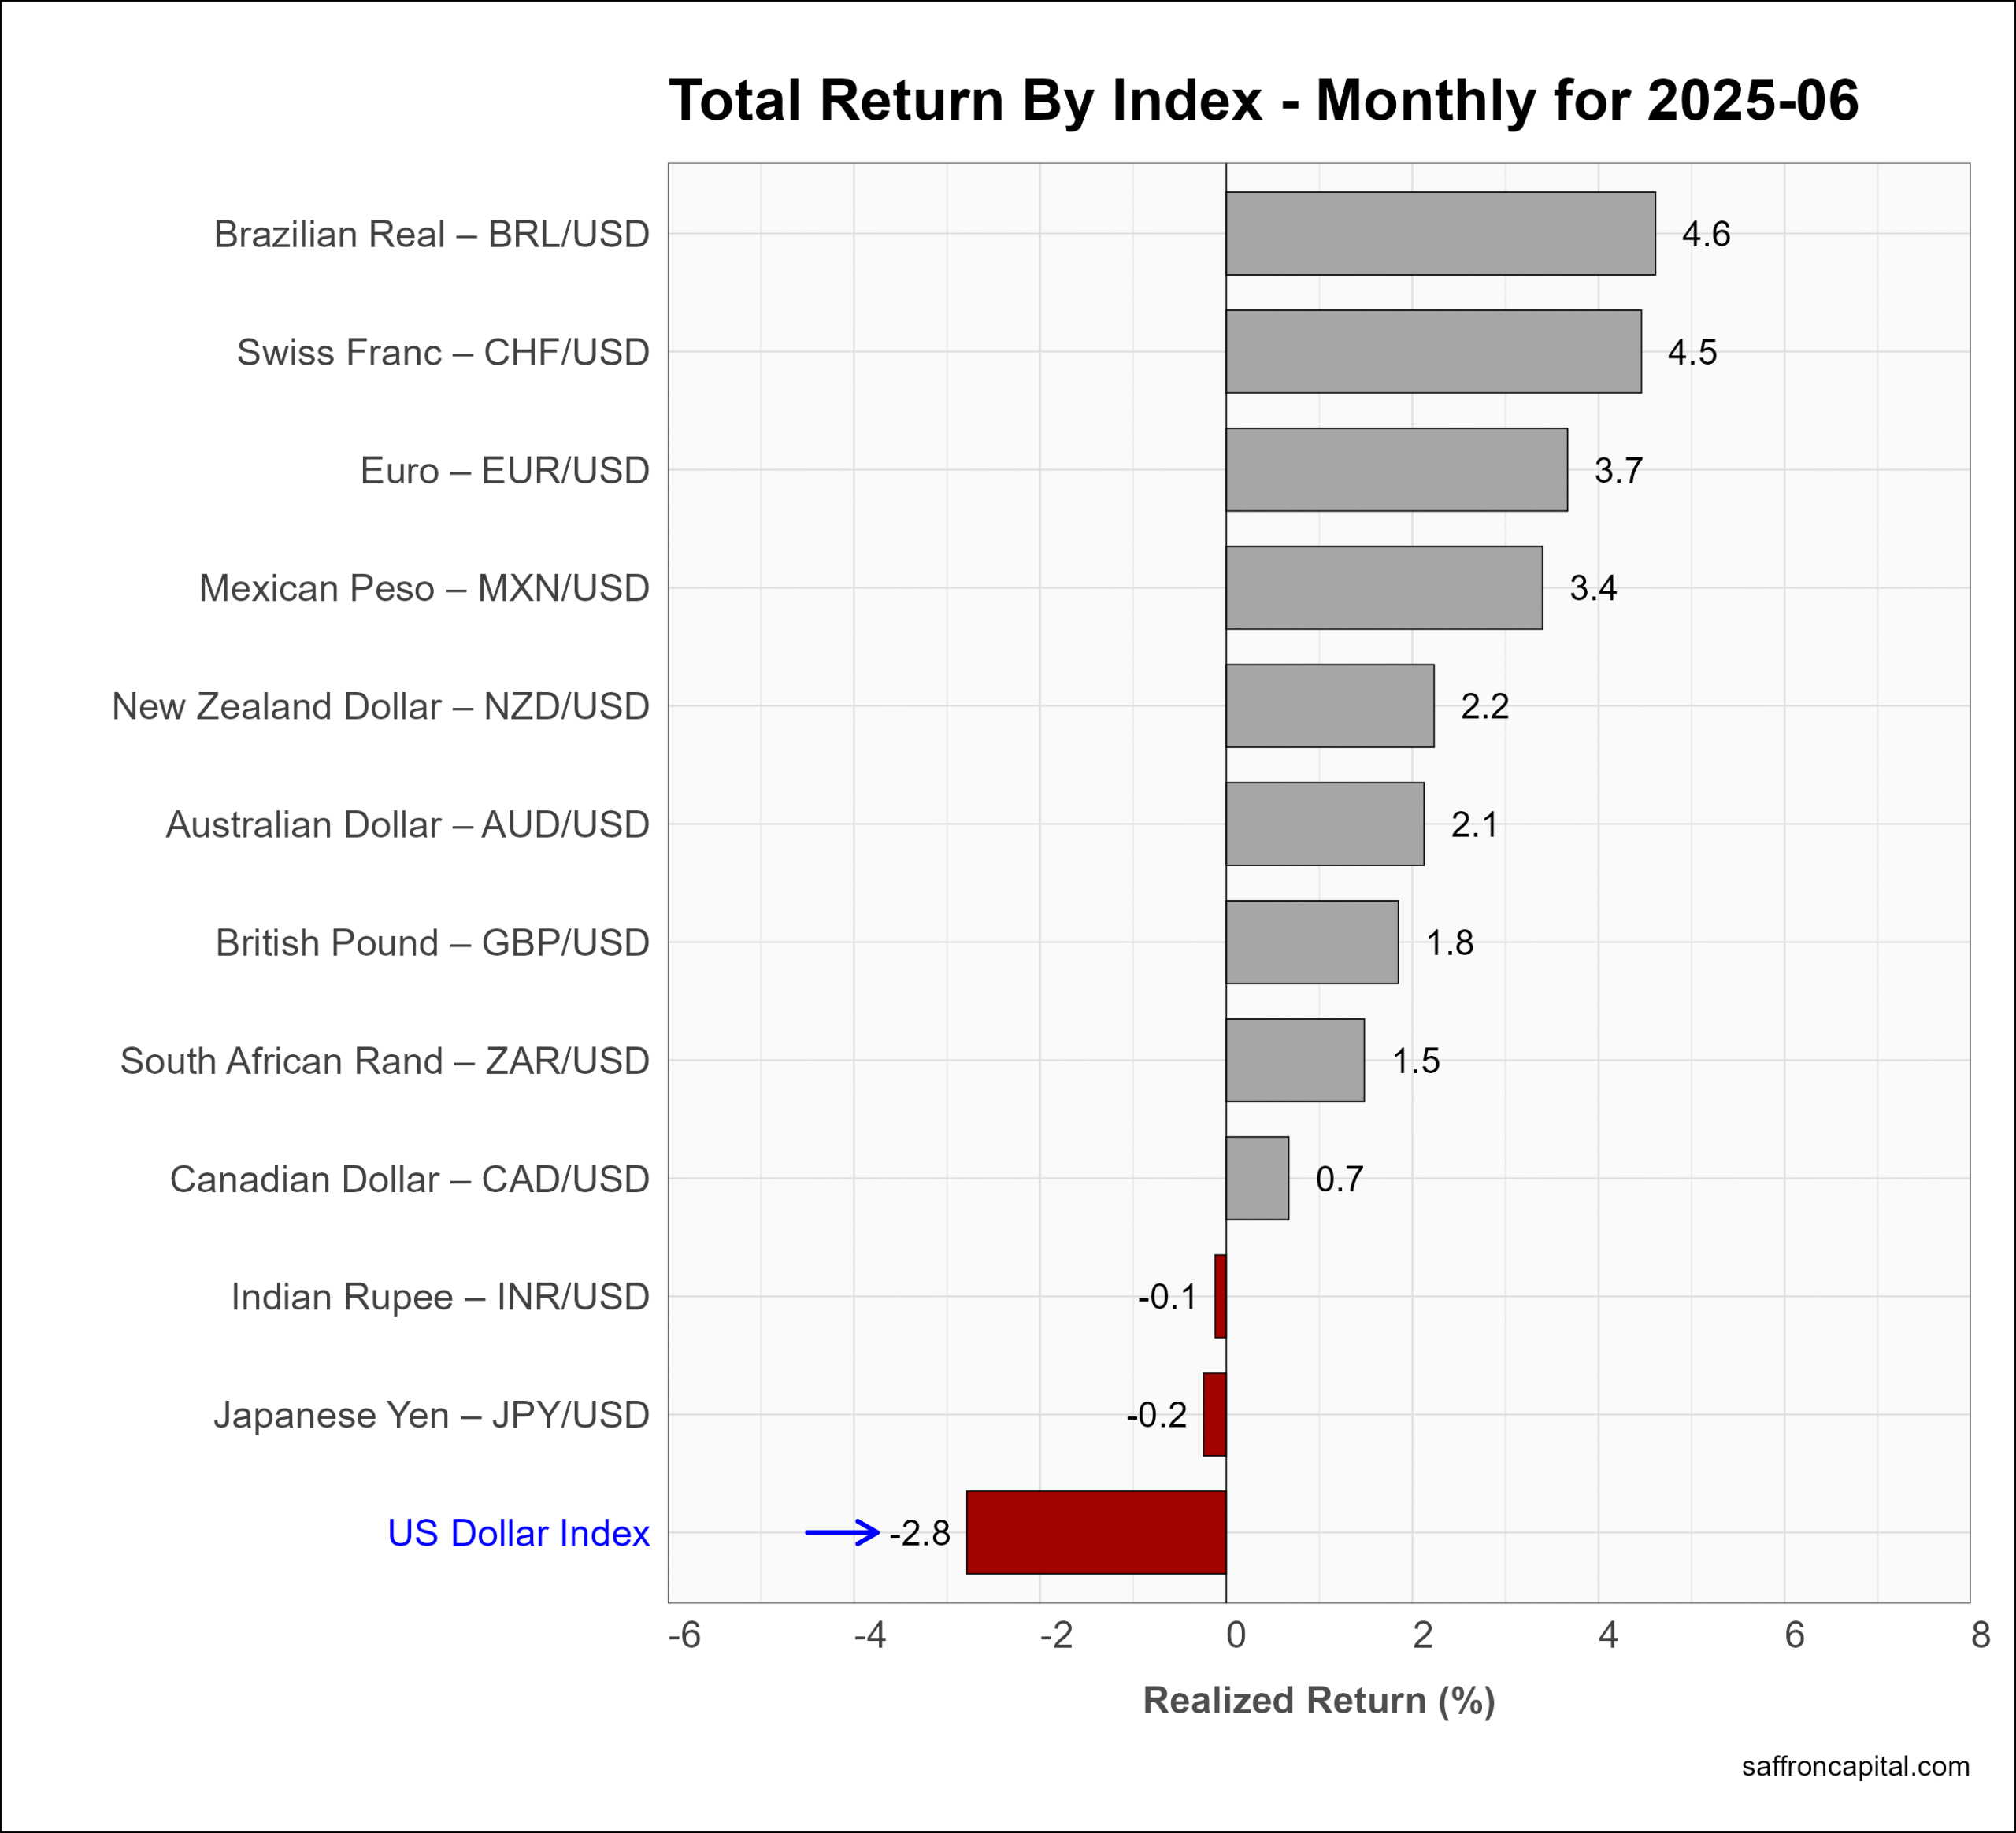
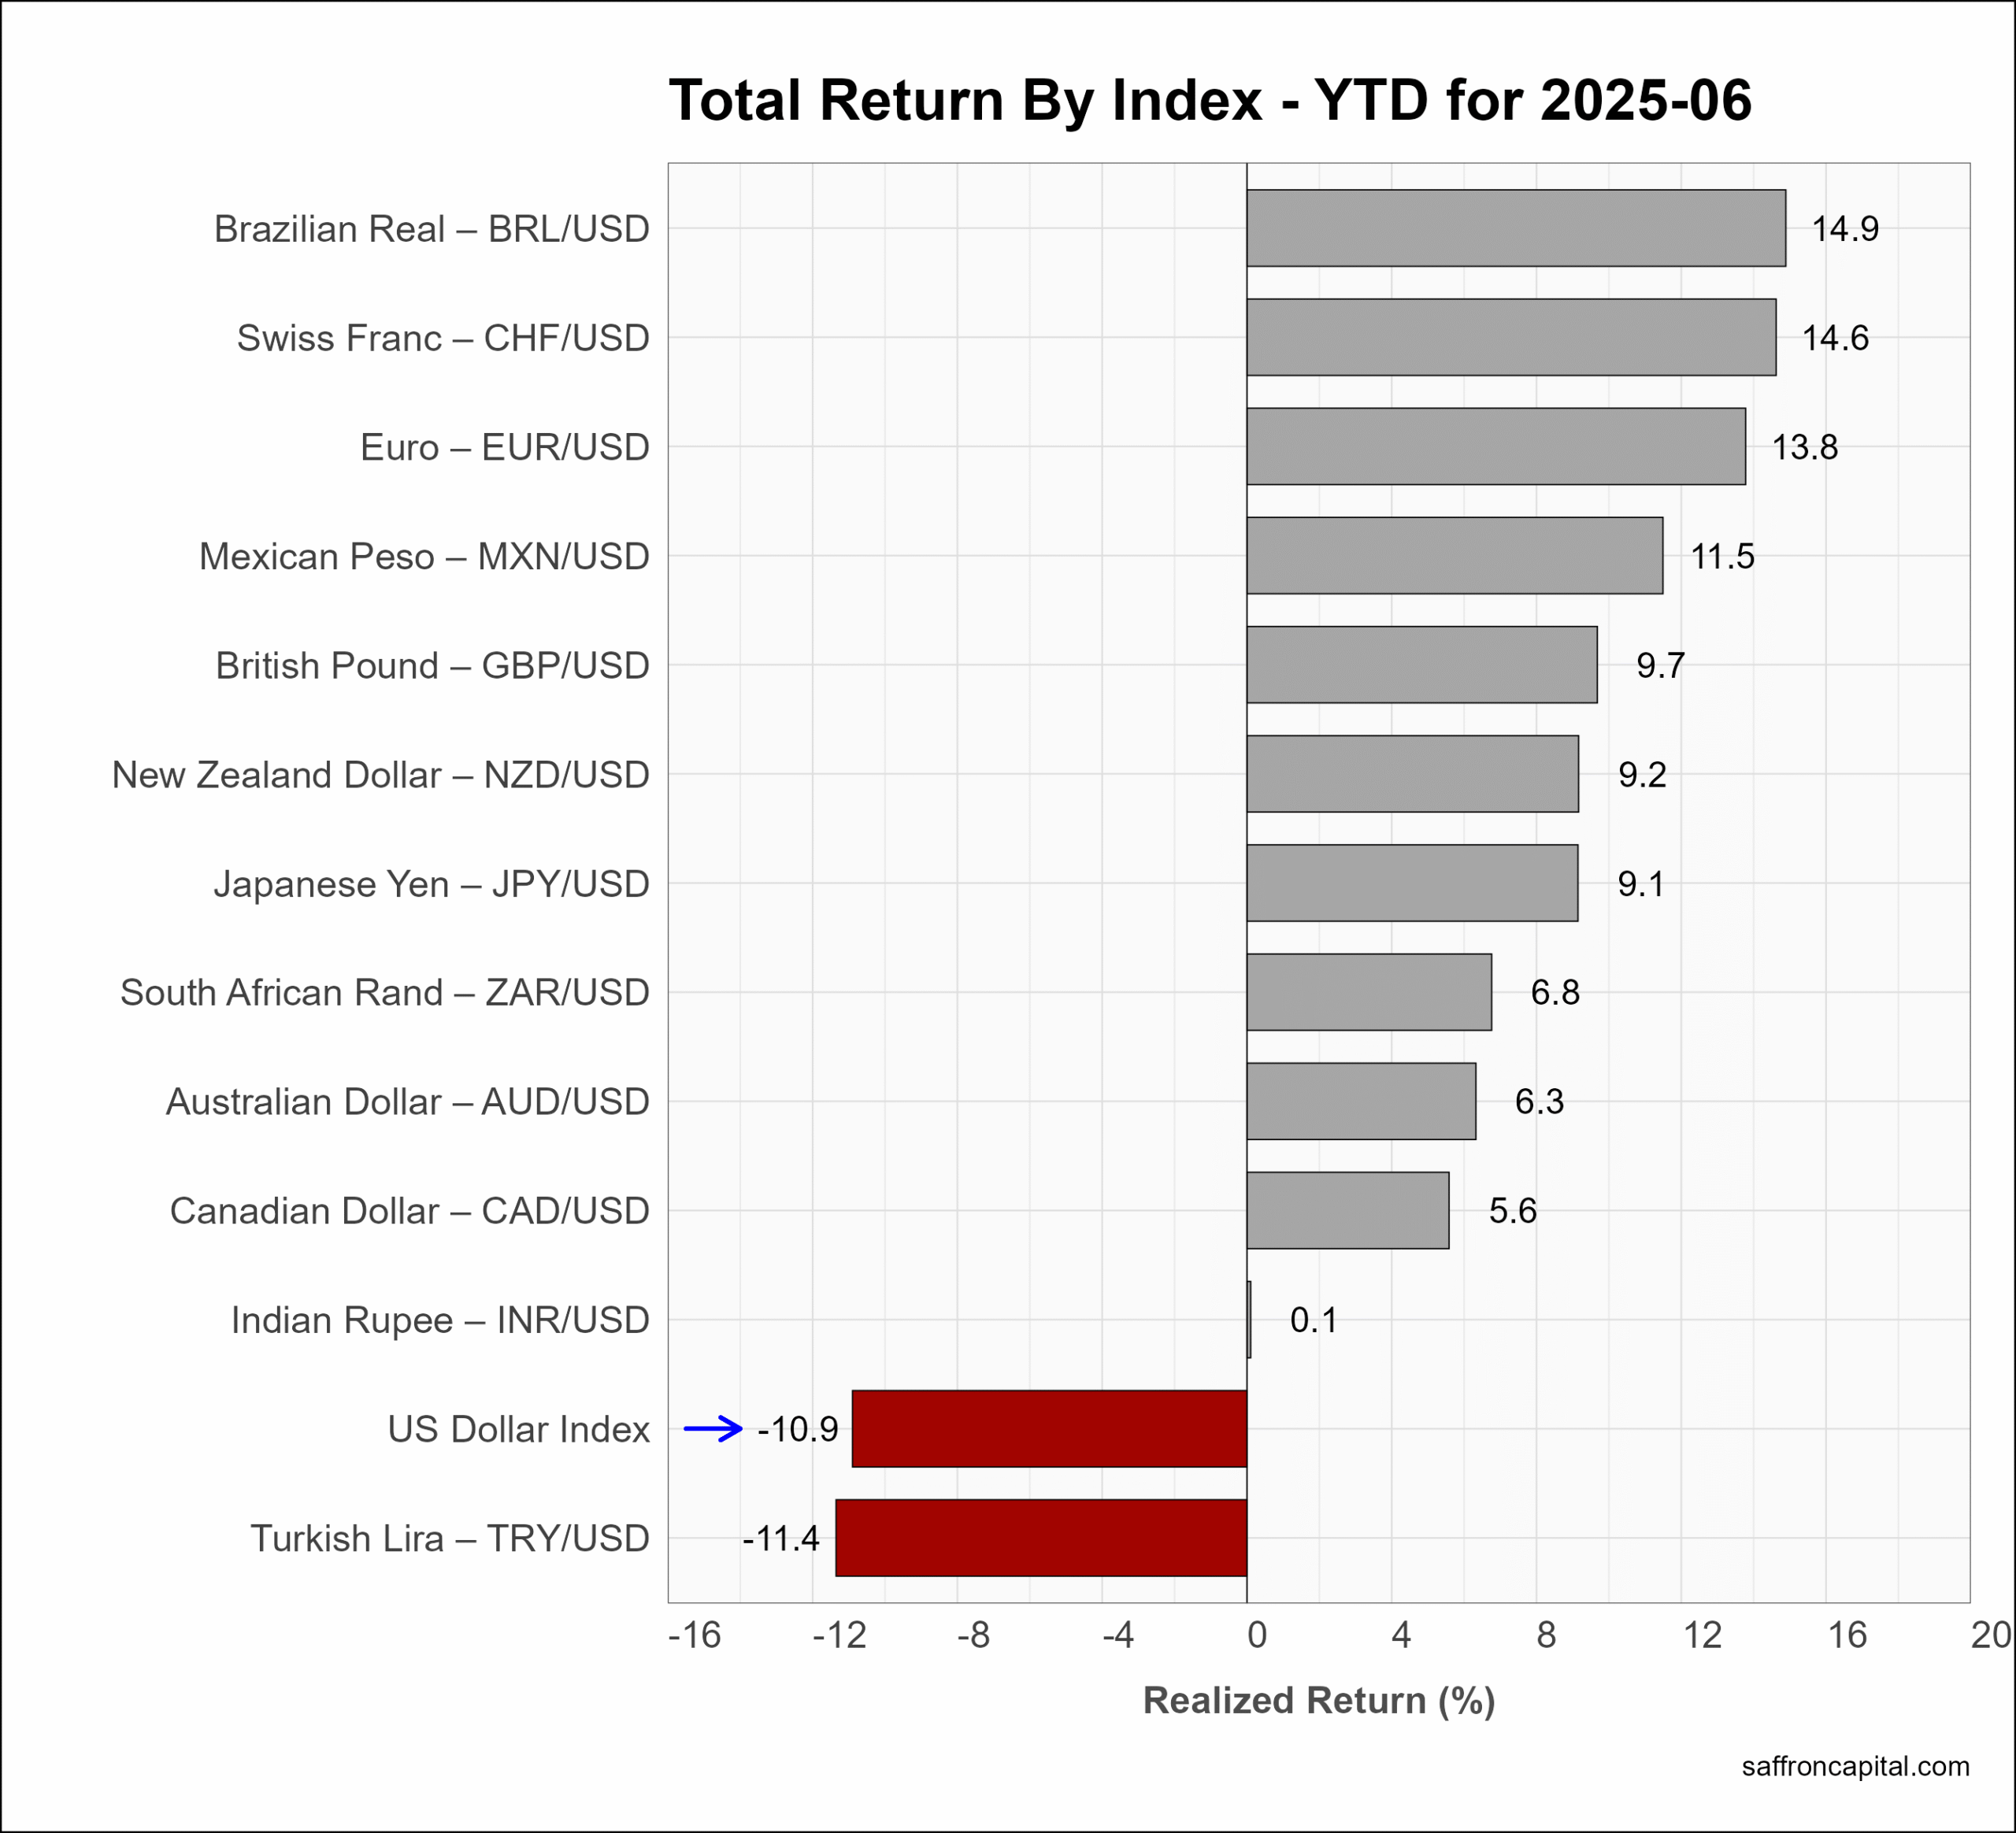
Currencies
The U.S. Dollar index (-2.8%) fell in June. The Brazilian Real (+4.6%) and the Swiss Franc (+4.5%) were the strongest of the currencies in June. The US Dollar is now down -10.9% since the start of the year.
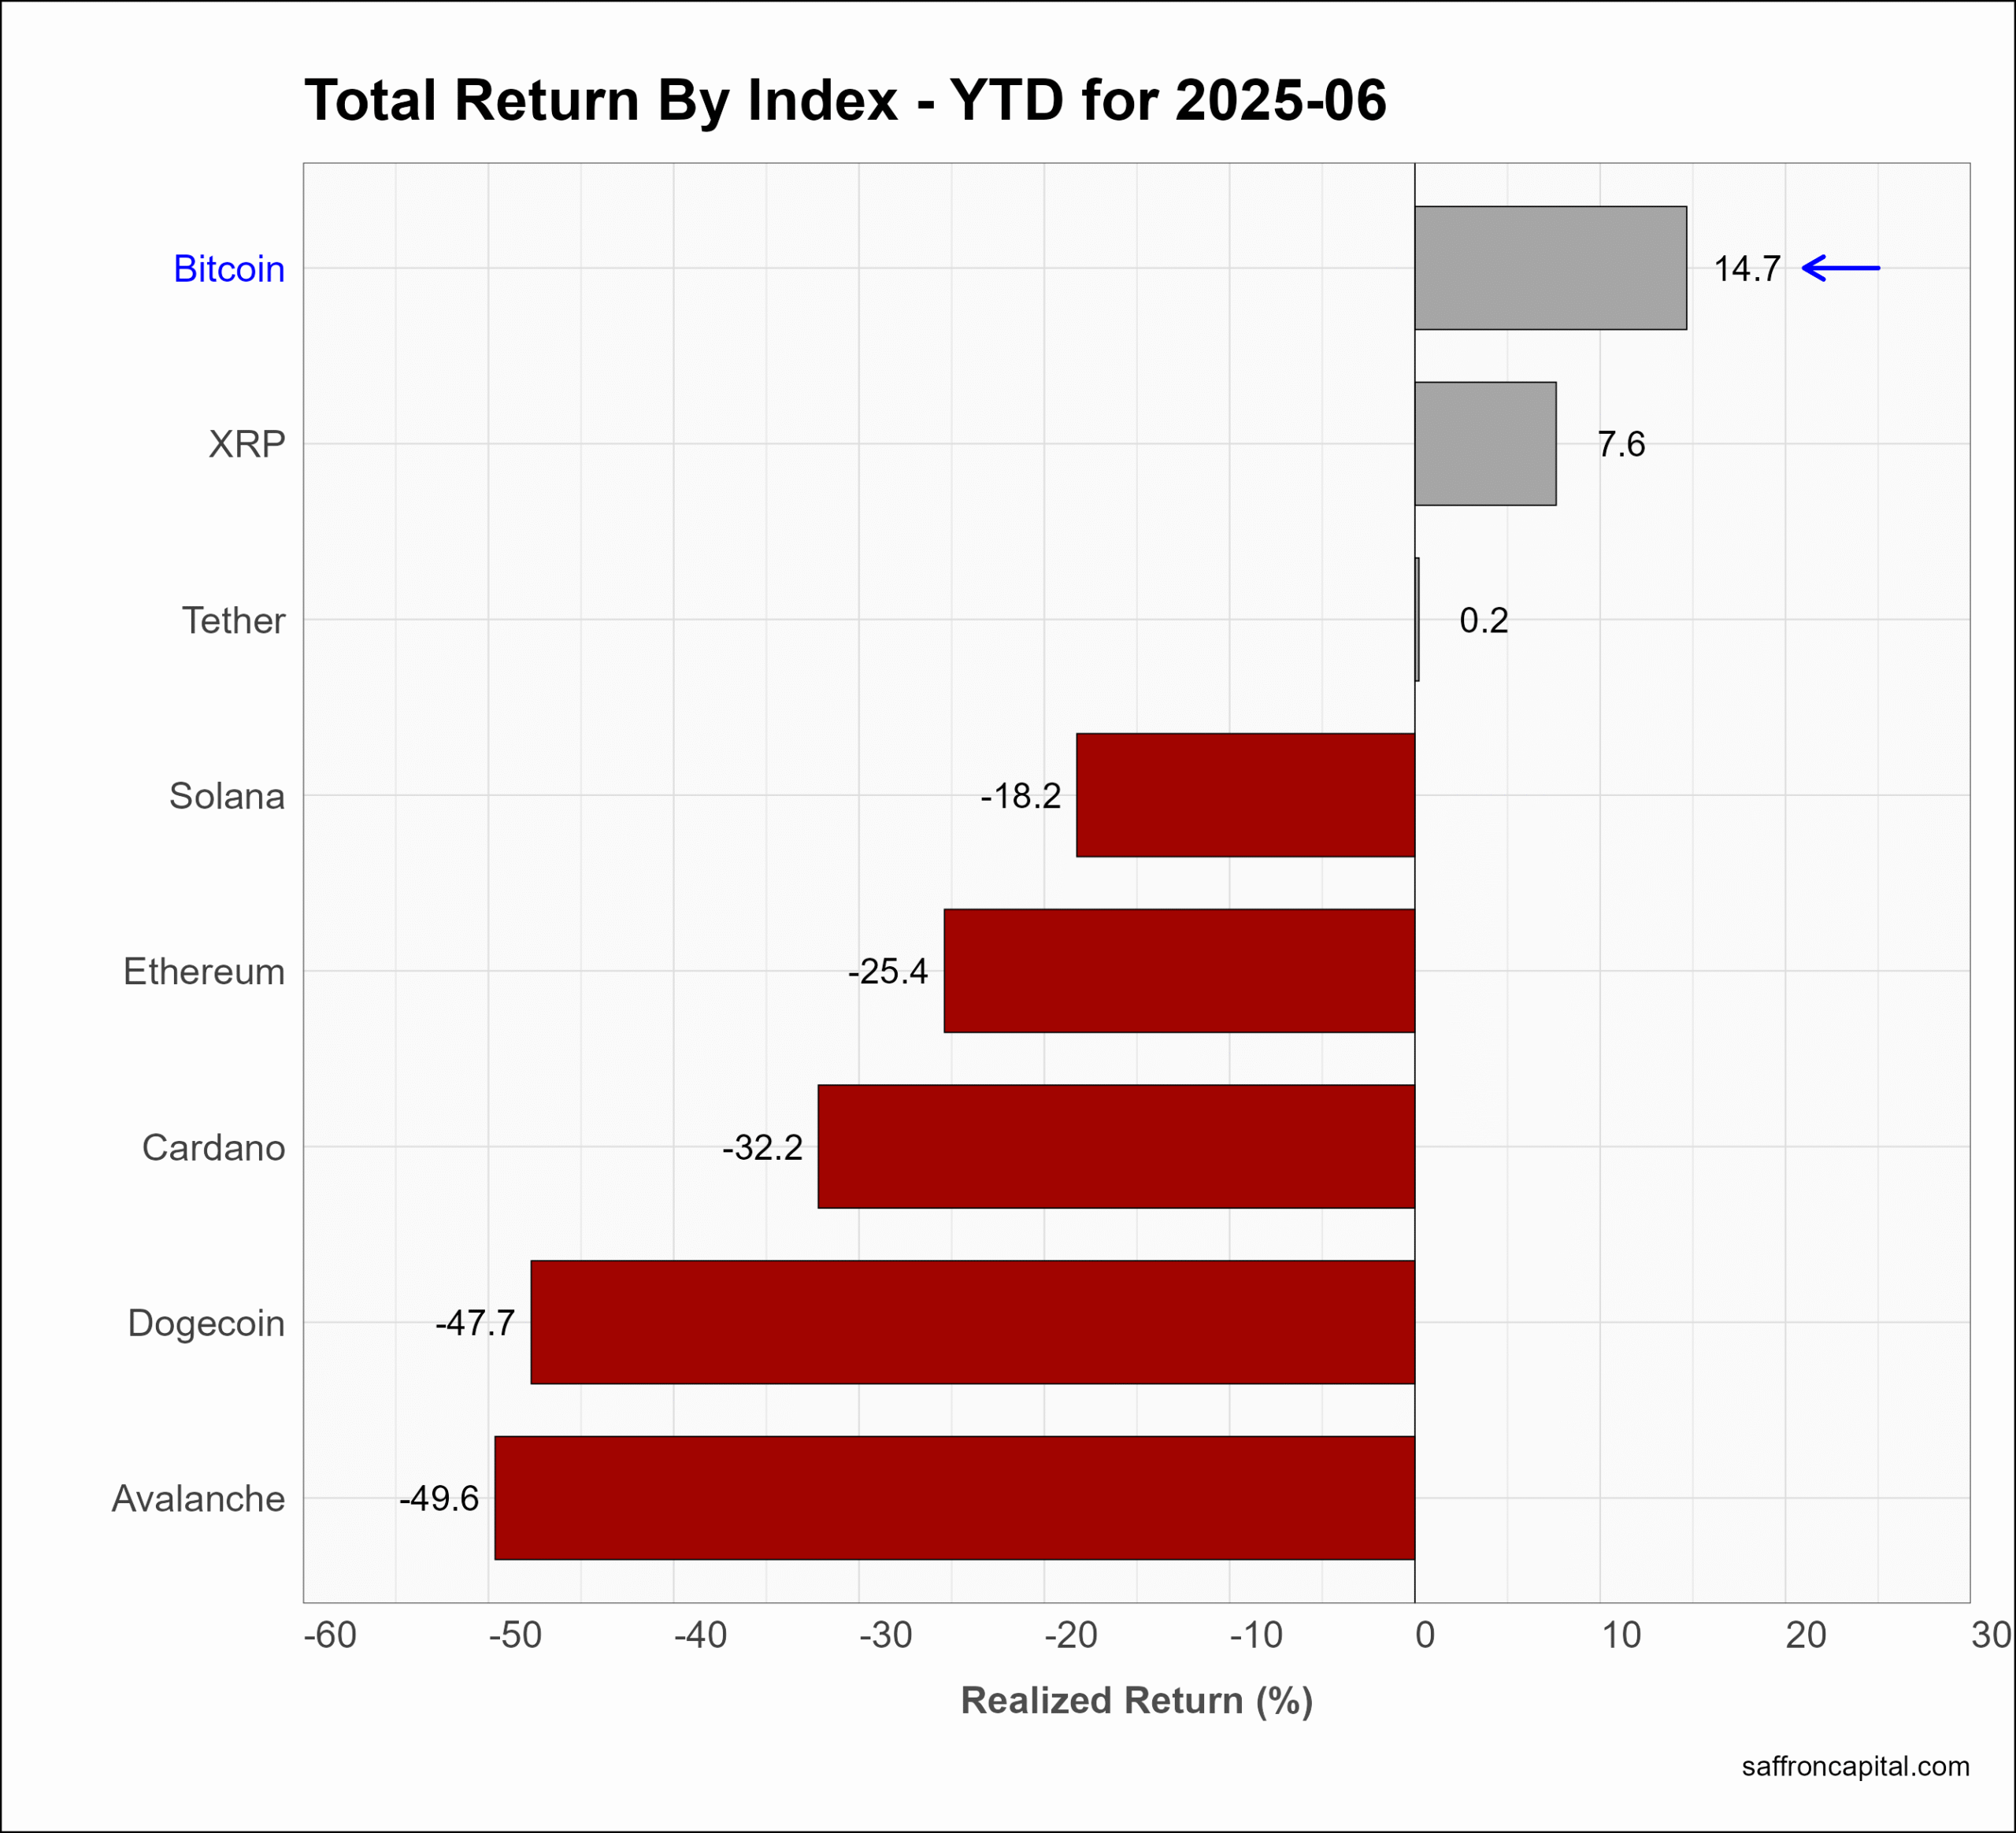
Cryptocurrencies
Benchmark Bitcoin (+3.0%) was up in June and trailed XRP (+4.7%). All the other cryptocurrencies spilled lots of red ink. Over the first two quarters of 2025, Bitcoin (+14.7%) is having a great year. Only XRP (+7.6%) and Tether (+0.2%) have positive returns year-to-date.
Click to enlarge
Have questions or concerns about the performance of your portfolio? Could you benefit from a capital preservation strategy or a custom portfolio formulation that better aligns to your risk appetite? Whatever your needs, we are here to listen and to help. Contact us here.
Saffron Capital LLC is a registered investment advisor that is employee-owned and Minnesota-based.


