July returns for the S&P 500 index (+2.2%) maintained upward momentum for the third month in a row despite ongoing tariff tensions and economic uncertainty. A key driver was second quarter earnings which grew 10.3% on an annual basis versus pre-report estimates of 4.9% at the end of June. In response, the index reached 10 all-time highs. However, by month’s end, index returns lost momentum. Pending tariff deadlines and the Fed’s concerns regarding economic ahead were both catalysts for month-end profit-taking.
The following analysis reviews July returns by asset group. The visual summary aims to help investors to benchmark portfolio returns and to see emerging trends in asset allocations across markets.
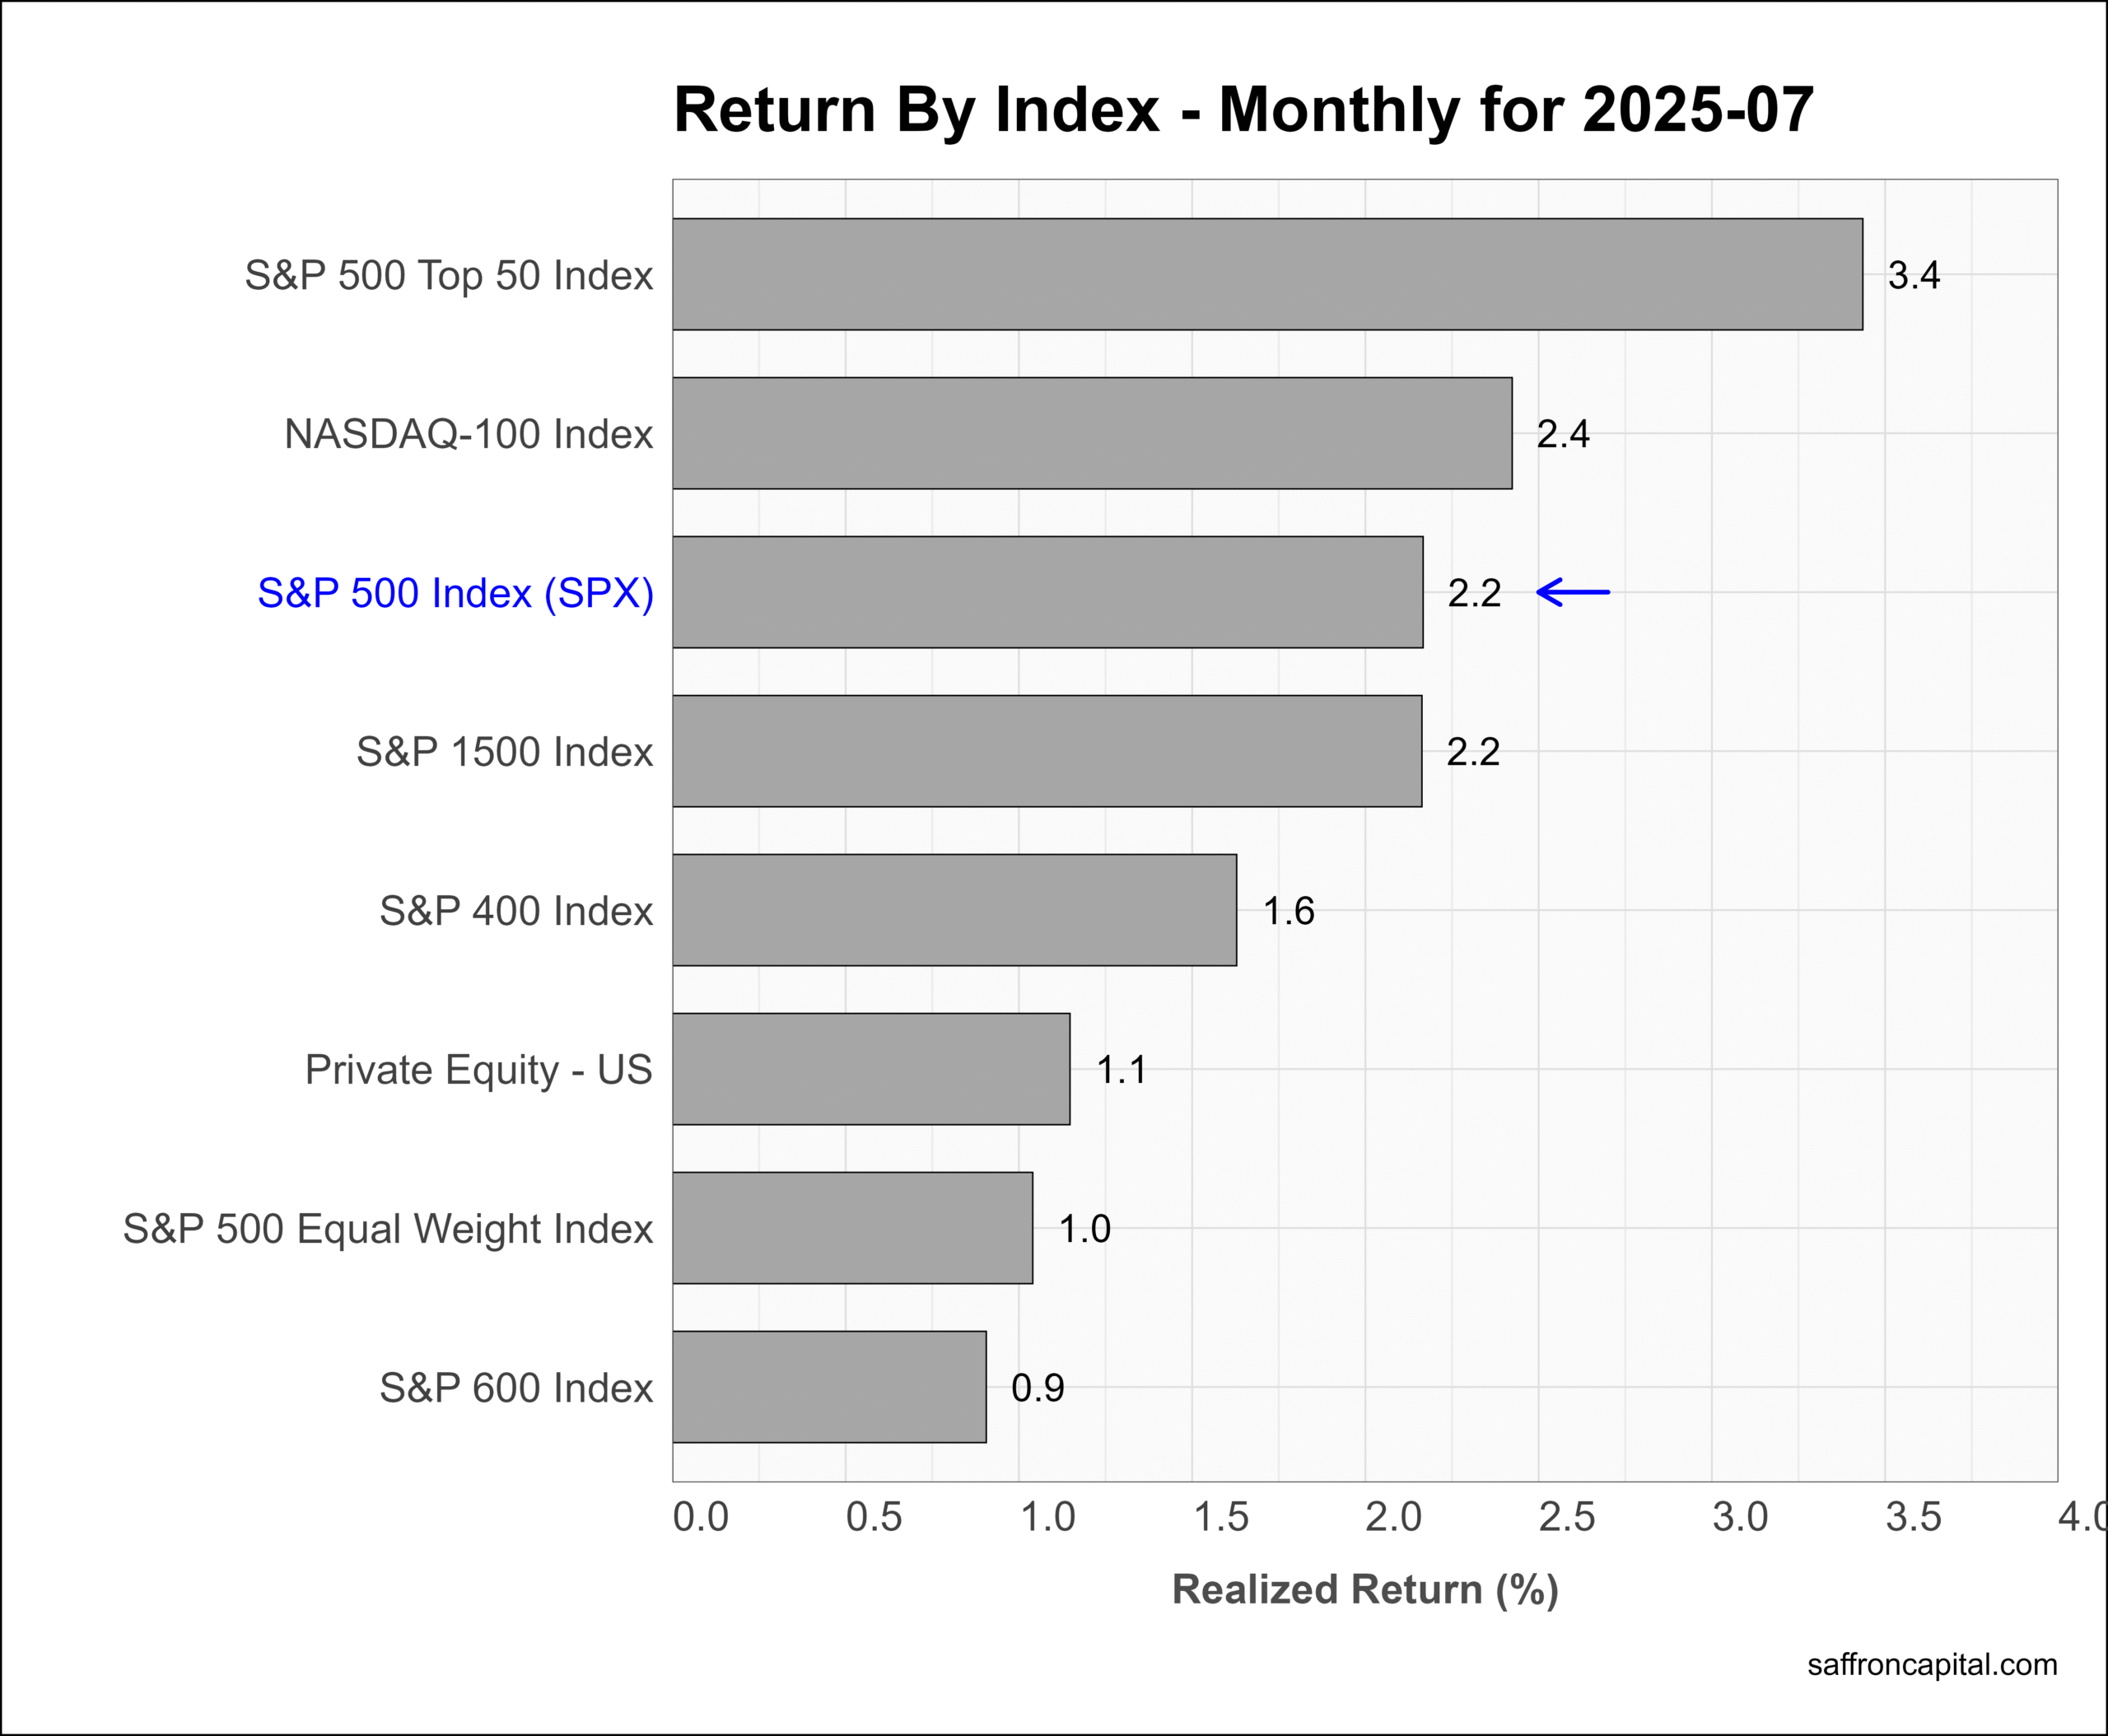
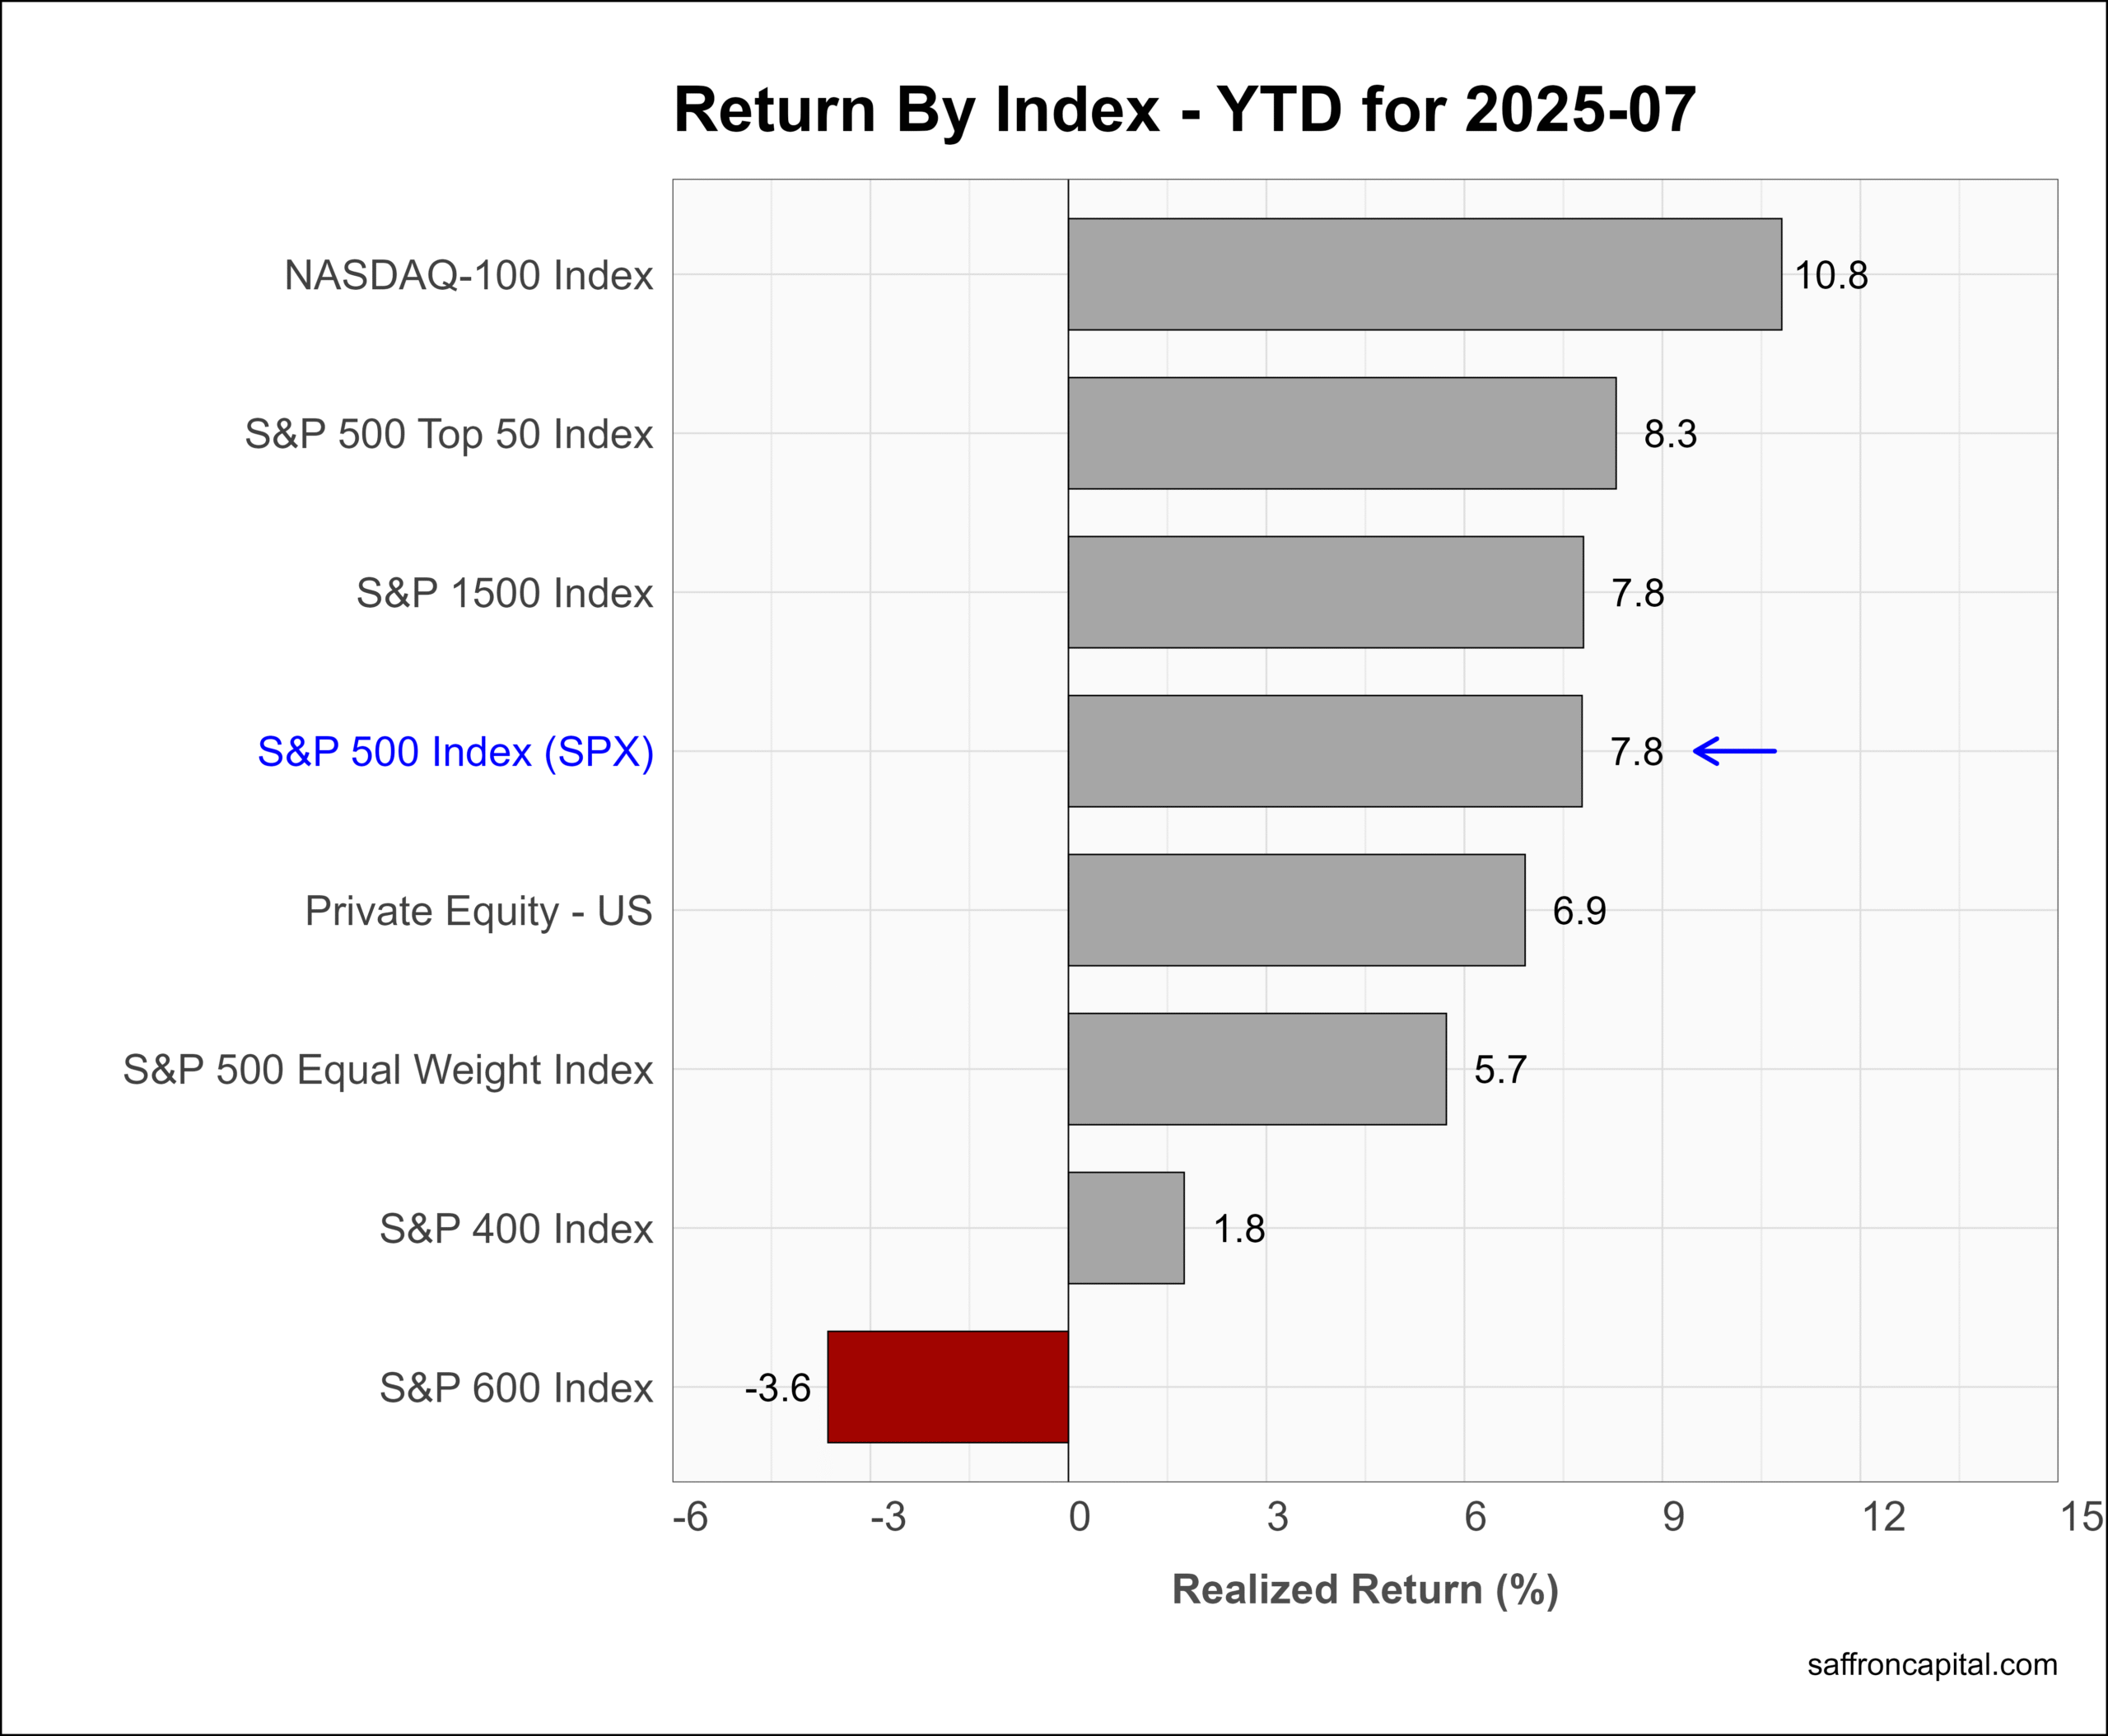
Core US Indices
Headline indices were lead by the S&P 500 Top 50 index (+3.4%) and the NASDAQ-100 index (+2.4%). The S&P MidCap 400 index (+1.6%) and the S&P SmallCap 600 Index (0.9%) also posted gains. Year-date, the S&P 500 index (+7.8%) established a new high-water mark but is bested by the NASDAQ-100 (+10.8%) and the S&P 500 Top 50 index (+8.3%). Prior to month’s end, a risk-off signal was generated for the S&P SMallCap 600 index (-3.6%), and the selling wiped out all gains achieved since the first quarter ended.
Click to enlarge
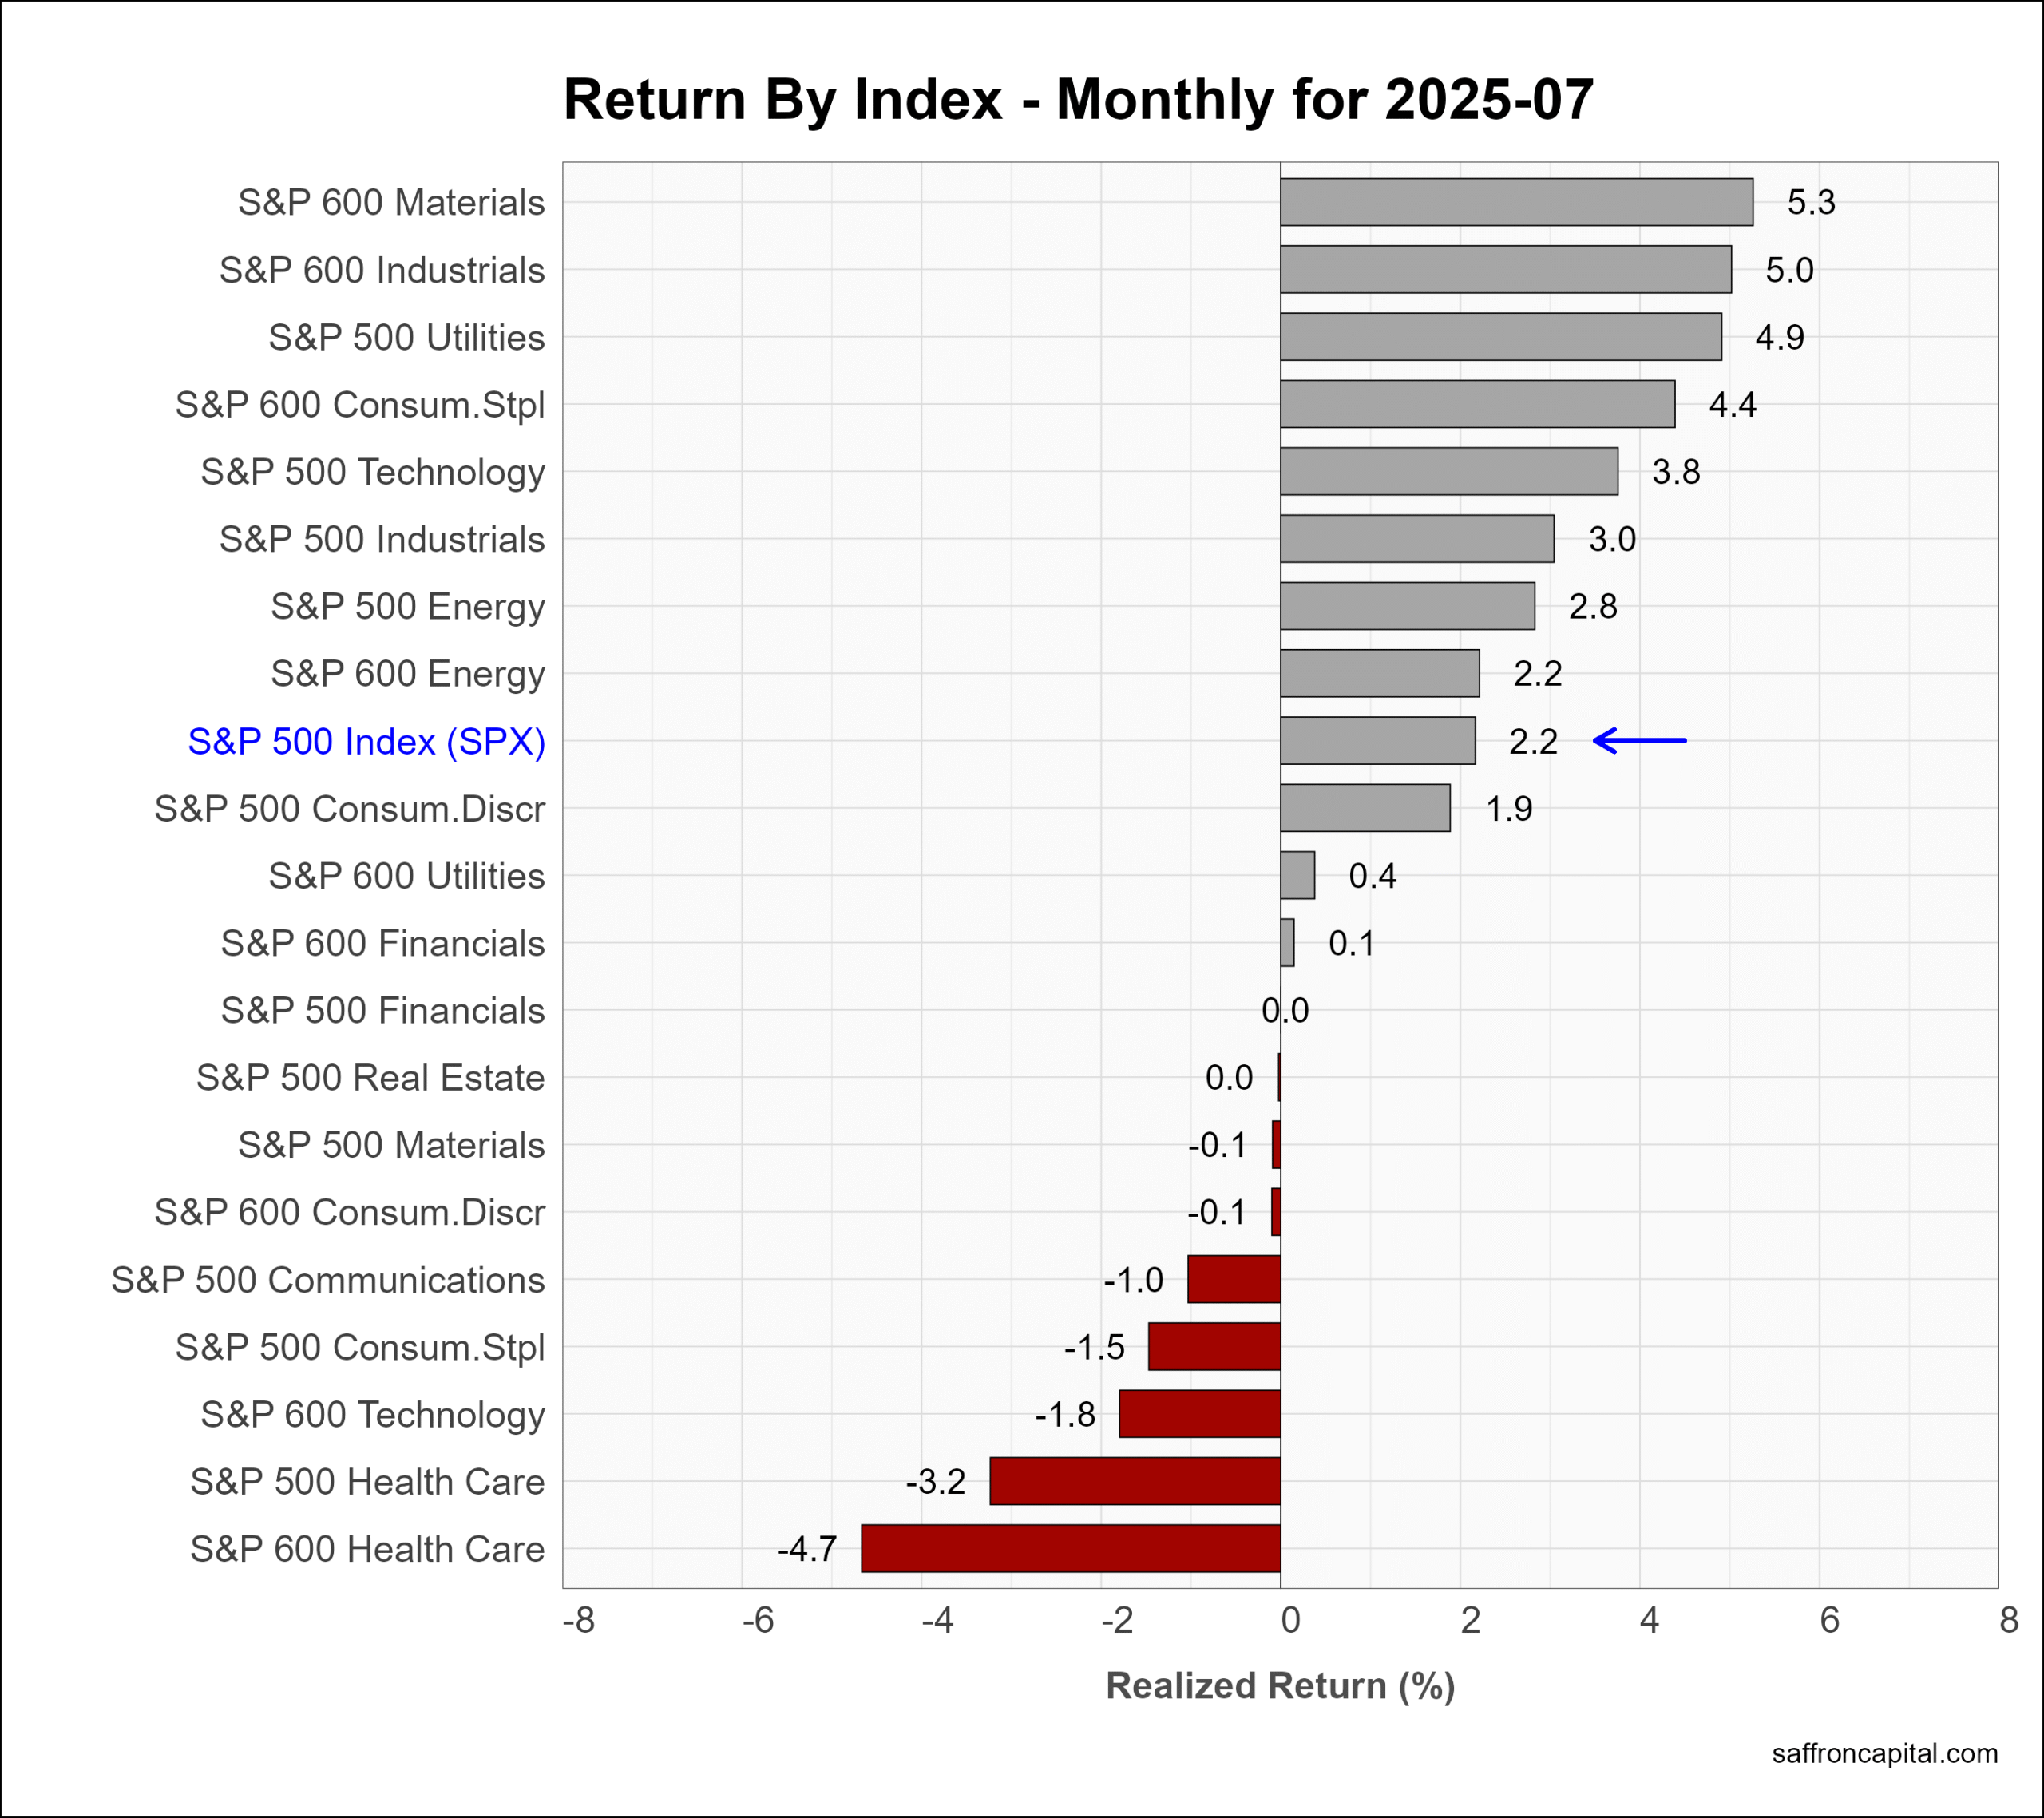
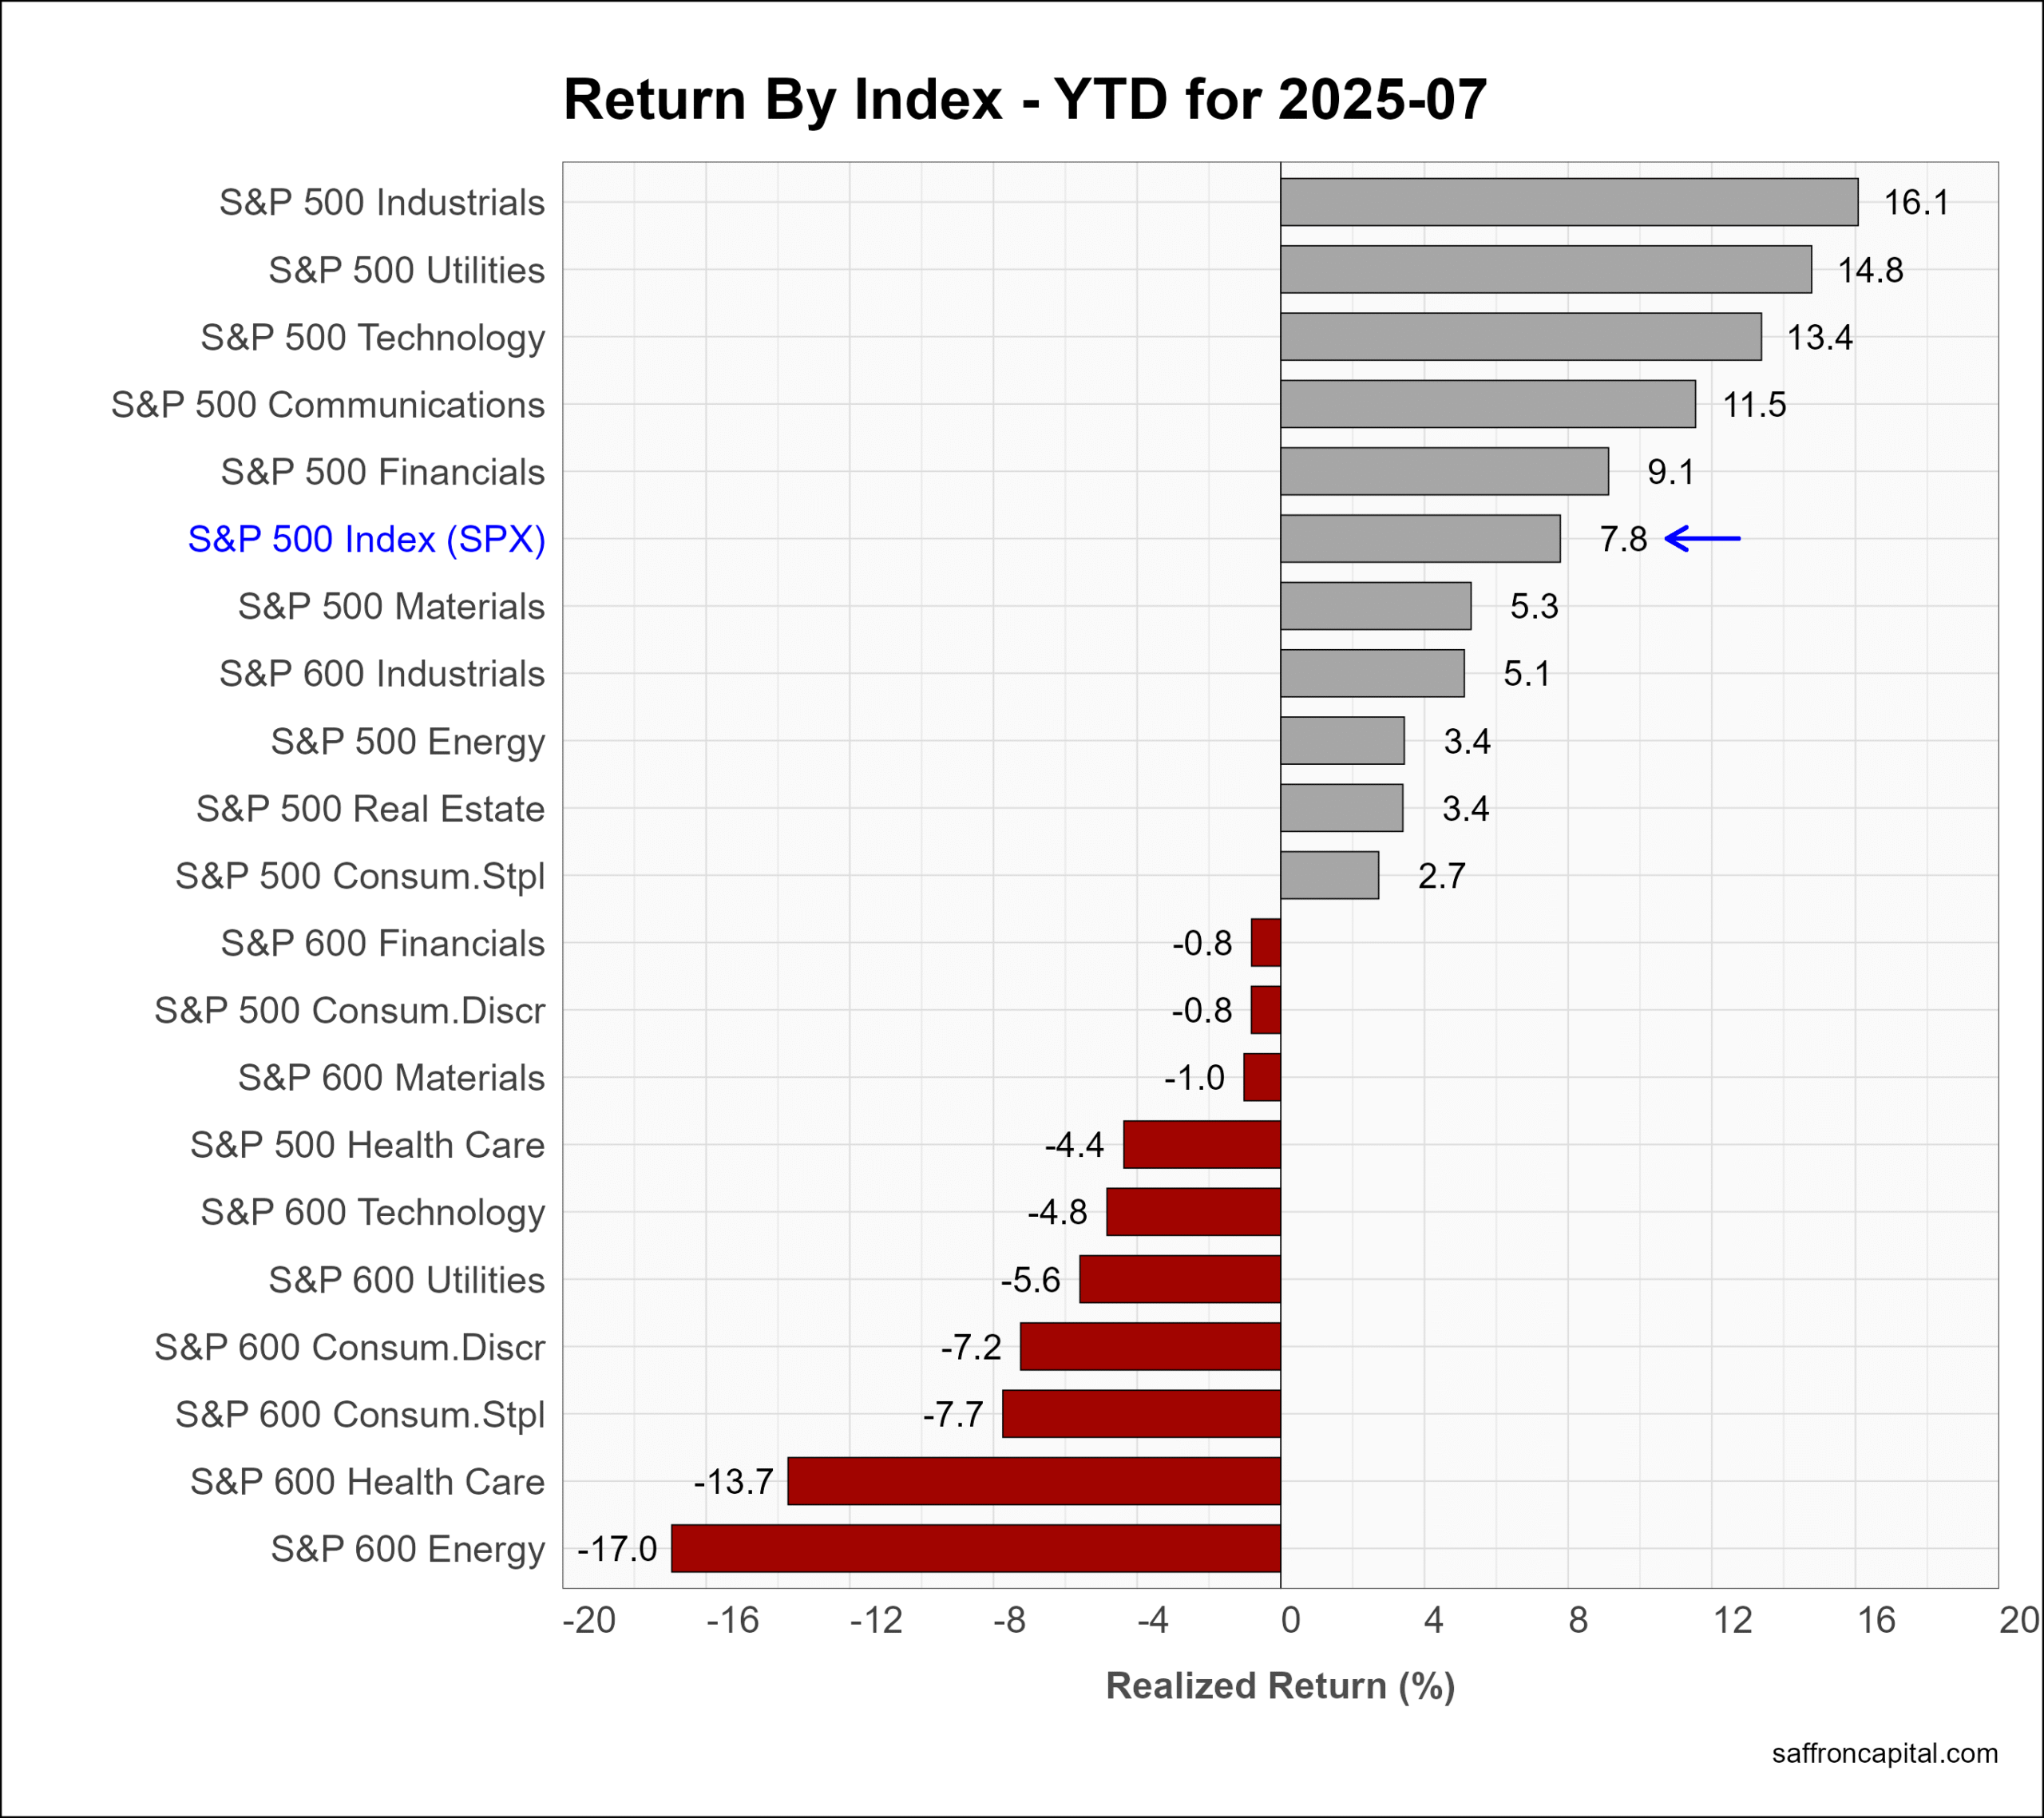
US Sector Indices
July returns saw a shift away from large-cap Technology (+3.8%), in favor of defensive Utilities (+4.9%) as power is the key supply-chain constraint impacting the build out of infrastructure for AI and robotics. Small-cap performance was best illustrated by the materials (+5.3%) and Industrials (+5.0%) sectors. Among the large caps, Healthcare (-3.2%) was the worse performer in July. Year-to-date, the top performers are large cap Industrials (+16.1%), Utilities (+14.8%), and Technology (+13.4%). Small cap sectors, notably Energy (-17.0%) and Healthcare (-13.7%), are yet to benefit from trade and regulatory policies.
Click to enlarge
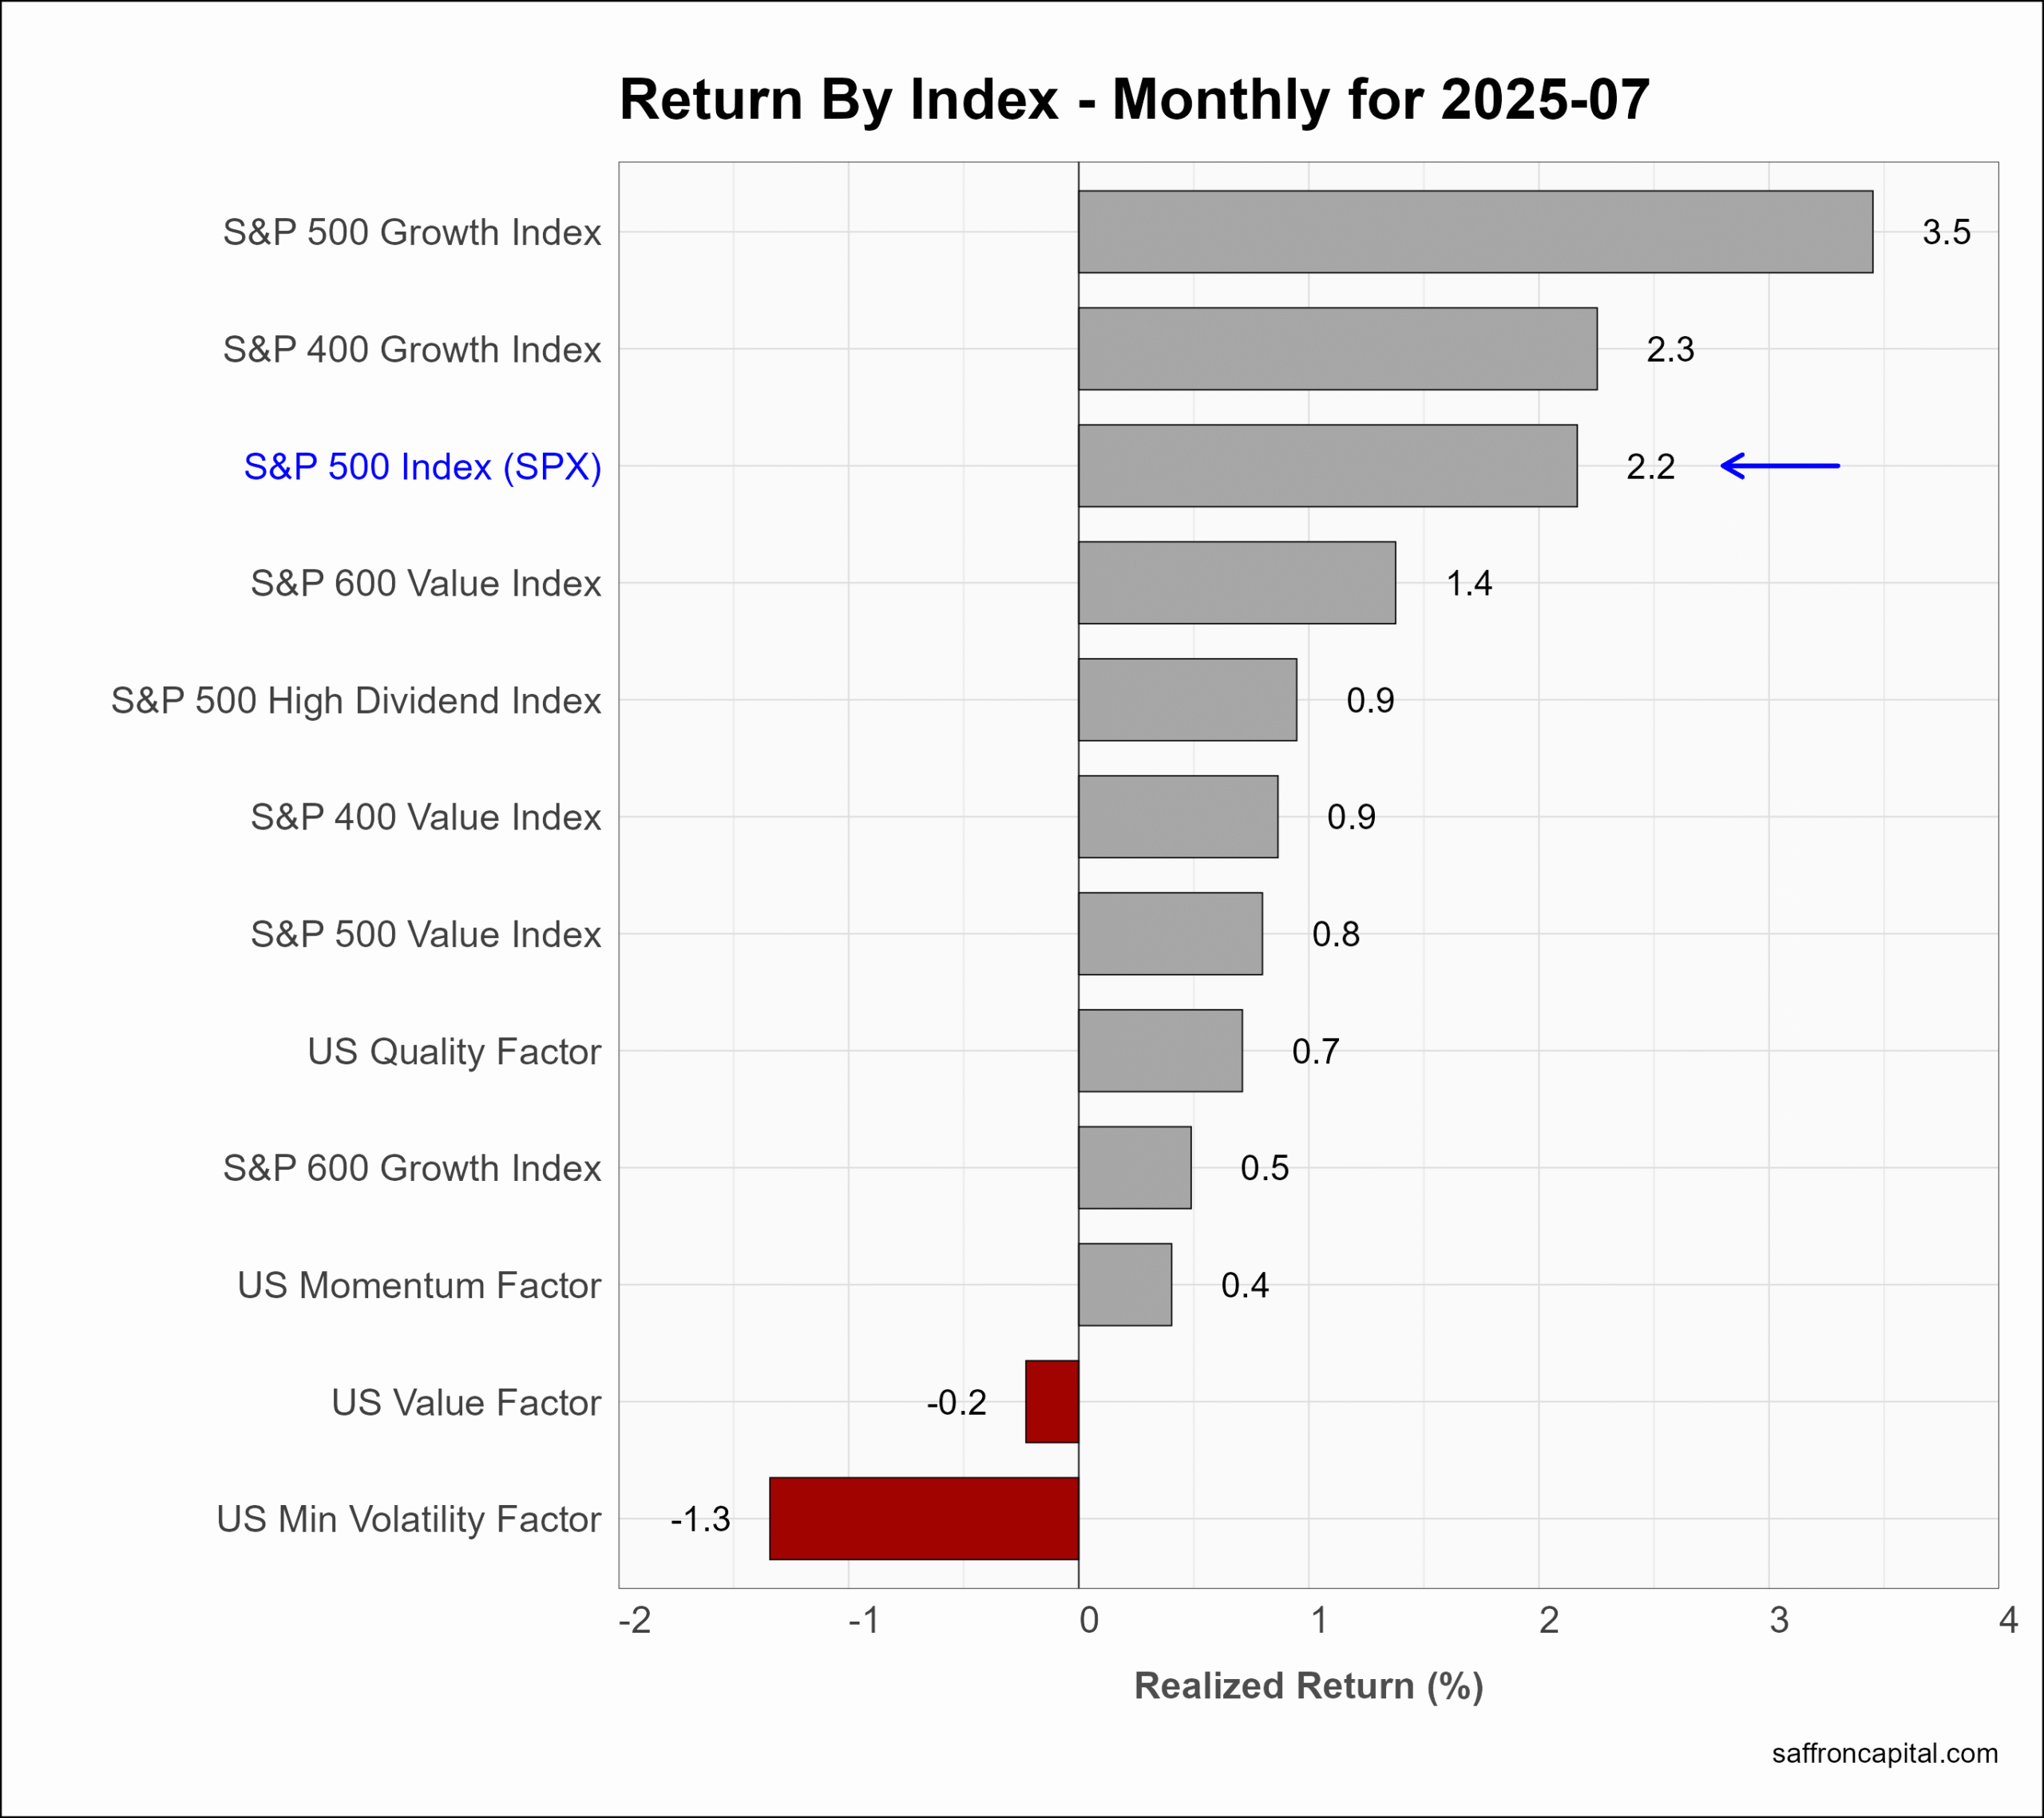
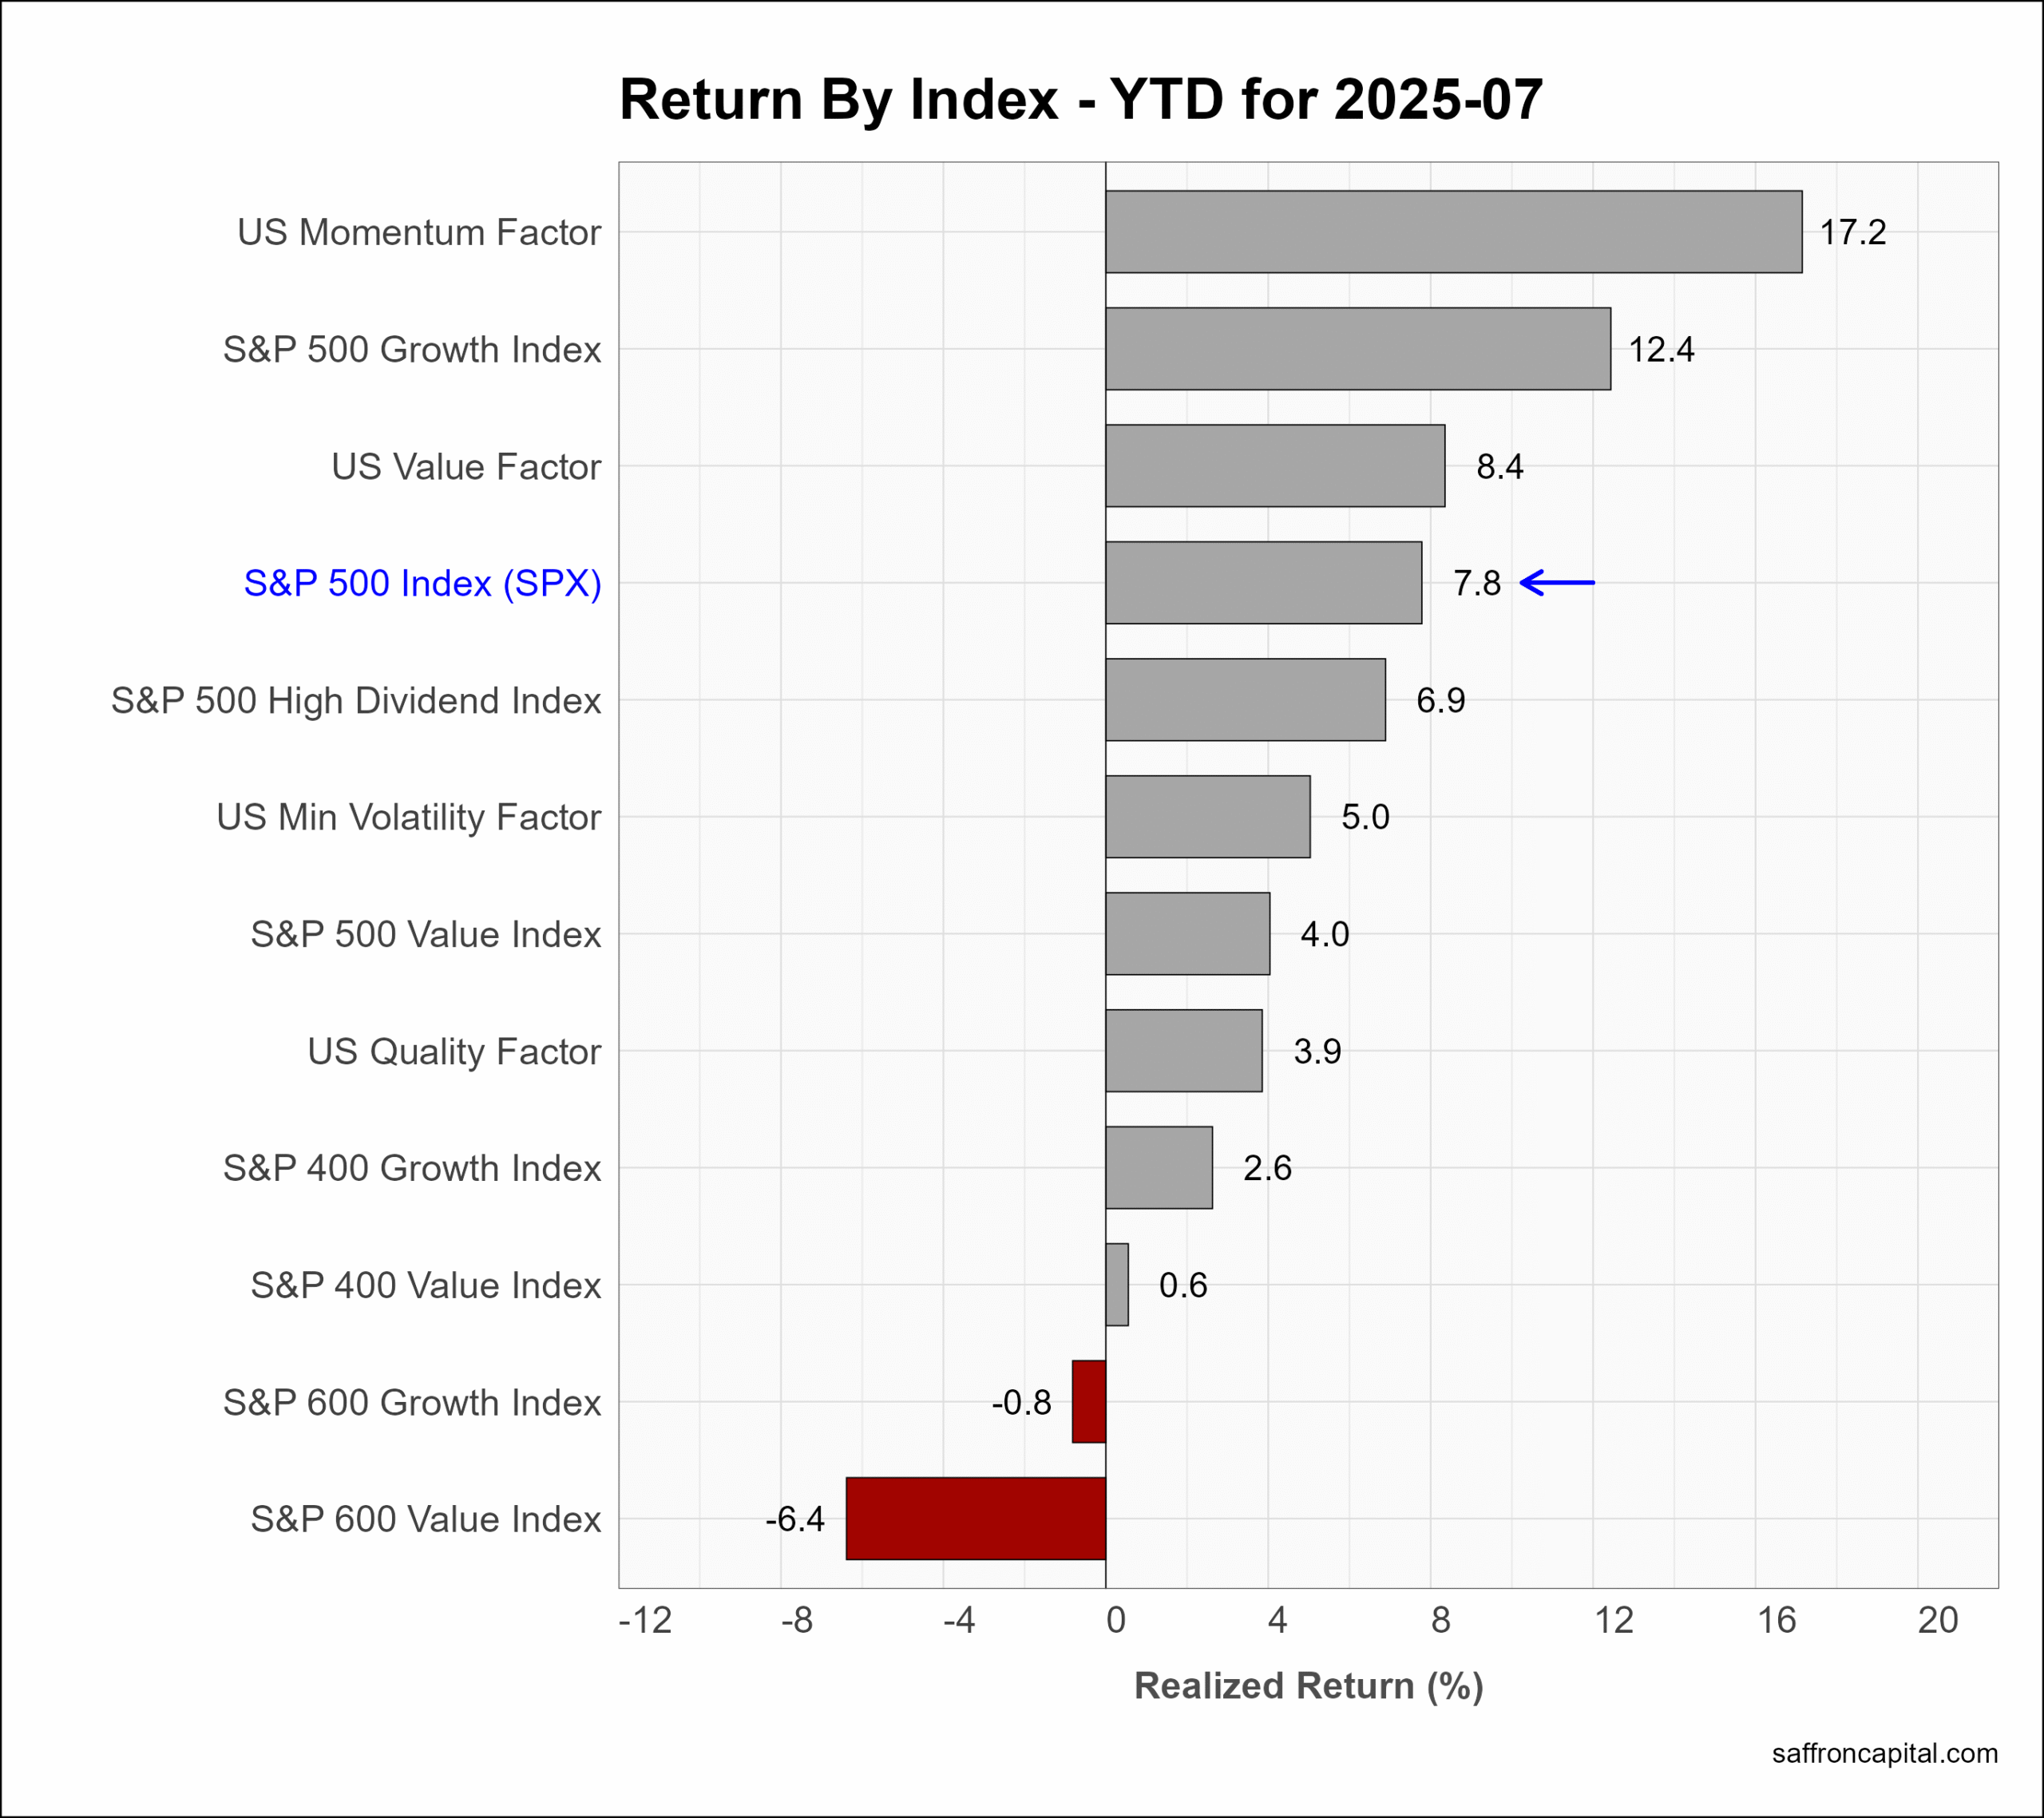
US Factor Indices
Factor portfolios are constructed to focus on the core drivers behind returns, which include company size, relative value, profitability, growth, and momentum. Multi-factor portfolios combine two or more factors. In July, only the the large-cap Growth portfolio (+3.5%) and small-cap Growth (+2.3%) outperformed the S&P 500 index. Meanwhile, it was notable that the US Momentum portfolio (+0.4%) gave up its leadership role in July, even though it continues to lead a year-to-date basis (+17.2%). Other top performers since January include large-cap growth (+12.4%) and the US Value portfolio (+8.4%).
Click to enlarge
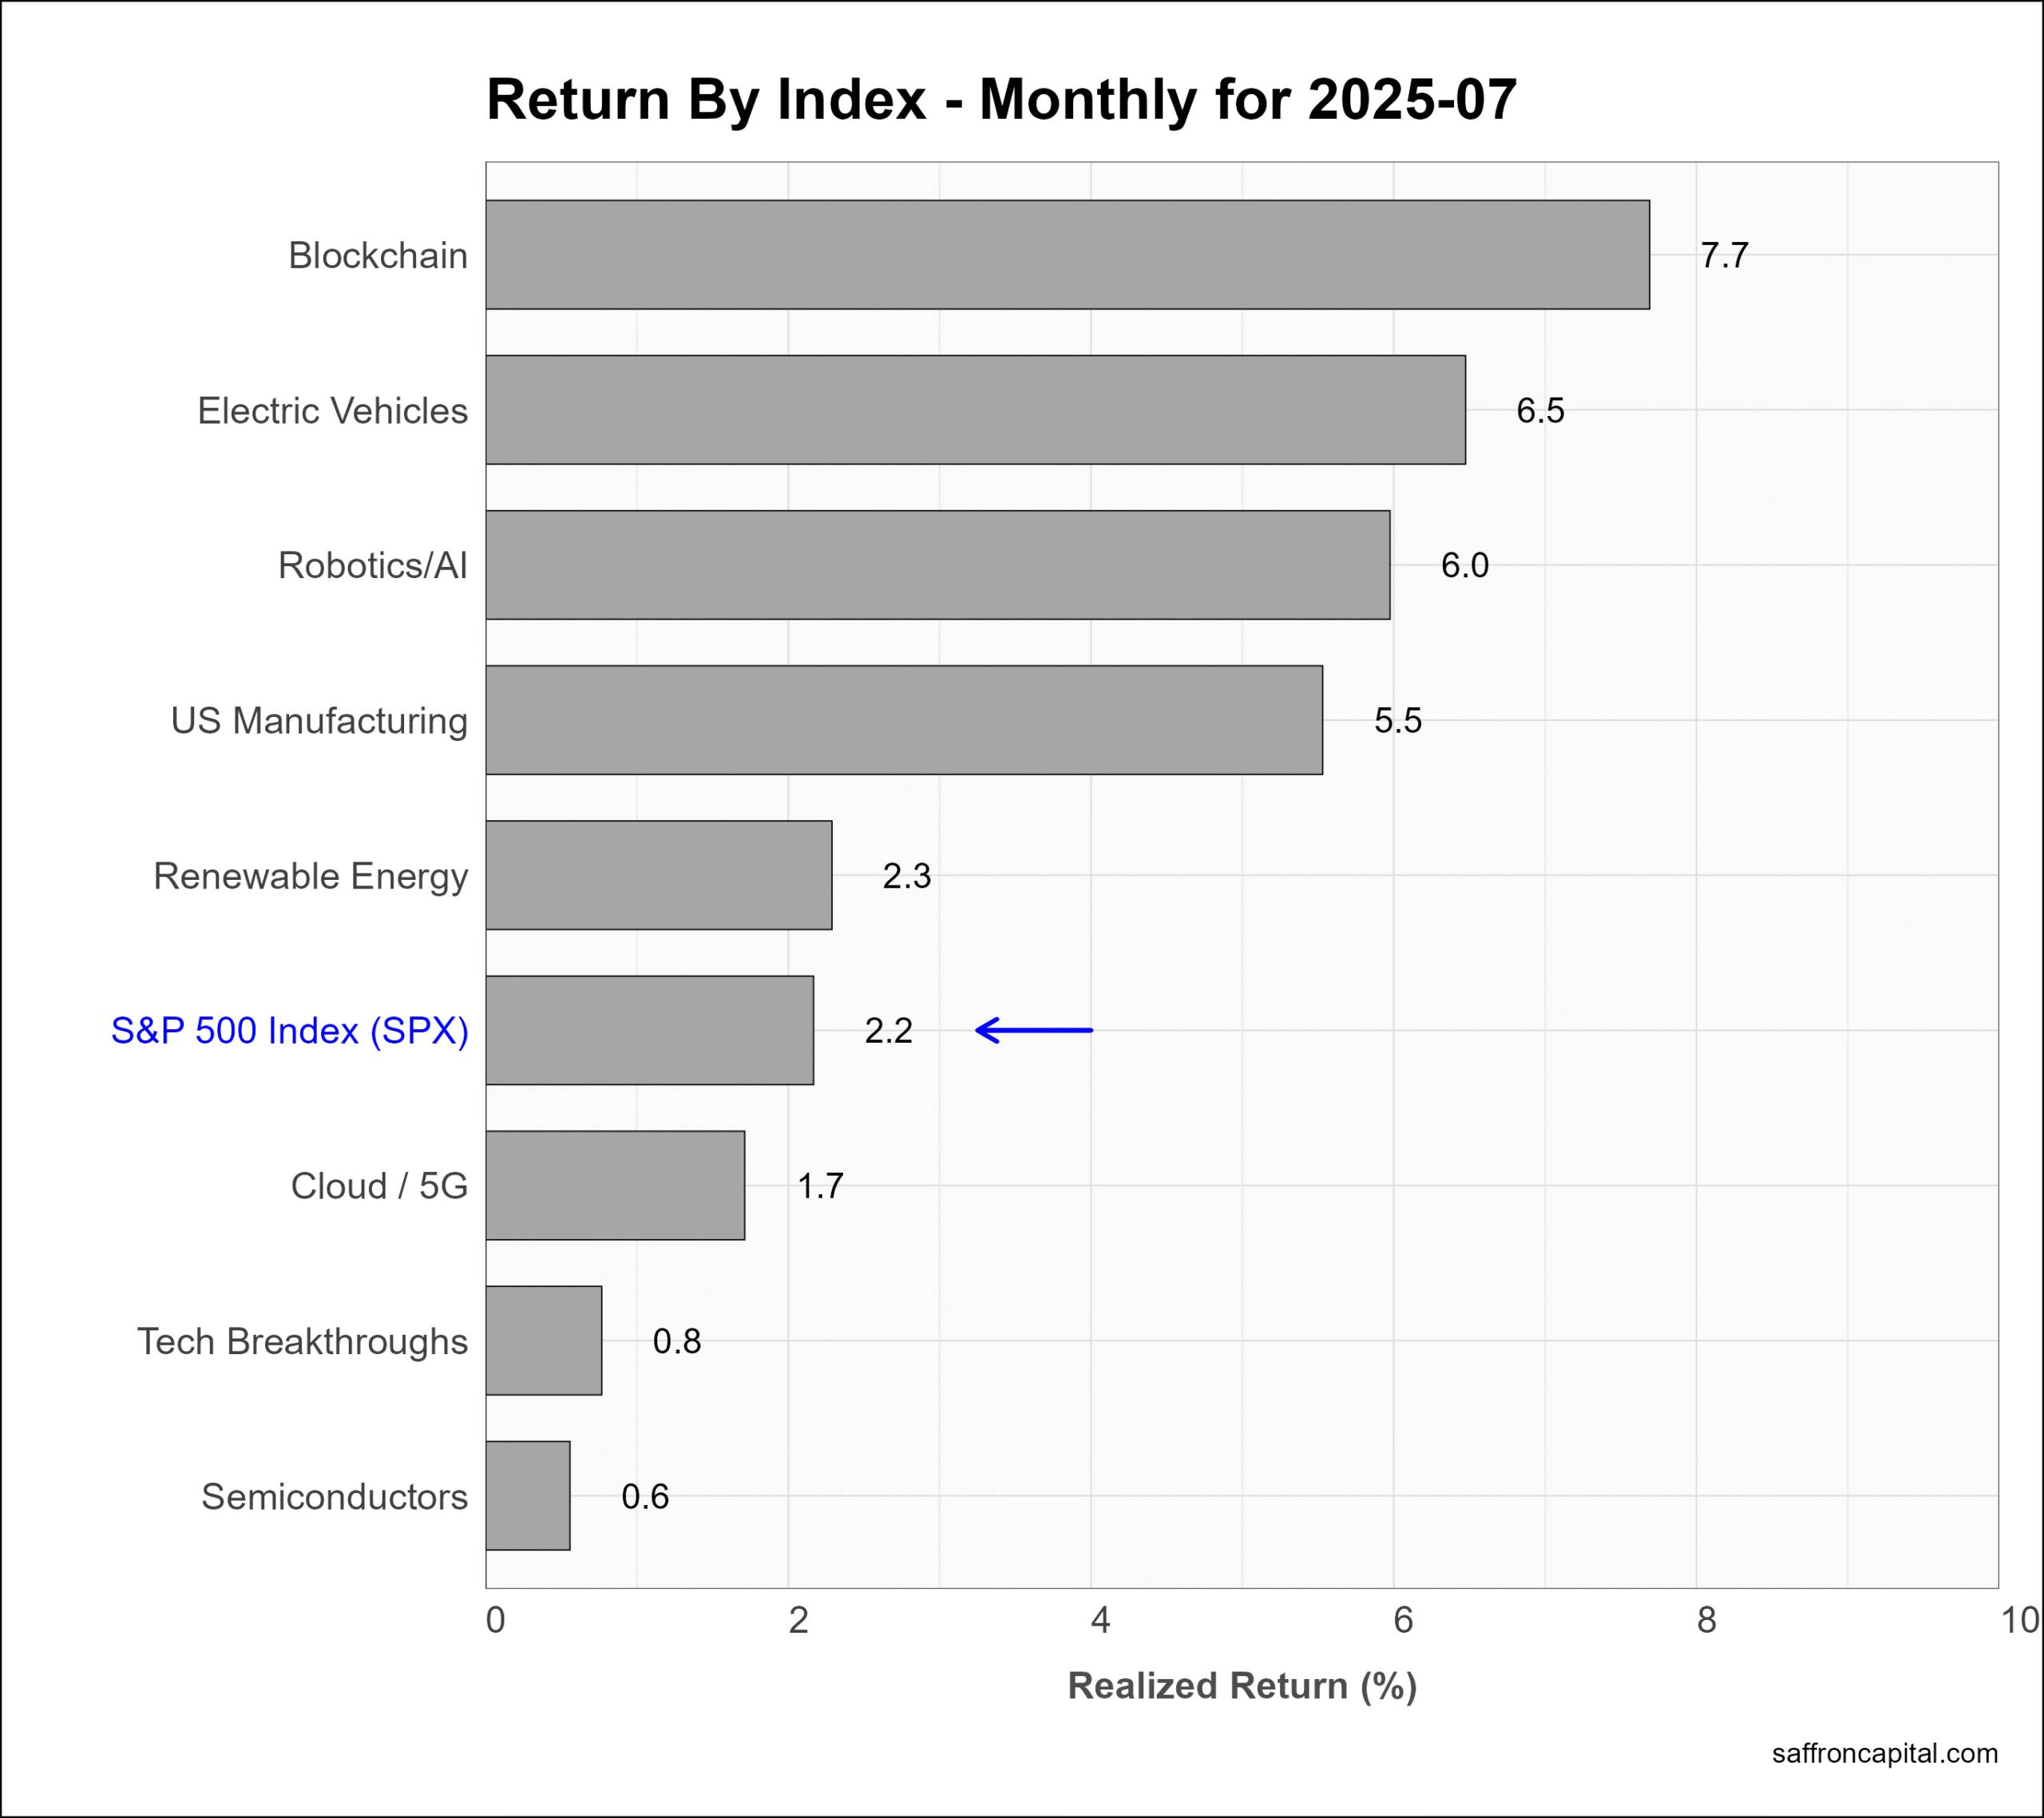
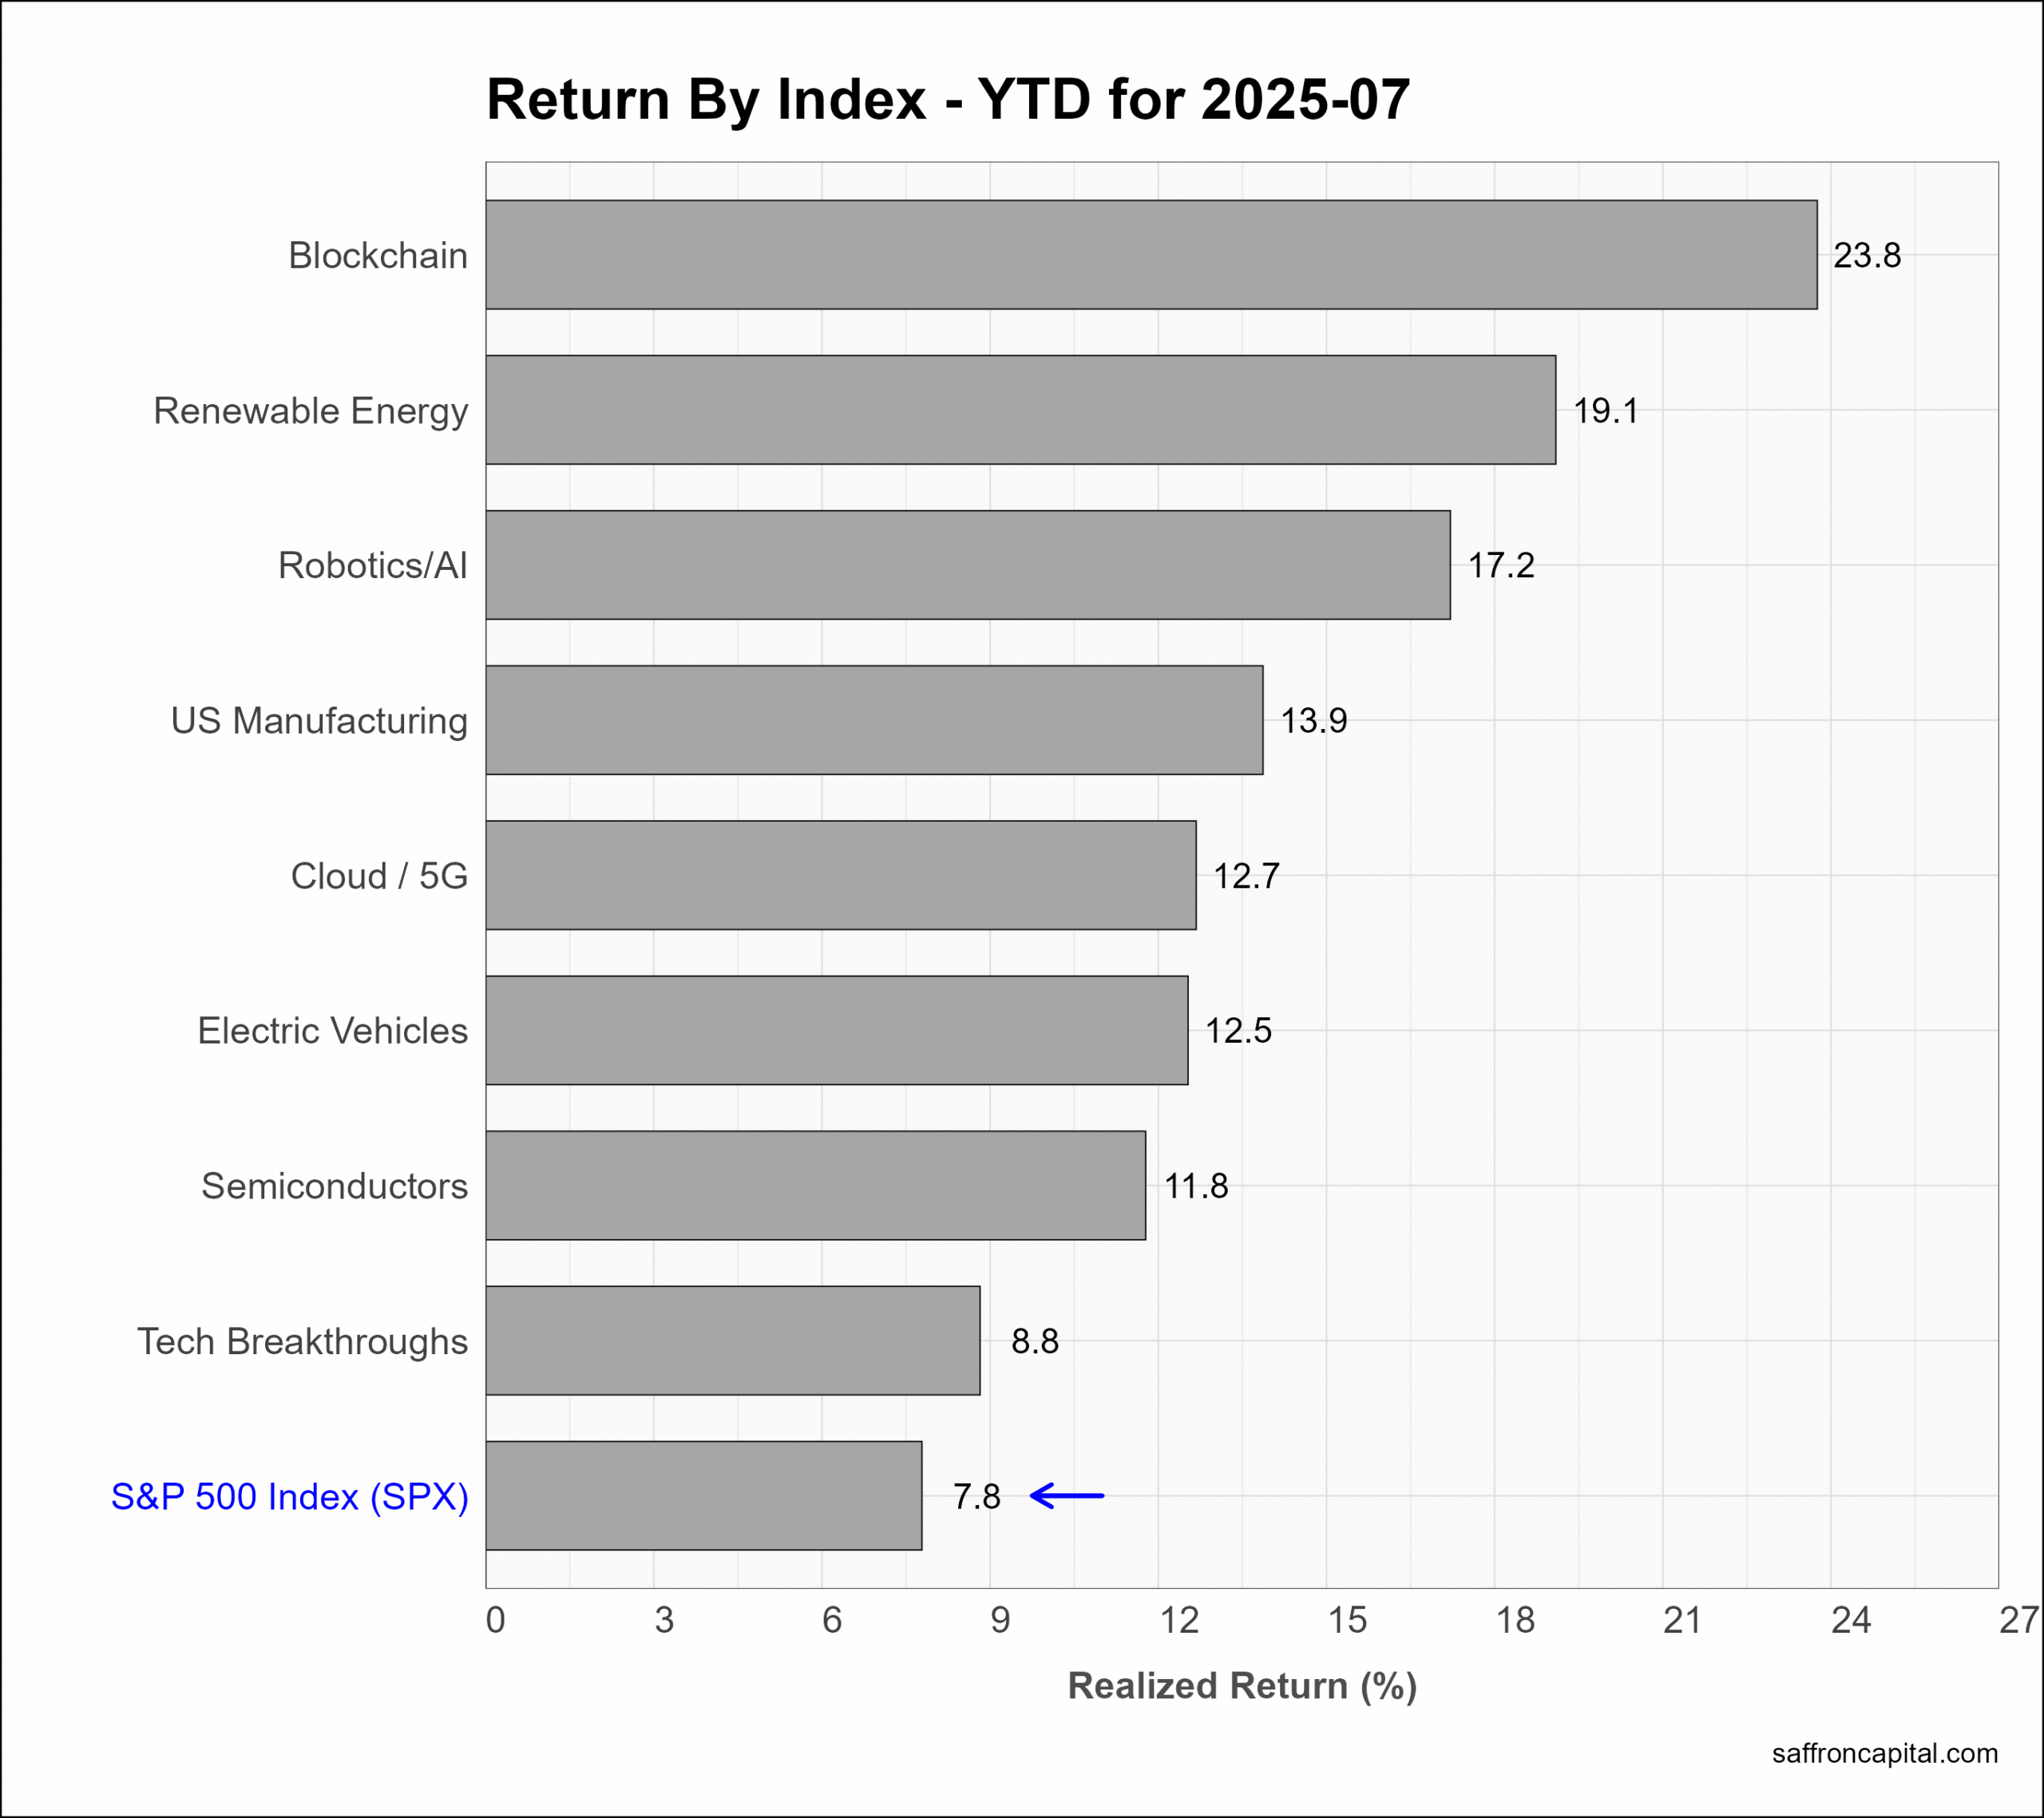
US Thematic Portfolios
US thematic portfolios are portfolios that seek to capture the primary growth trends of the U.S. economy. July returns were led by Blockchain shares (+7.7%), which was in th top spot last month as well. Semiconductors (+6.5%), Robotics/AI (+6.0%), and US Manufacturing (+5.5%) all put in solid gains. Since January, All the thematic portfolios are now outperforming the S&P 500 index. The top spot goes to Blockchain shares (+23.8%), followed by Renewable Energy (+19.1%) and Robitcs/AI (17.2%).
Click to enlarge
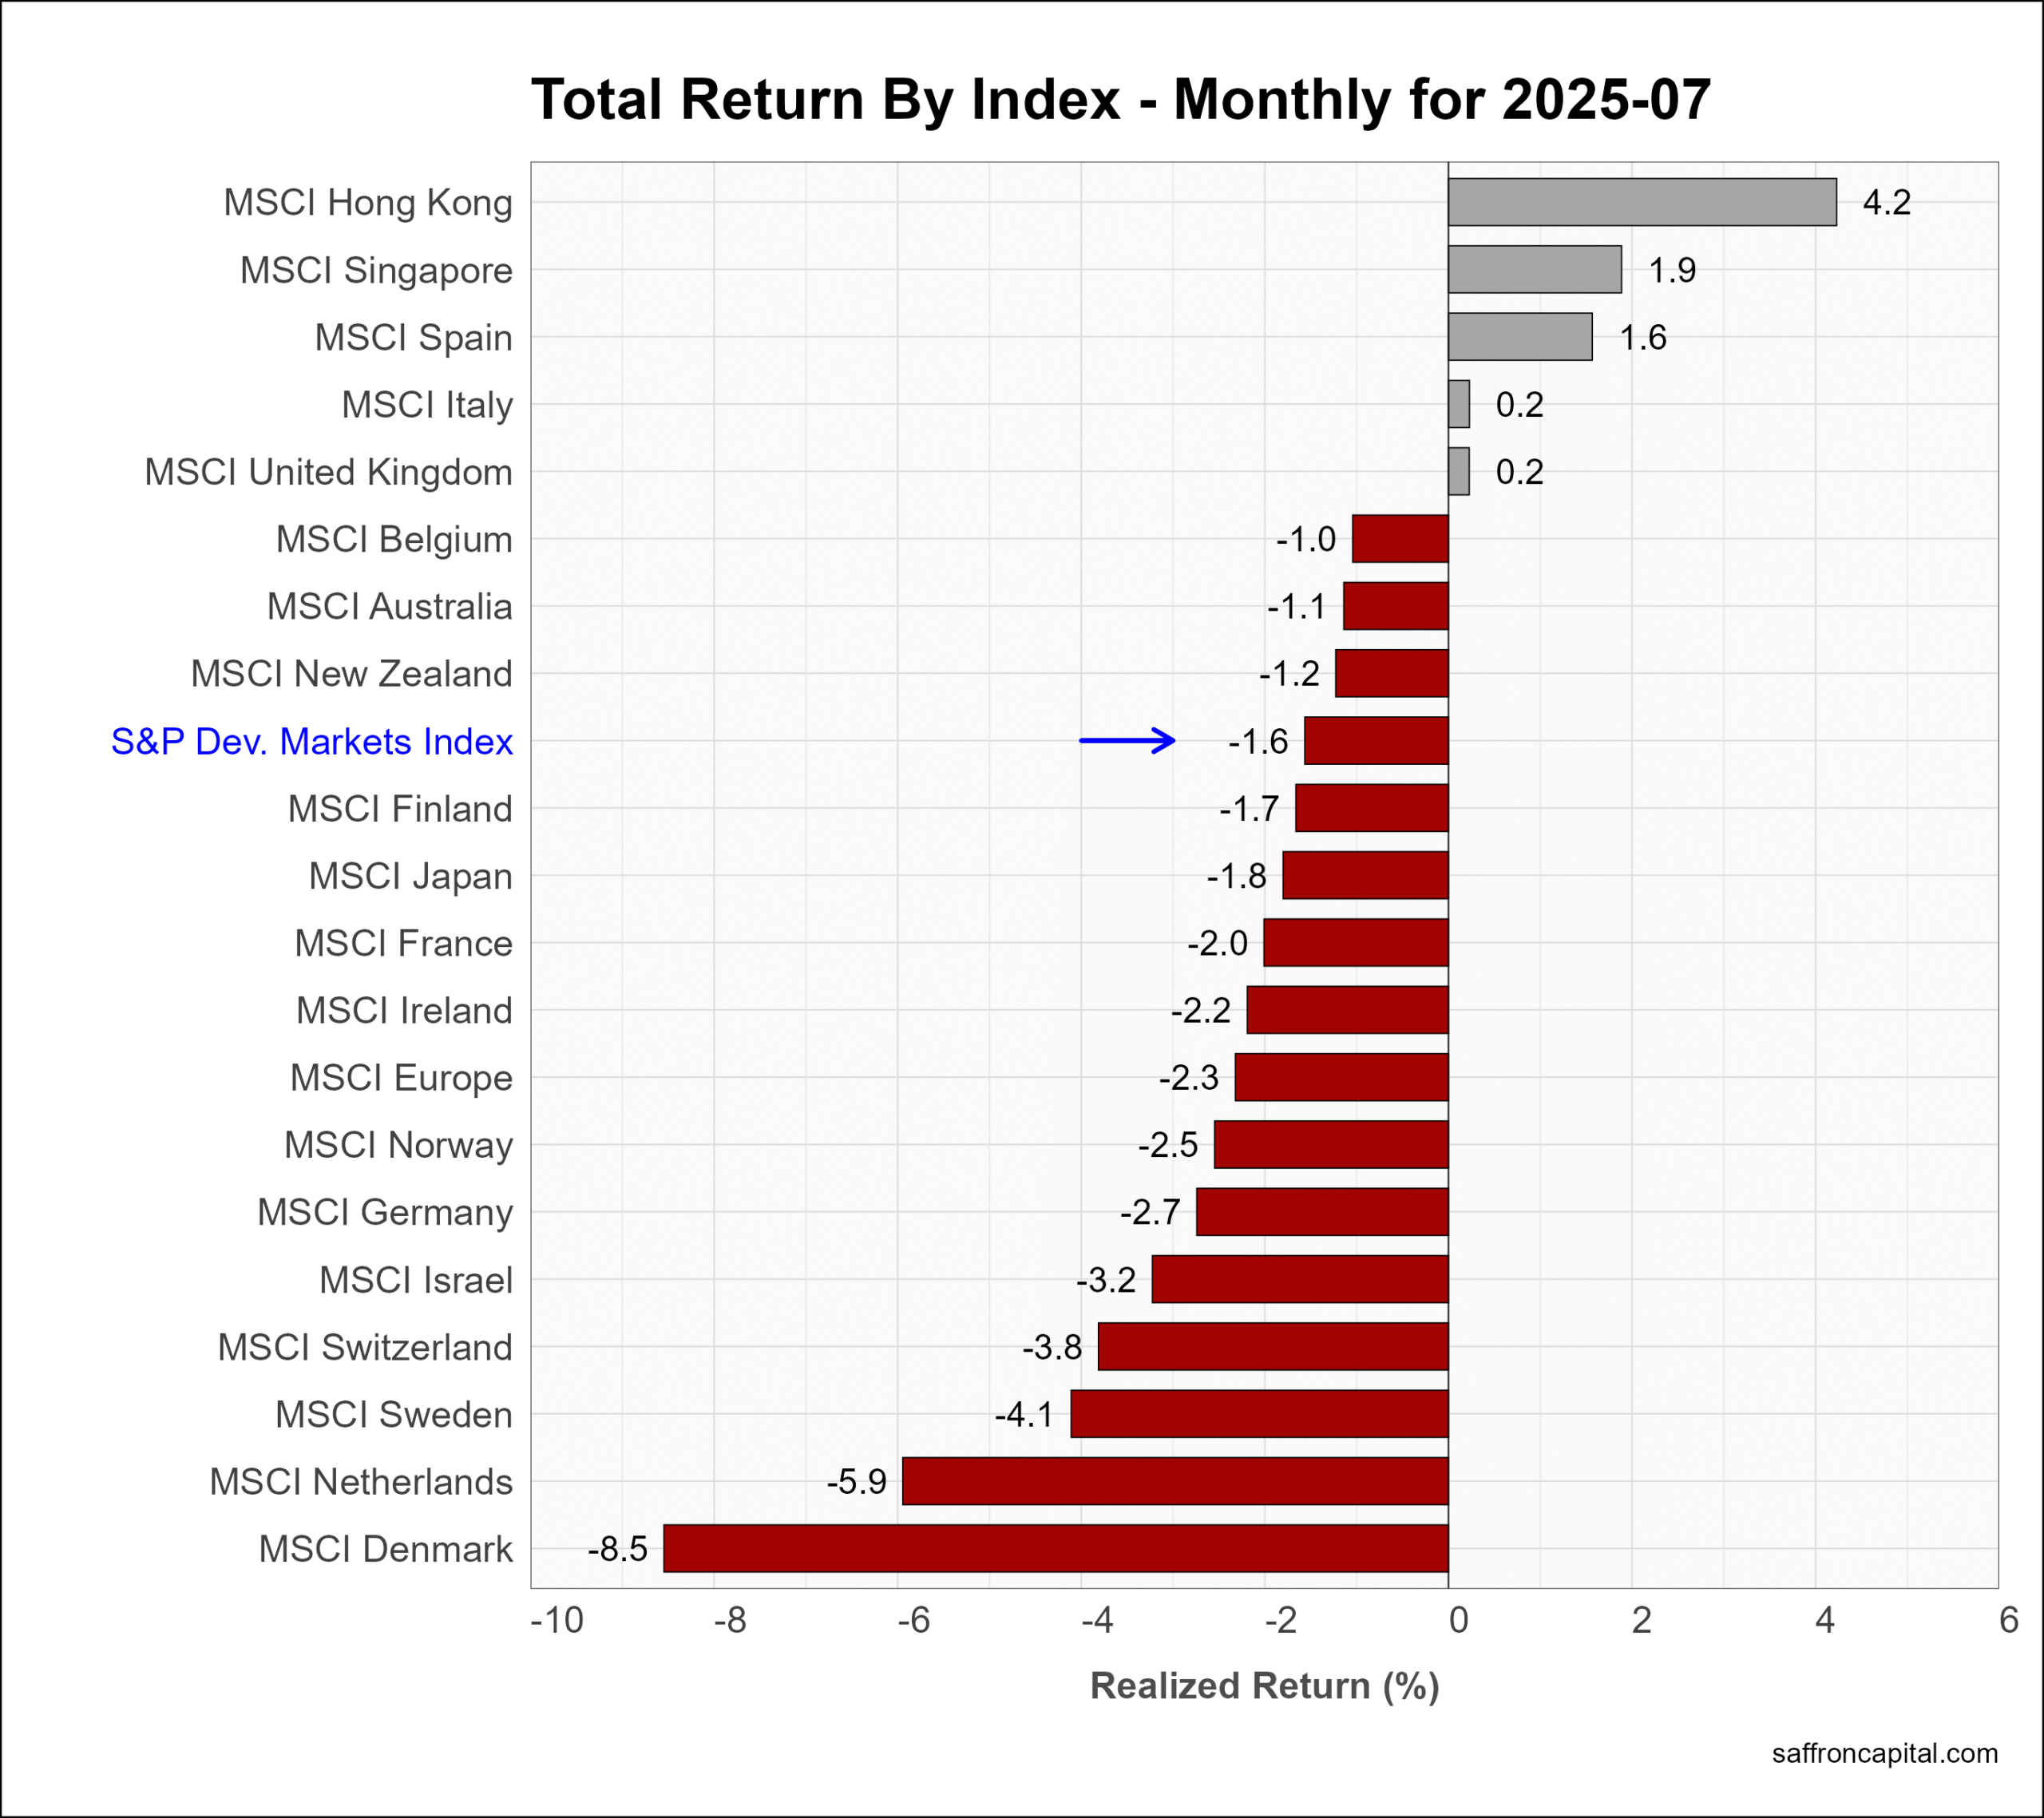
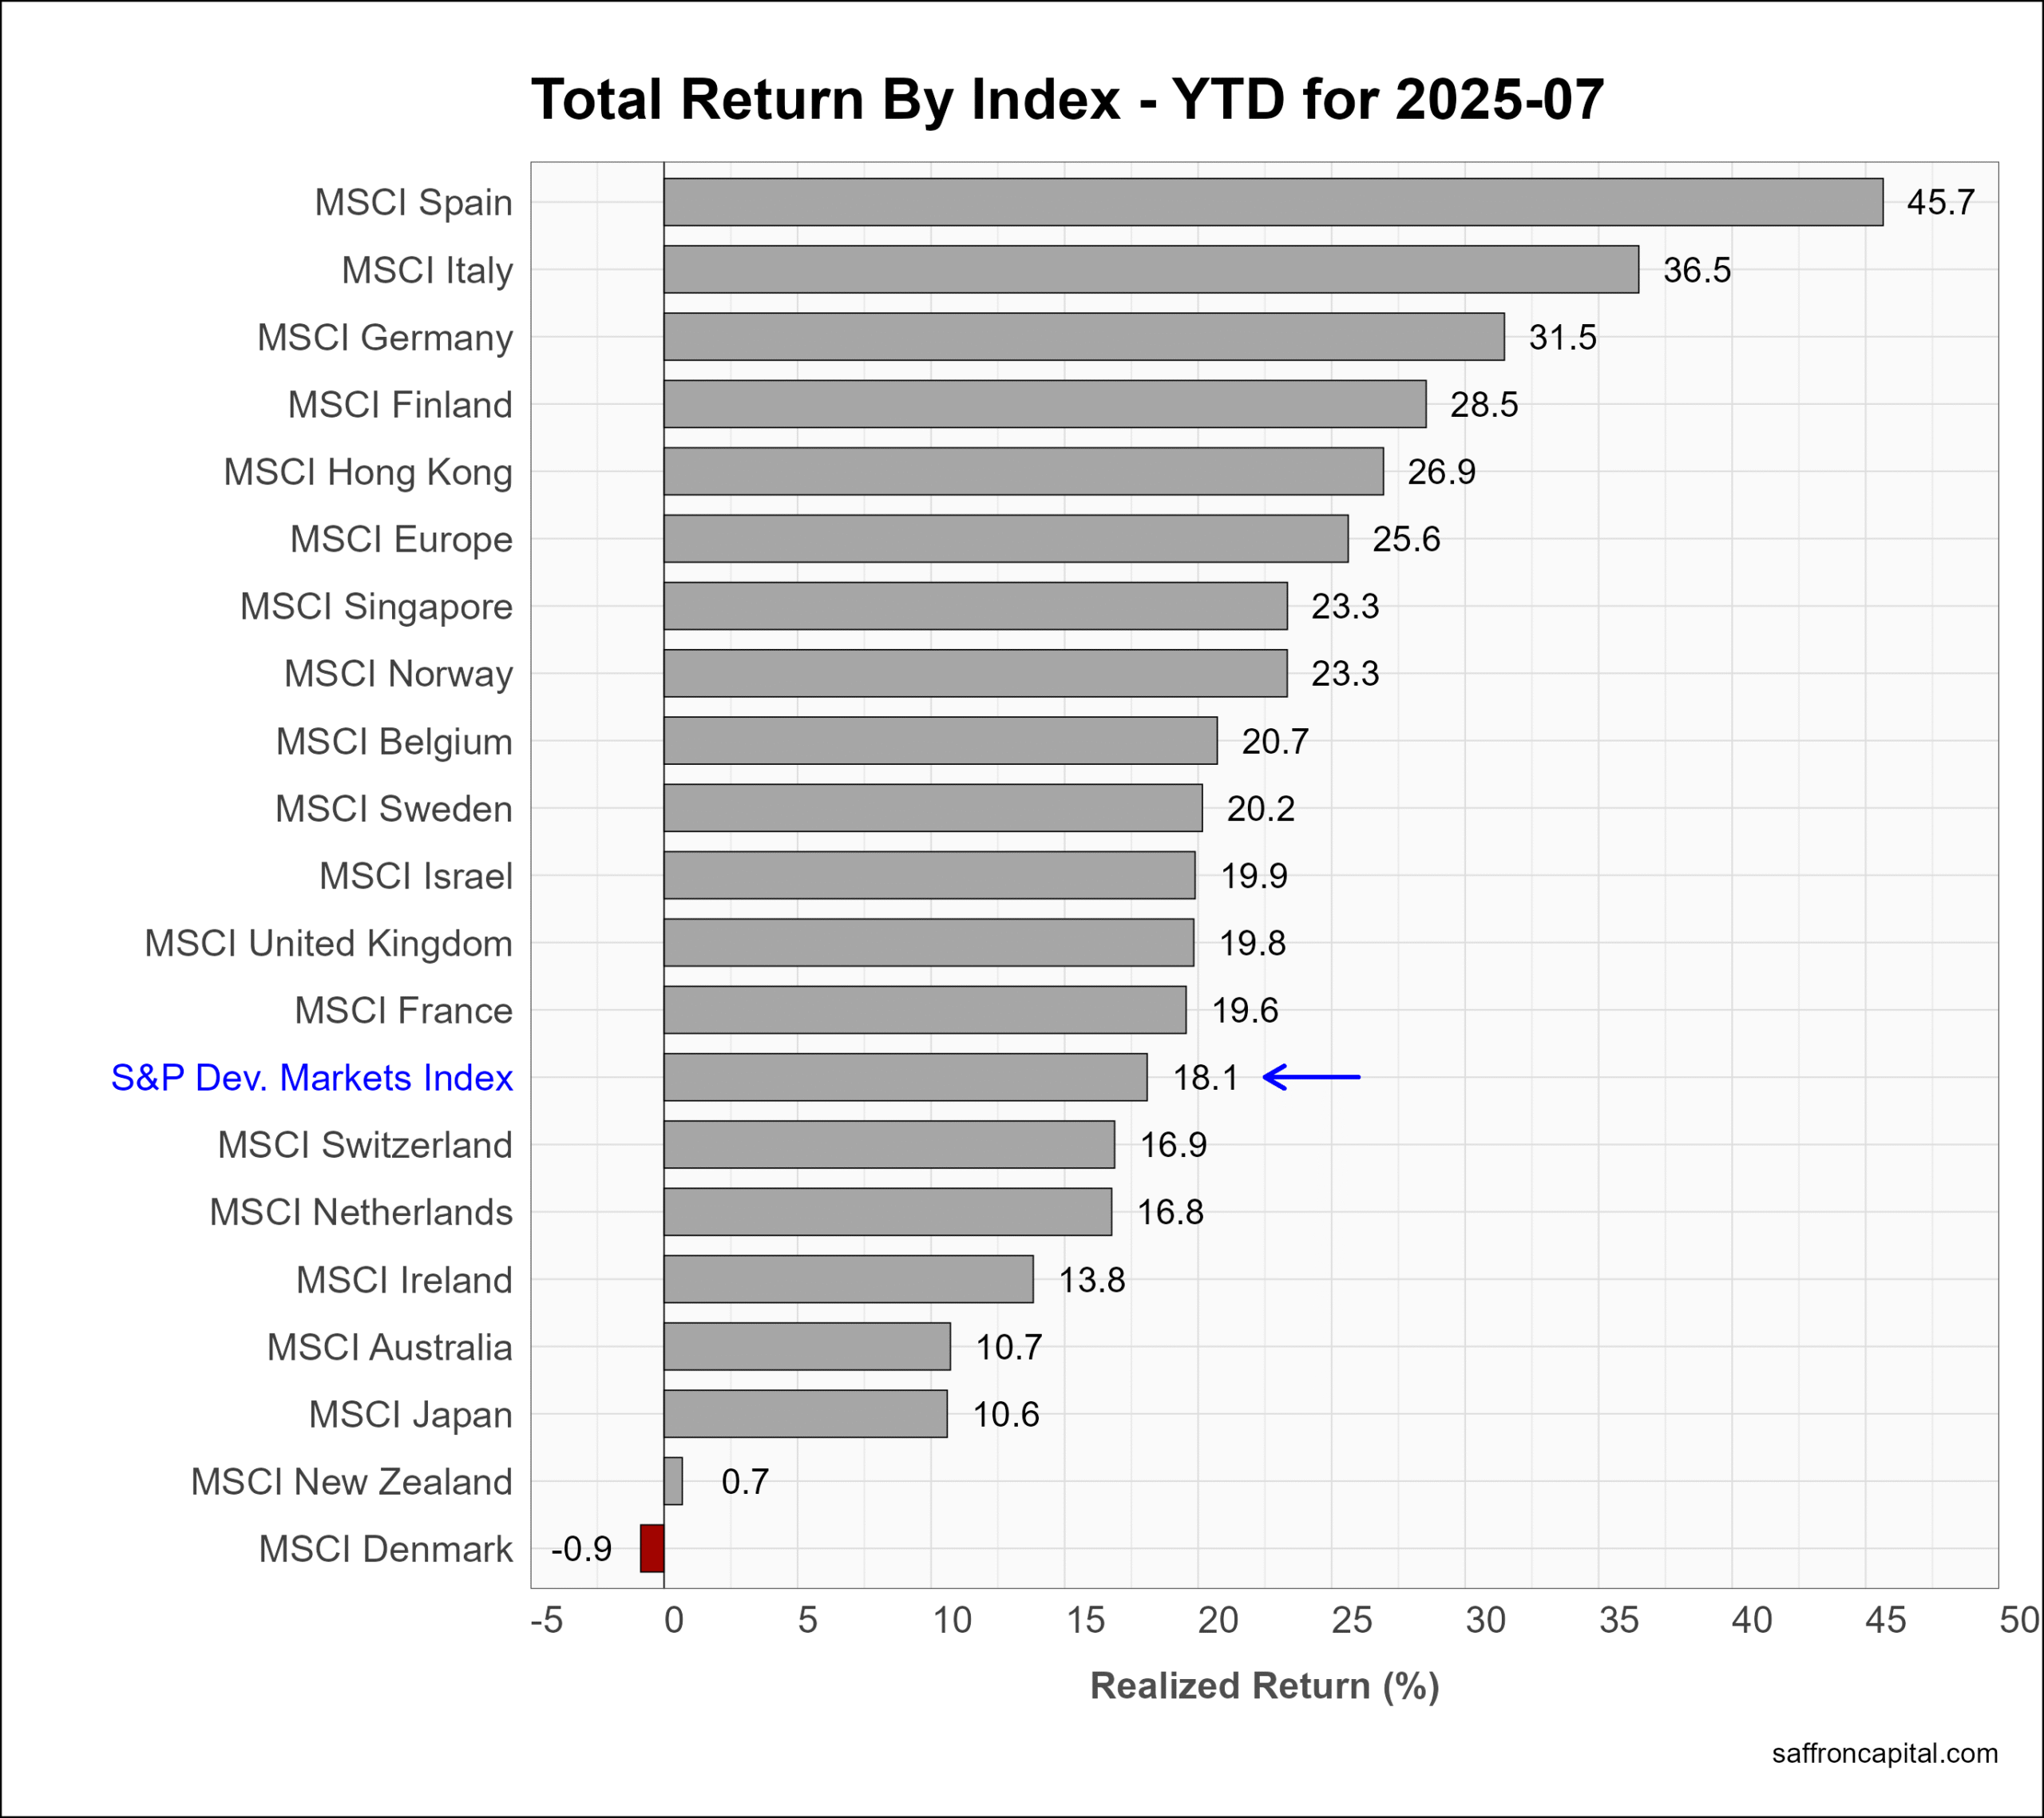
Developed Market Equities
International Developed Markets index (-1.6%) had negative returns owing to a string US Dollar in July. However, MSCI Hong Kong (+4.2%) was not only positive, but outperformed most world markets, including the US. EU markets (-2.3%) were particularly hard hit, notably Denmark (-8.5%) and the Netherlands. However, European shares continue to lead the annual scoreboard, topped by Spain (+45.7%), Italy (+36.5%) and Germany (+31.5%).
Click to enlarge
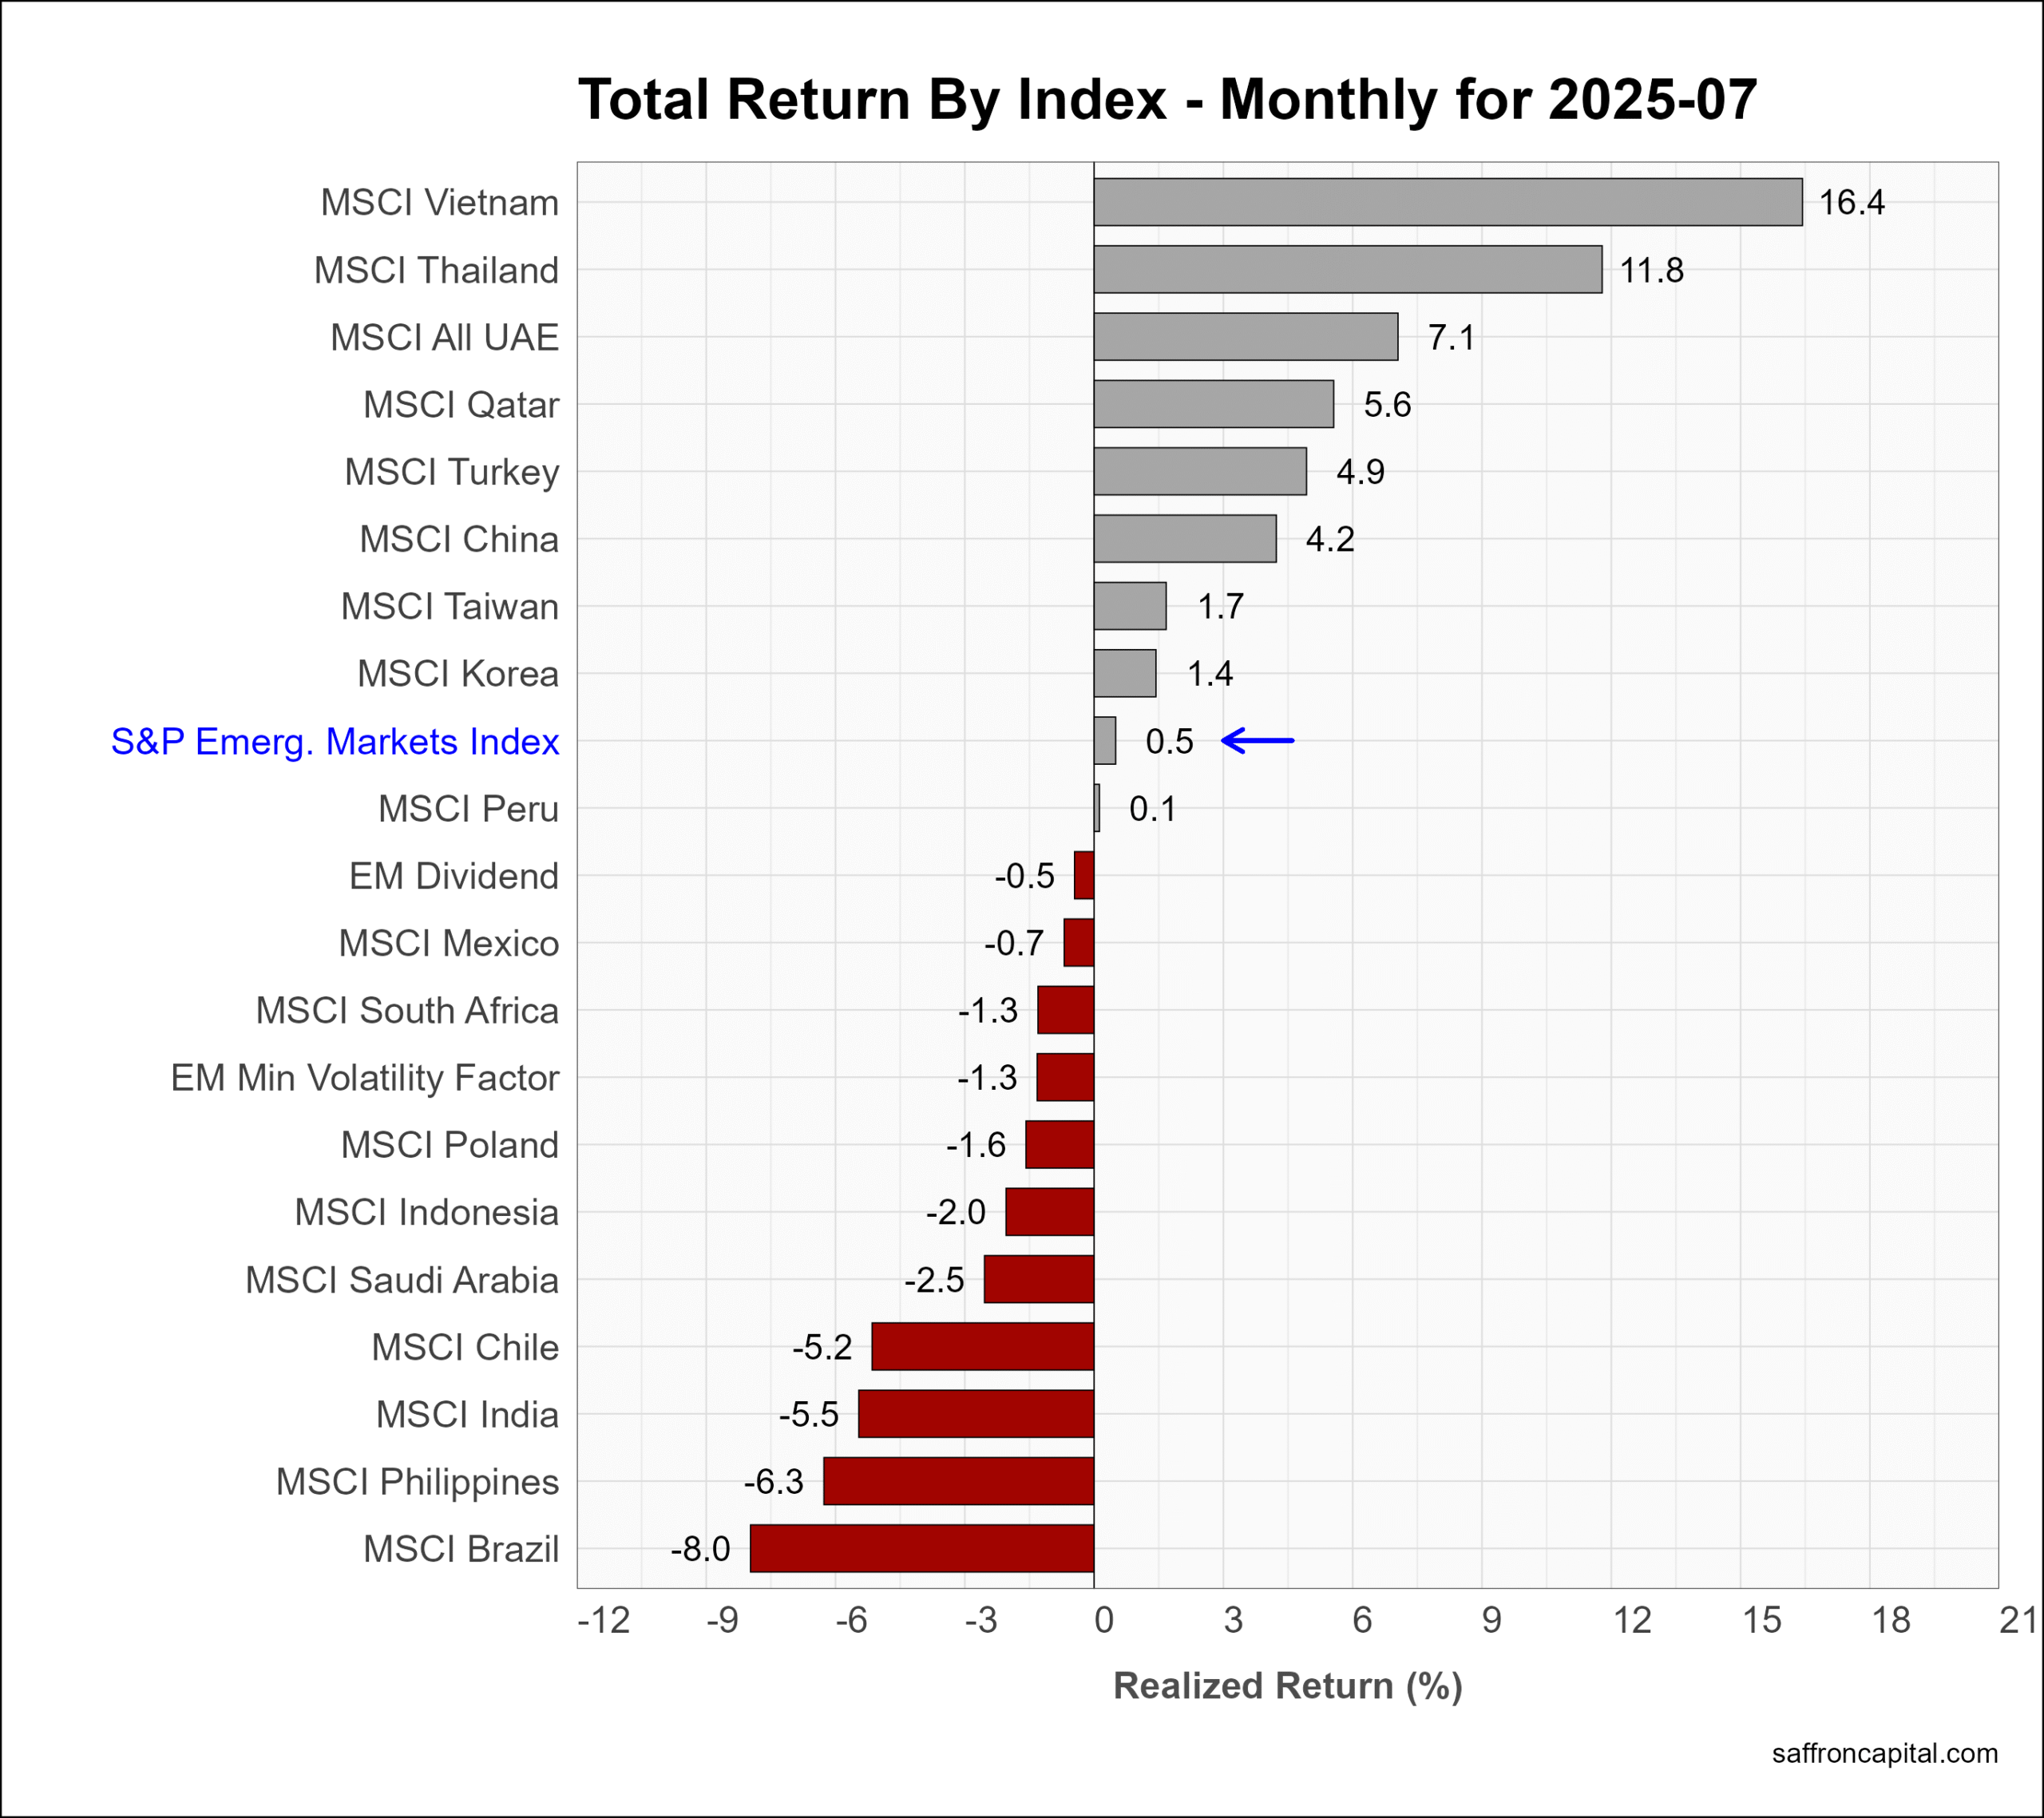
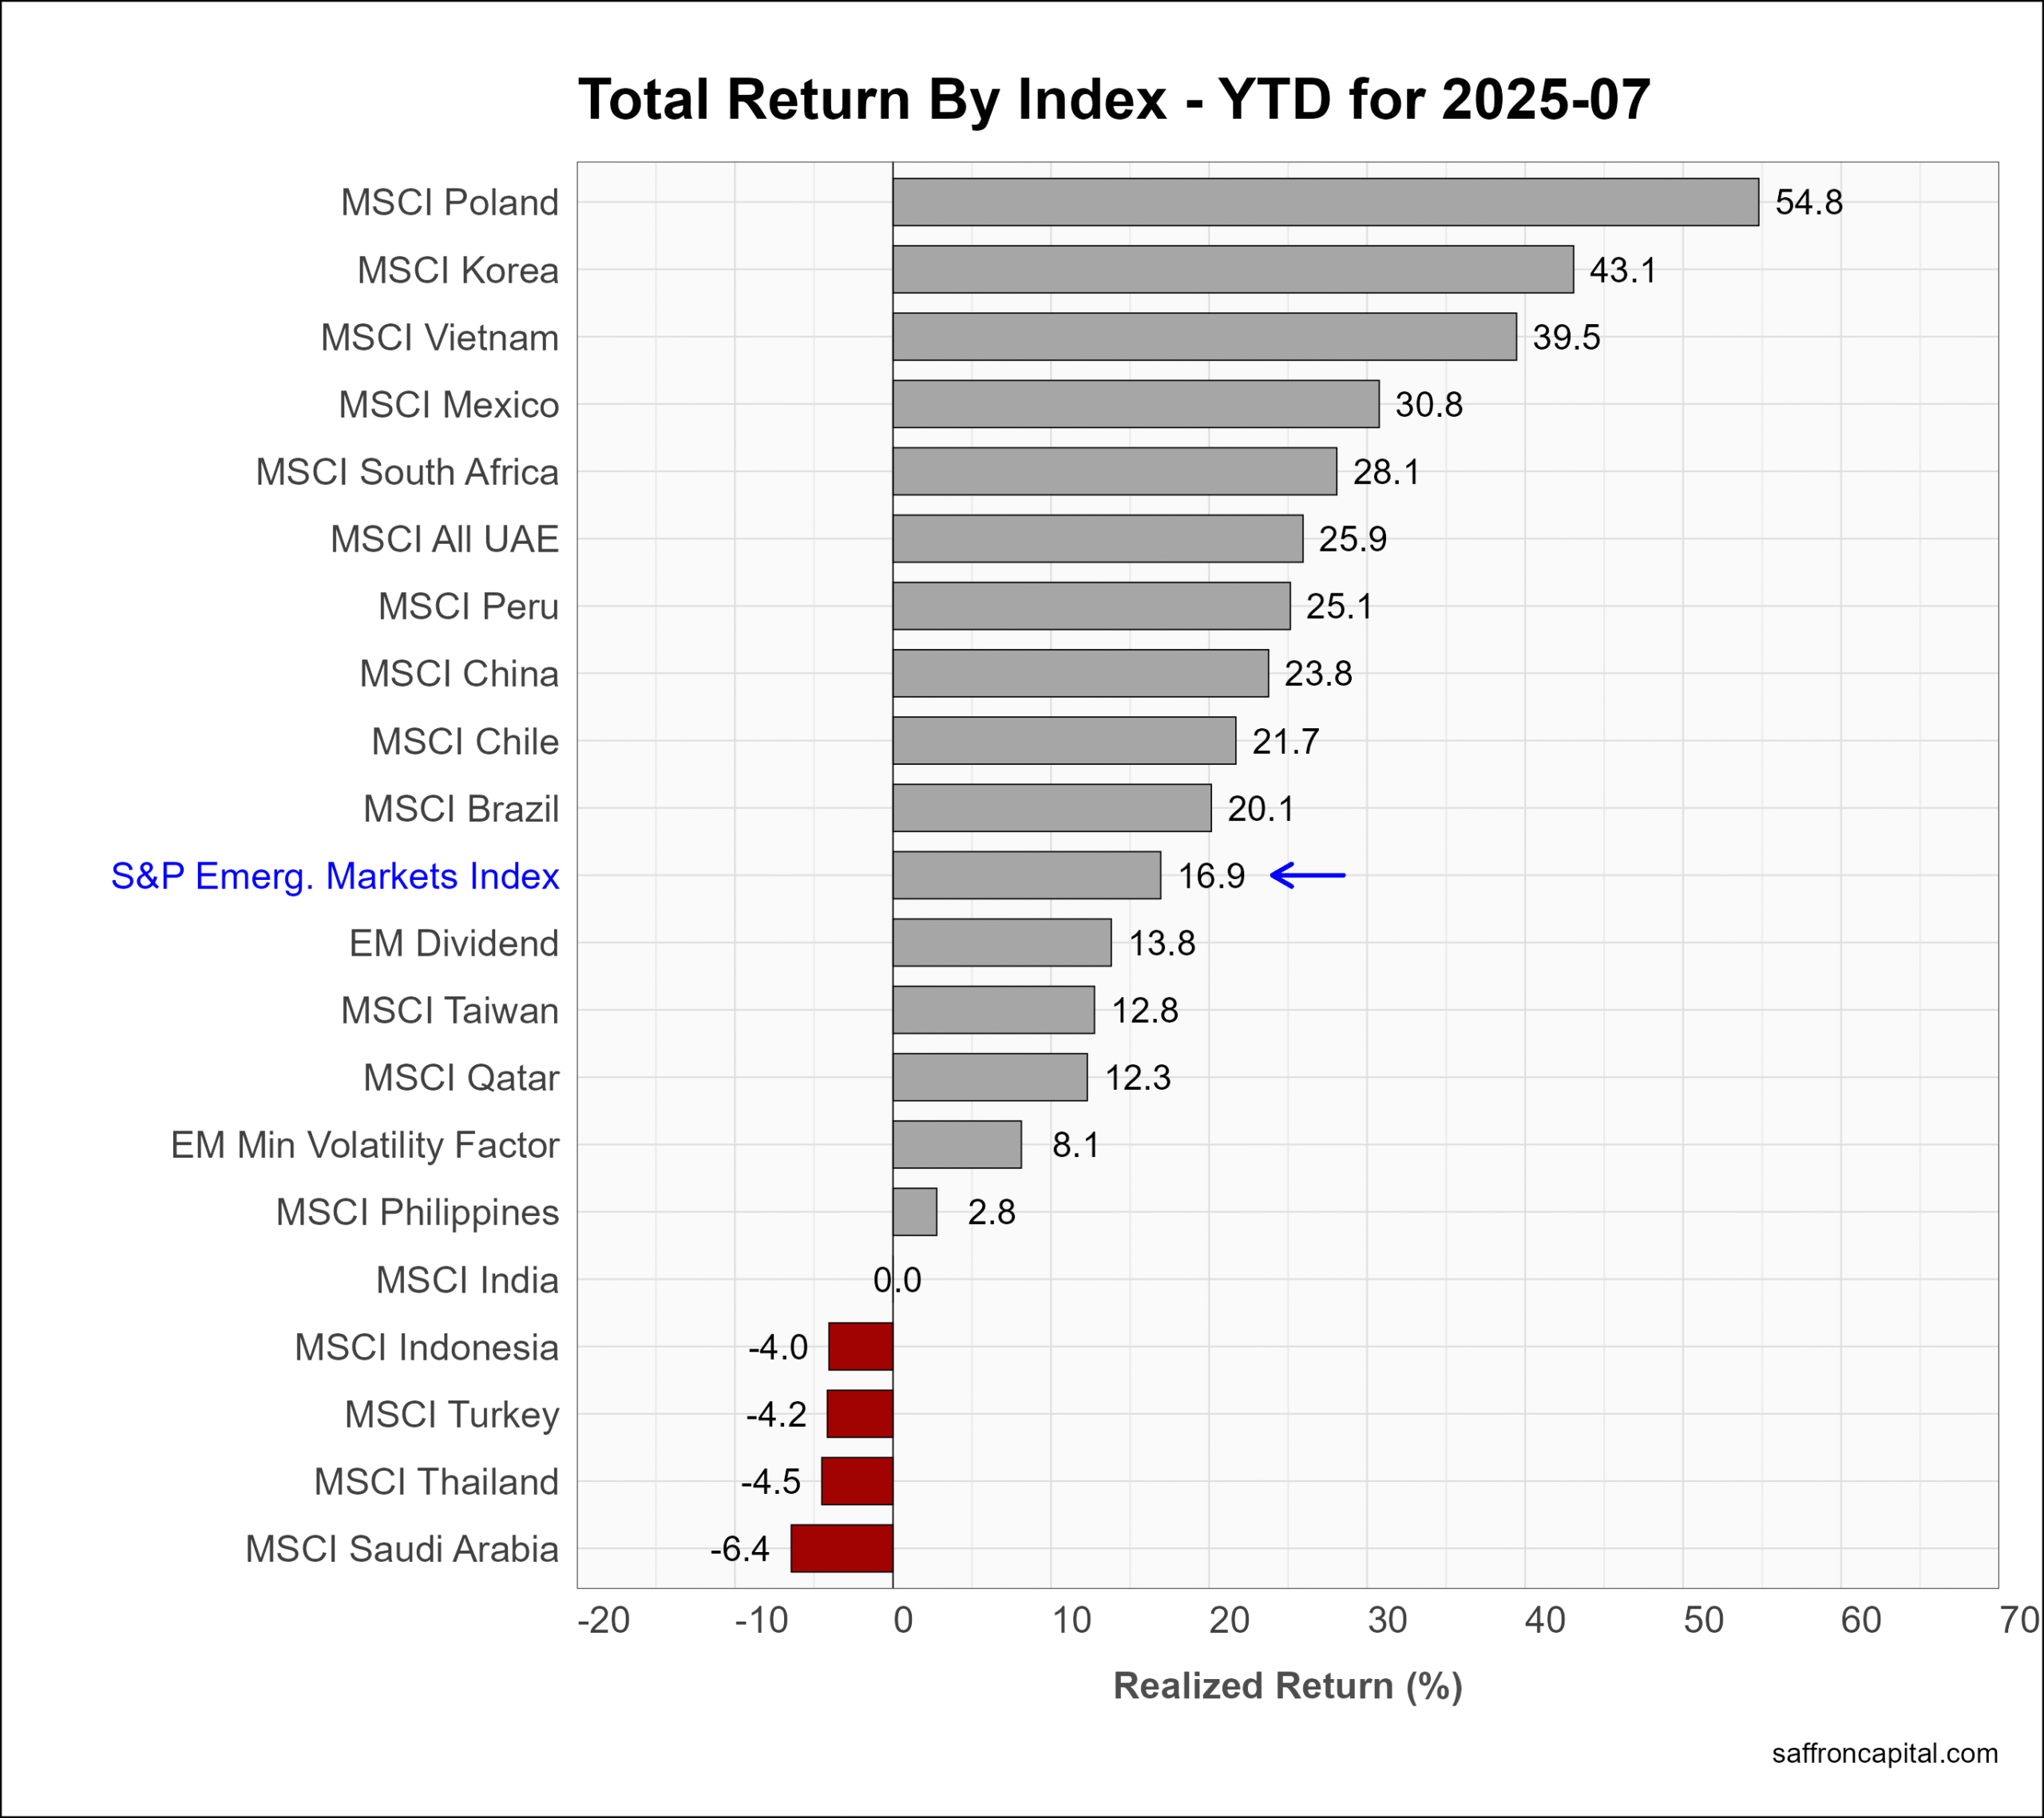
Emerging Market Equities
The S&P Emerging Markets Index (+0.5%) masked a wide range of results in July. Vietnam (+16.4%), Thailand (+11.8%) and the UAE (+7.1%) lead the emerging economies, while Brazil (-8.0%), the Philippines (-6.3%), and India (-5.5%) all saw losses. Over the first seven months, Poland (+54.8%) was the best performing market, followed by Korea (+43.1%), and Vietnam (+39.5%).
Click to enlarge
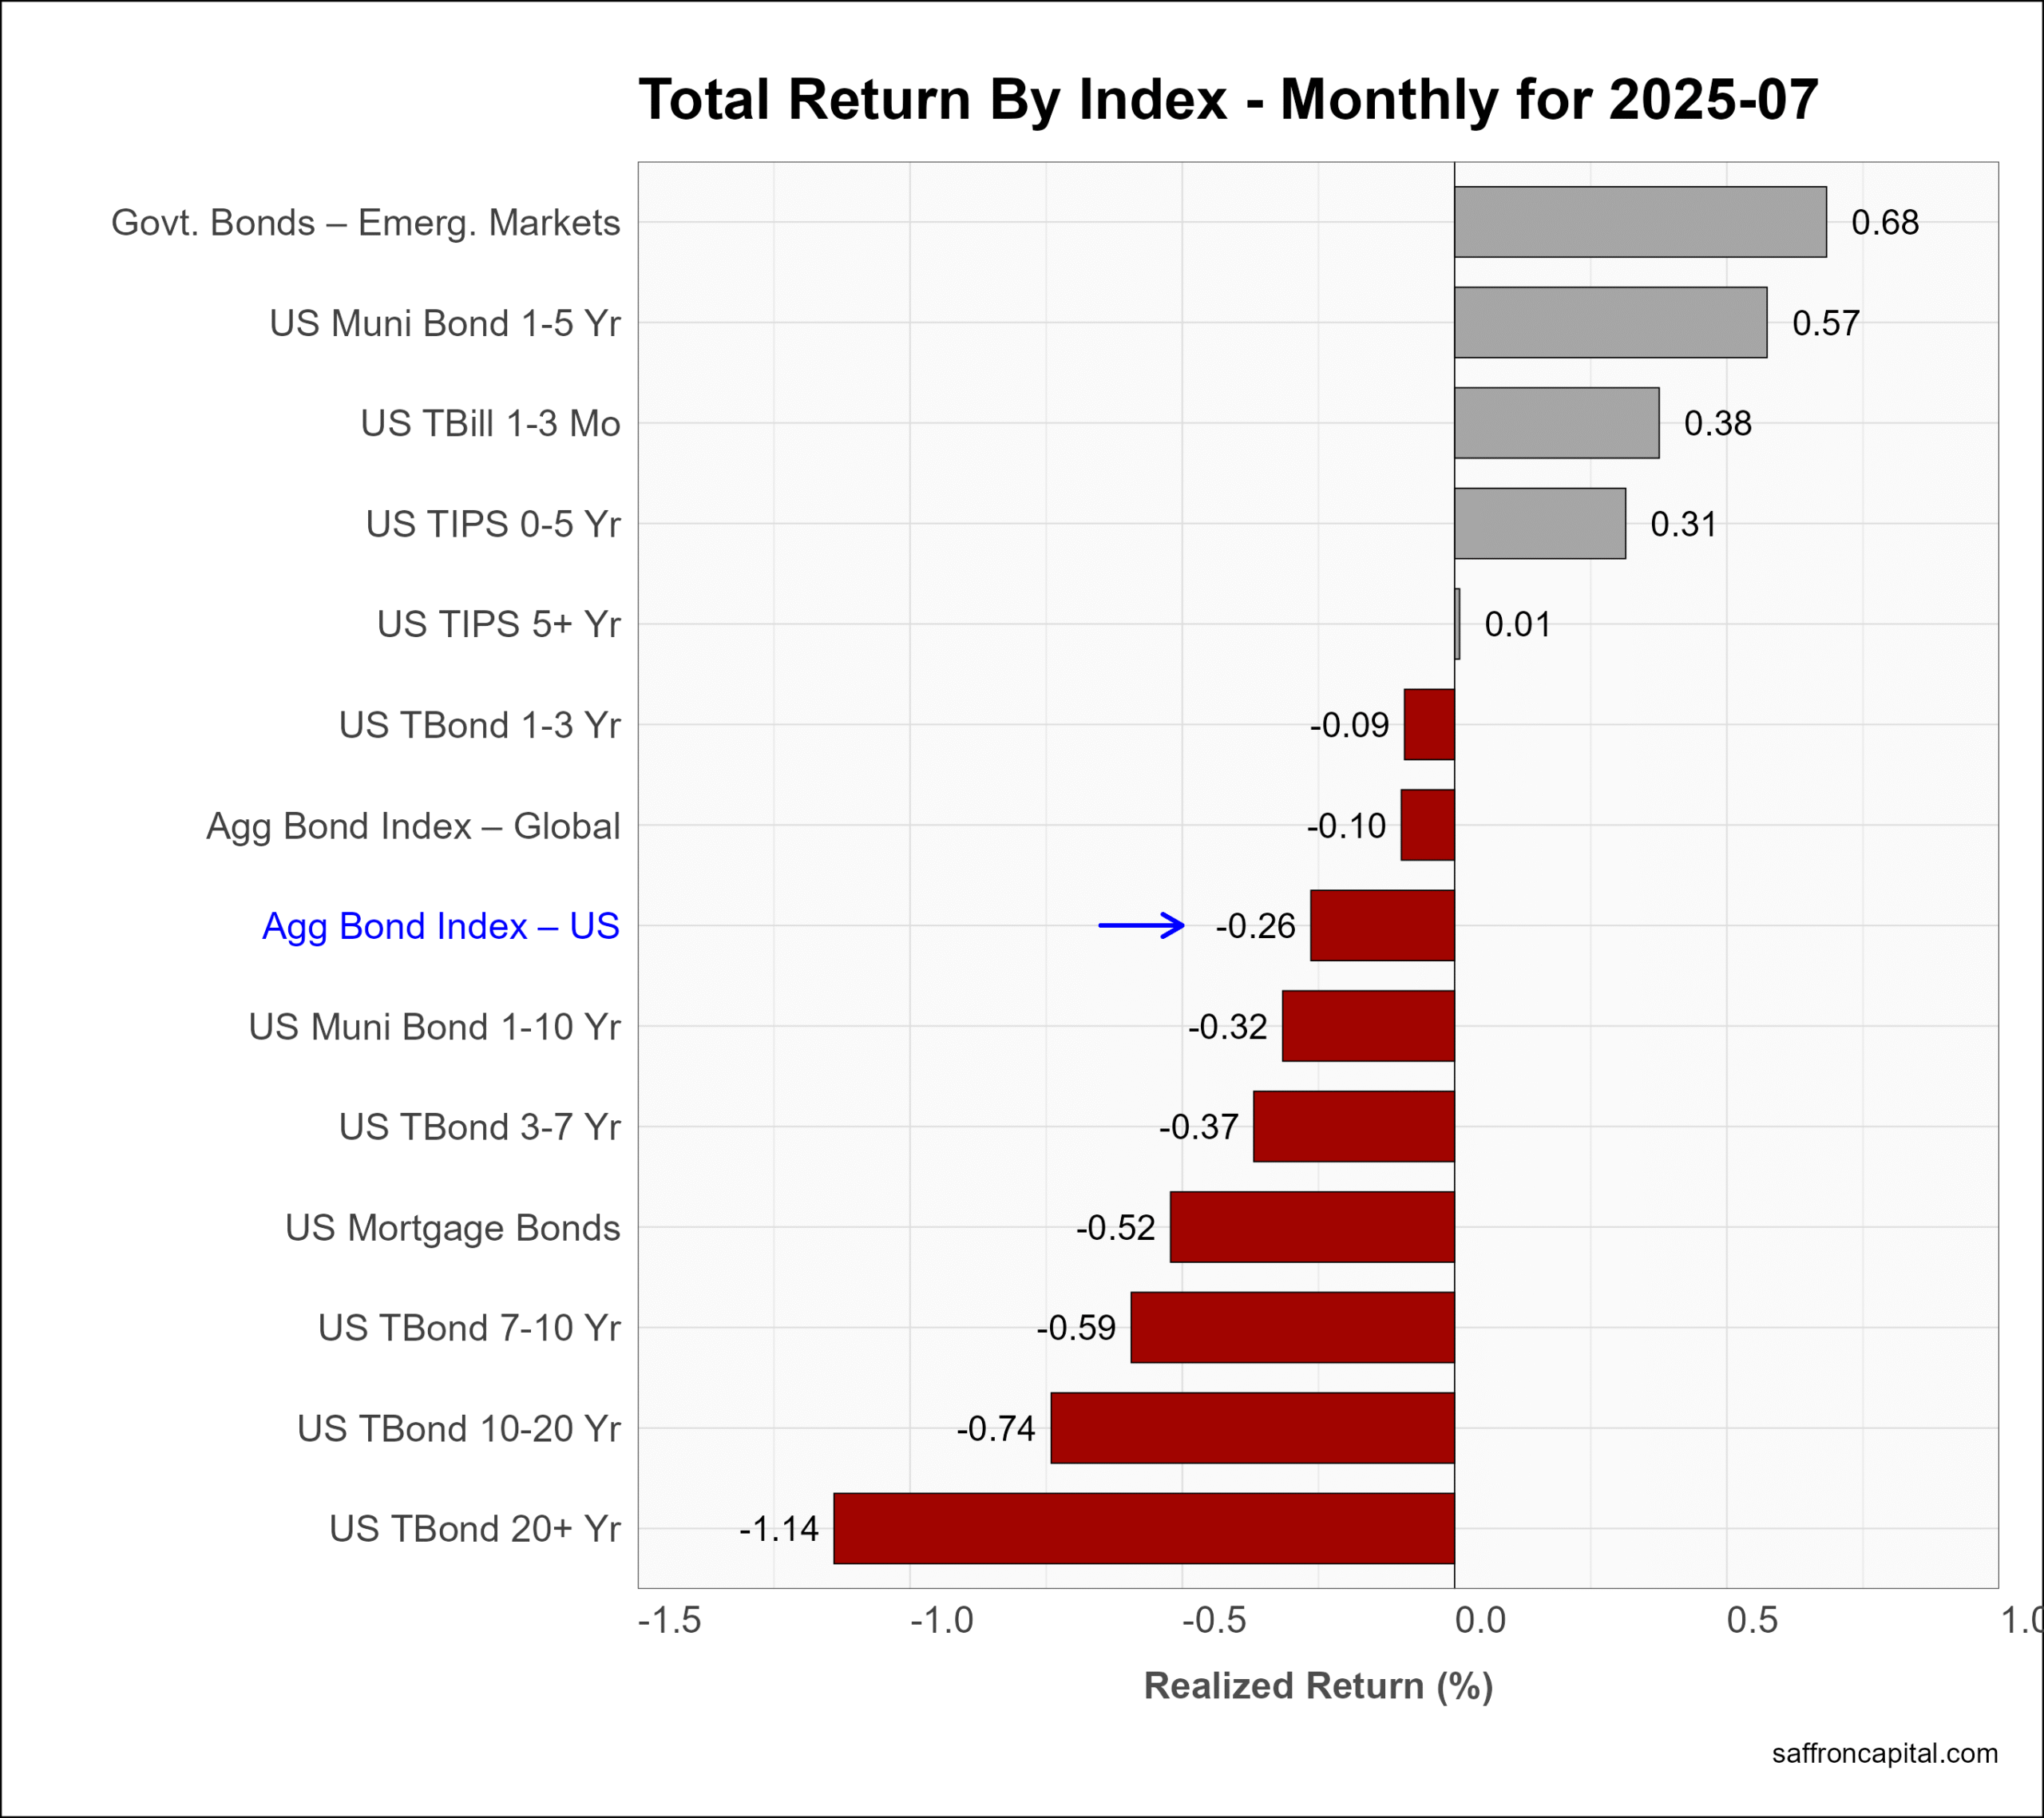
Government Bonds
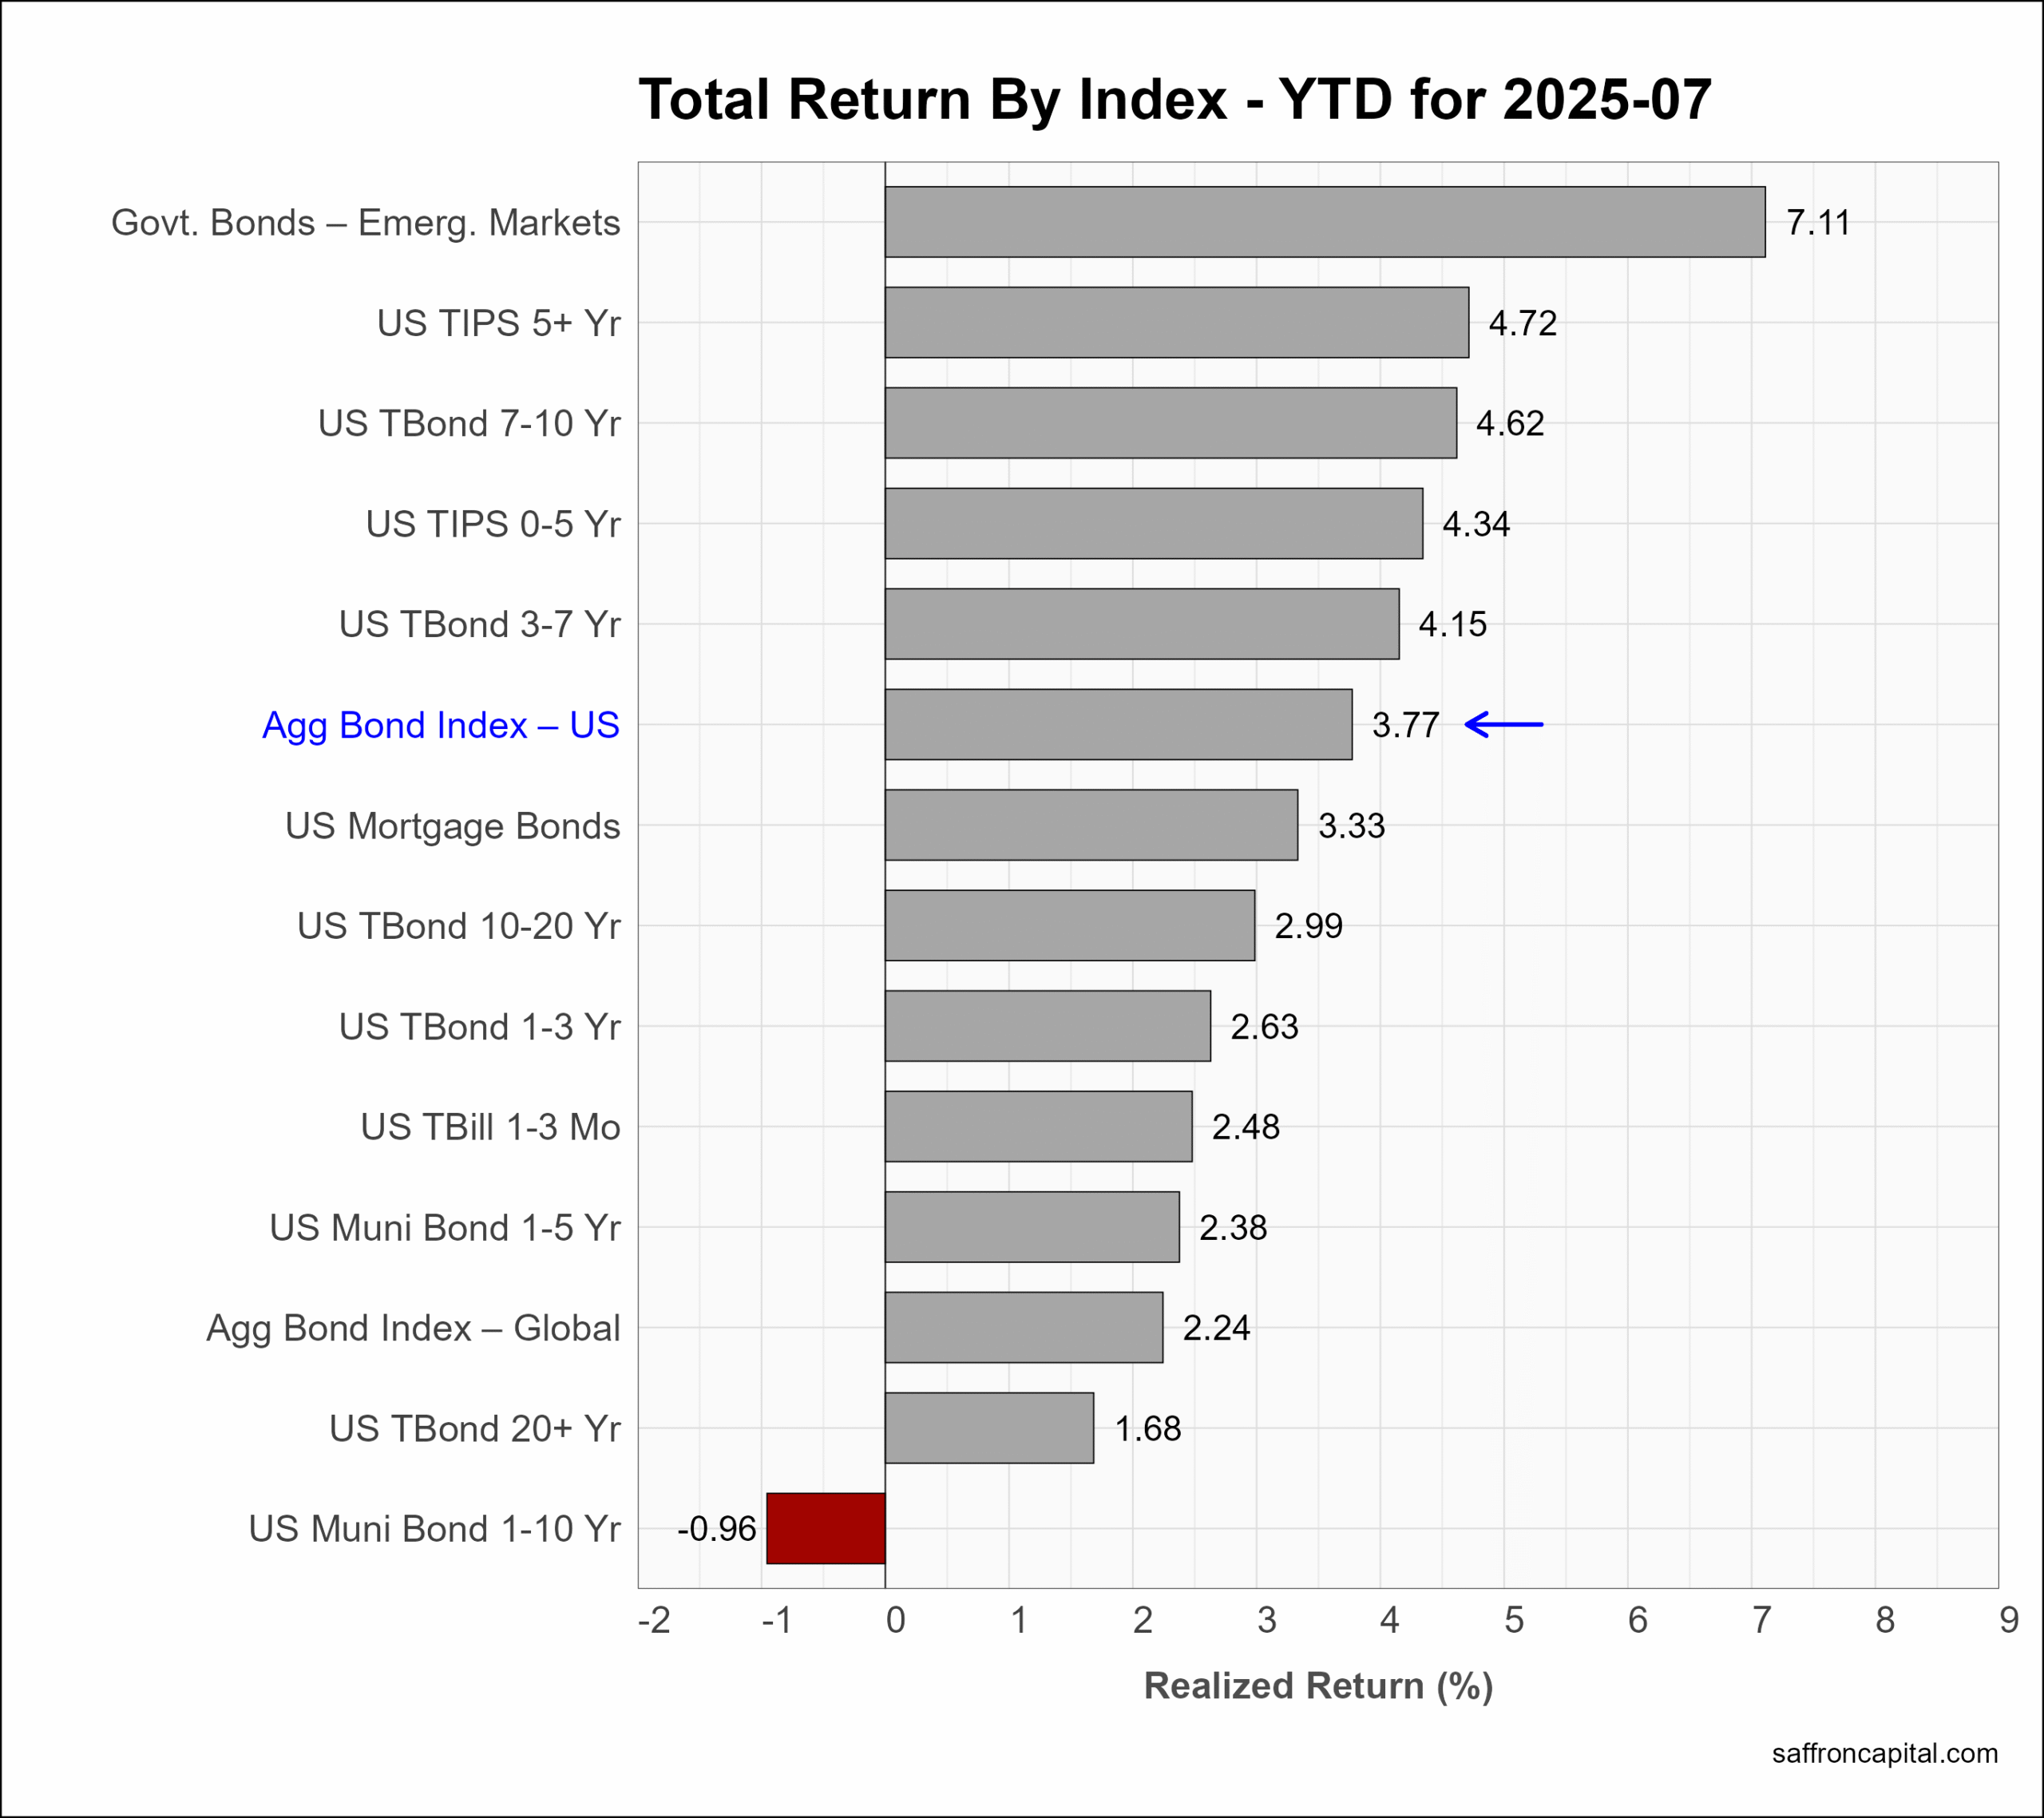
During July, the yield-to-maturity on the 10-year Treasury Note spiked to 4.49% before settling at 4.38%. As a result, the US Aggregate Bond Index (+0.26%) was unchanged. Notwithstanding, US yield curve steepening was observed 2Y Treasury Notes (-0.9%) outperforming 20+Y T-Bonds (-1.14%). The strongest returns year-to-date belong to Emerging Market government bonds (+7.11%) and long duration US Treasury Inflation Protected Securities (+4.72%). Over the same period, the Aggregate US Bond index (+3.77%) continues to lag US stocks.
Click to enlarge
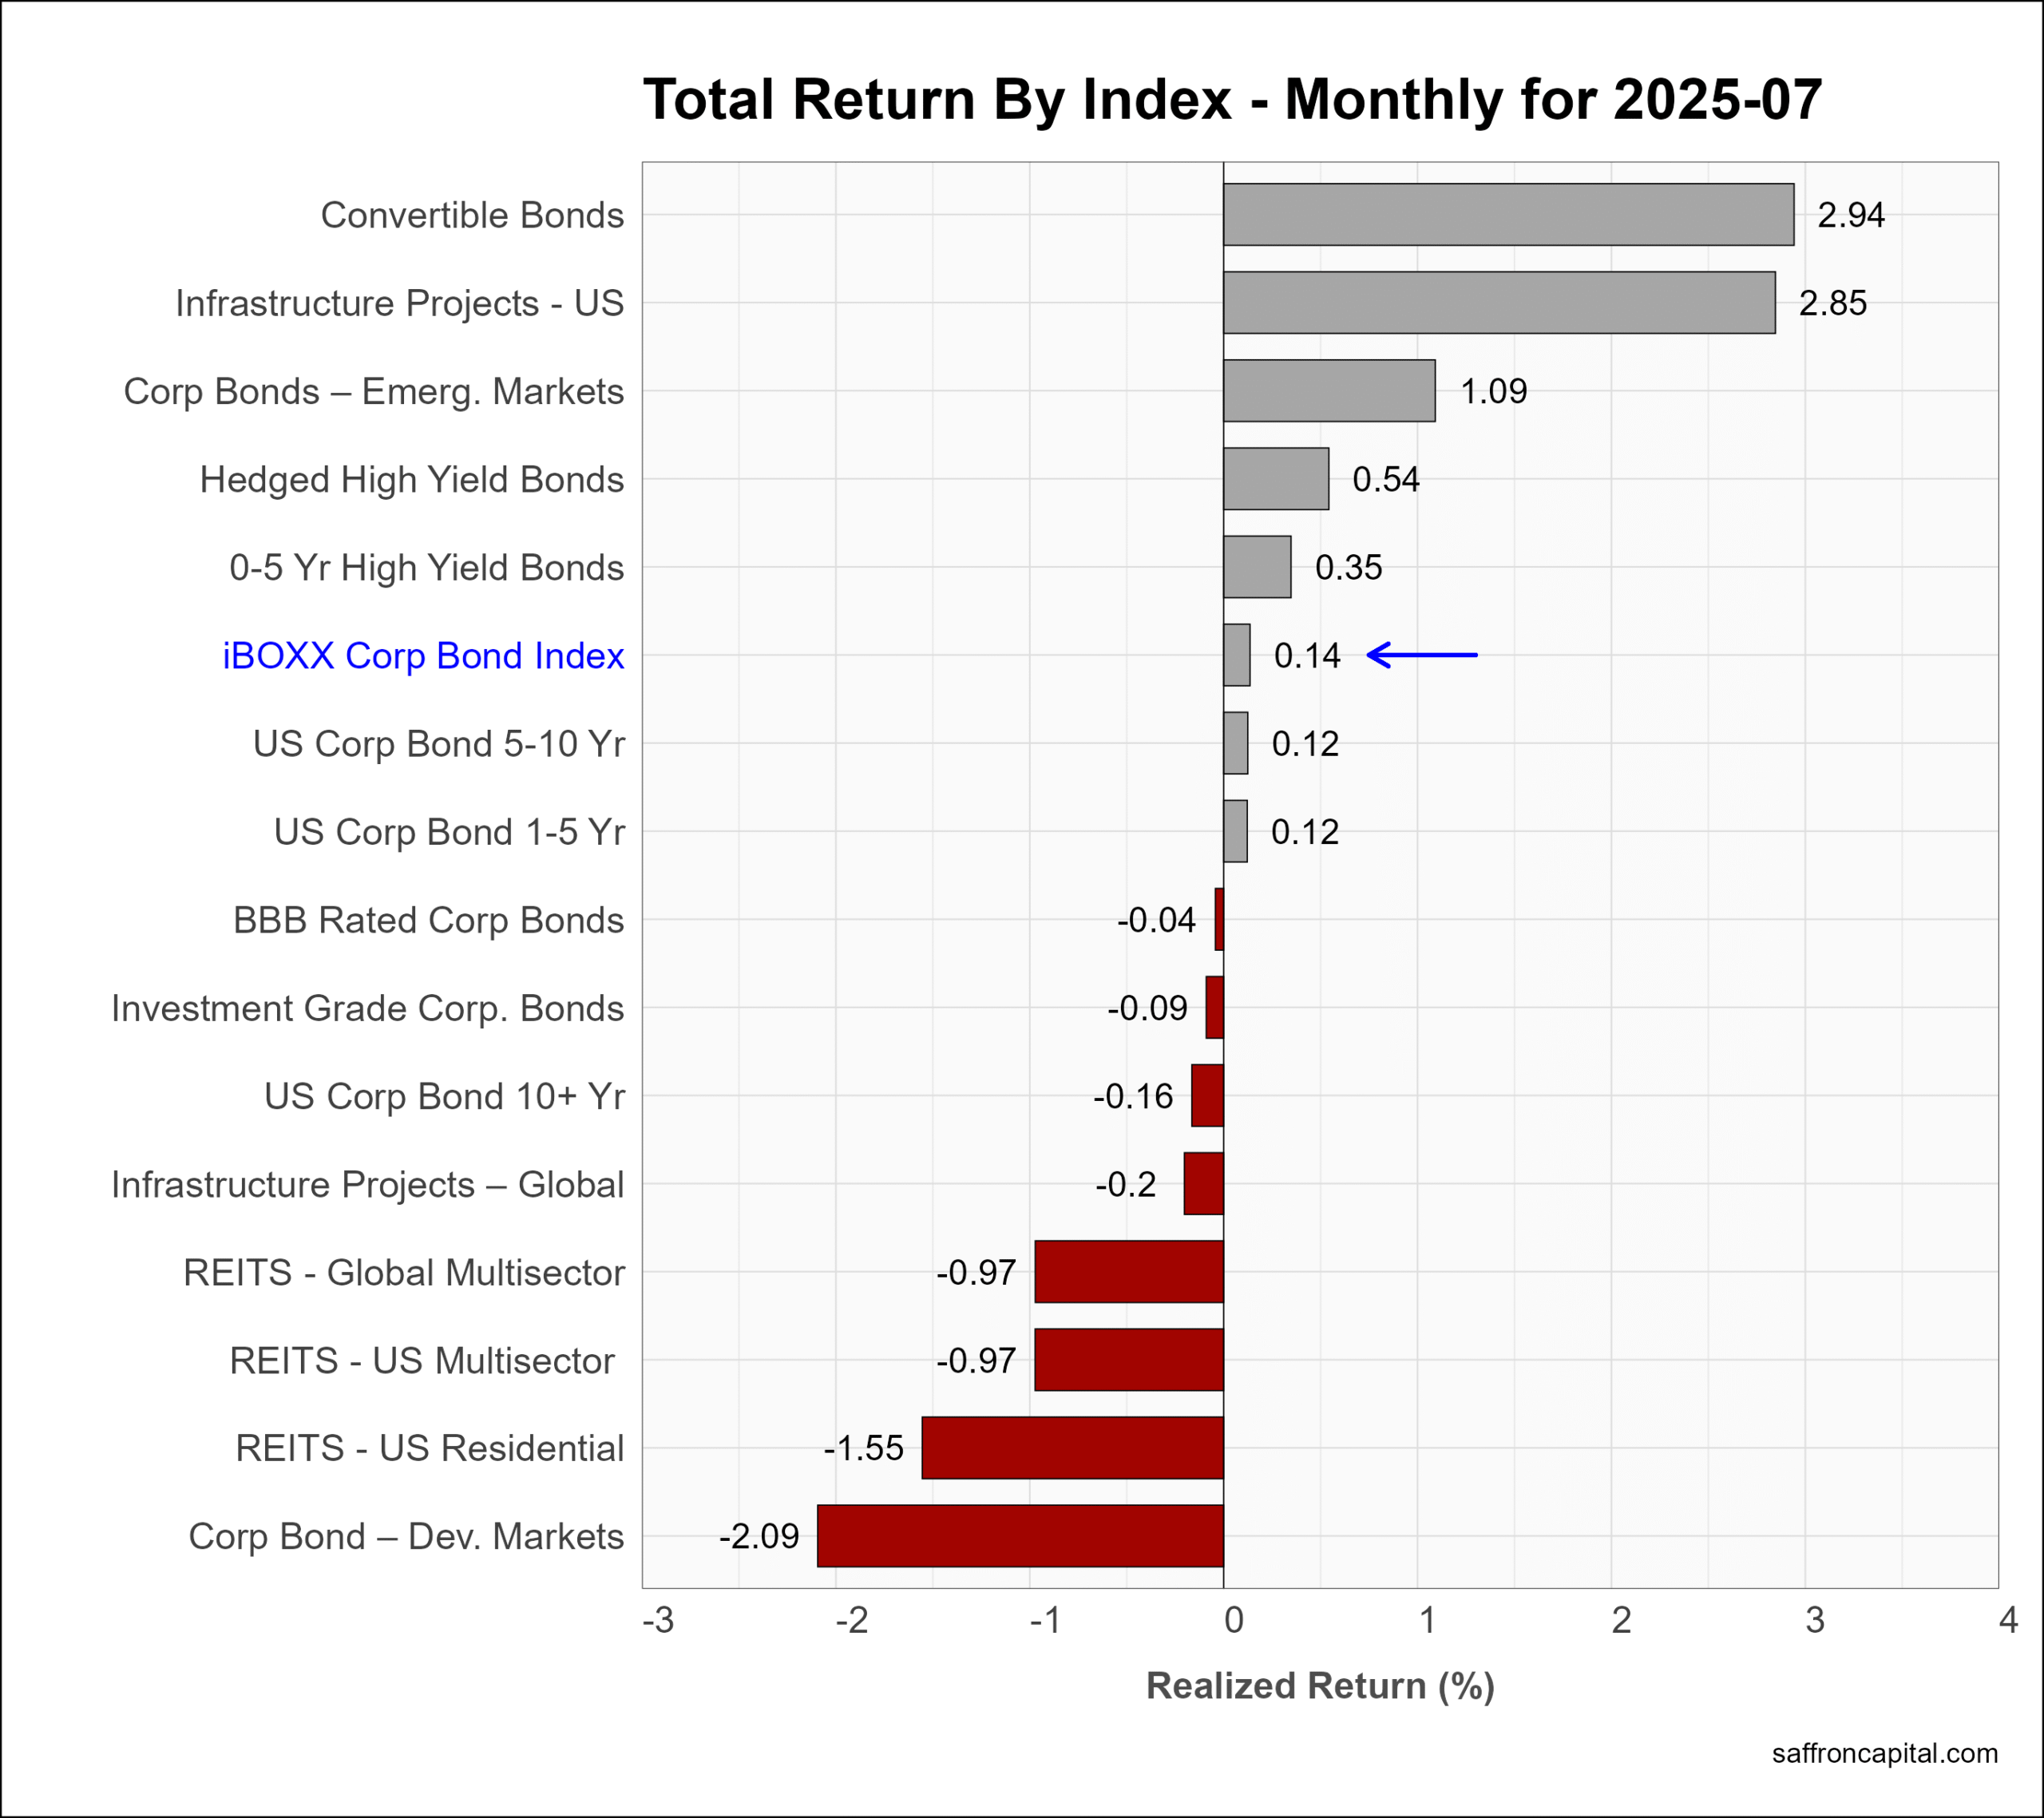
Corporate & Infrastructure Bonds
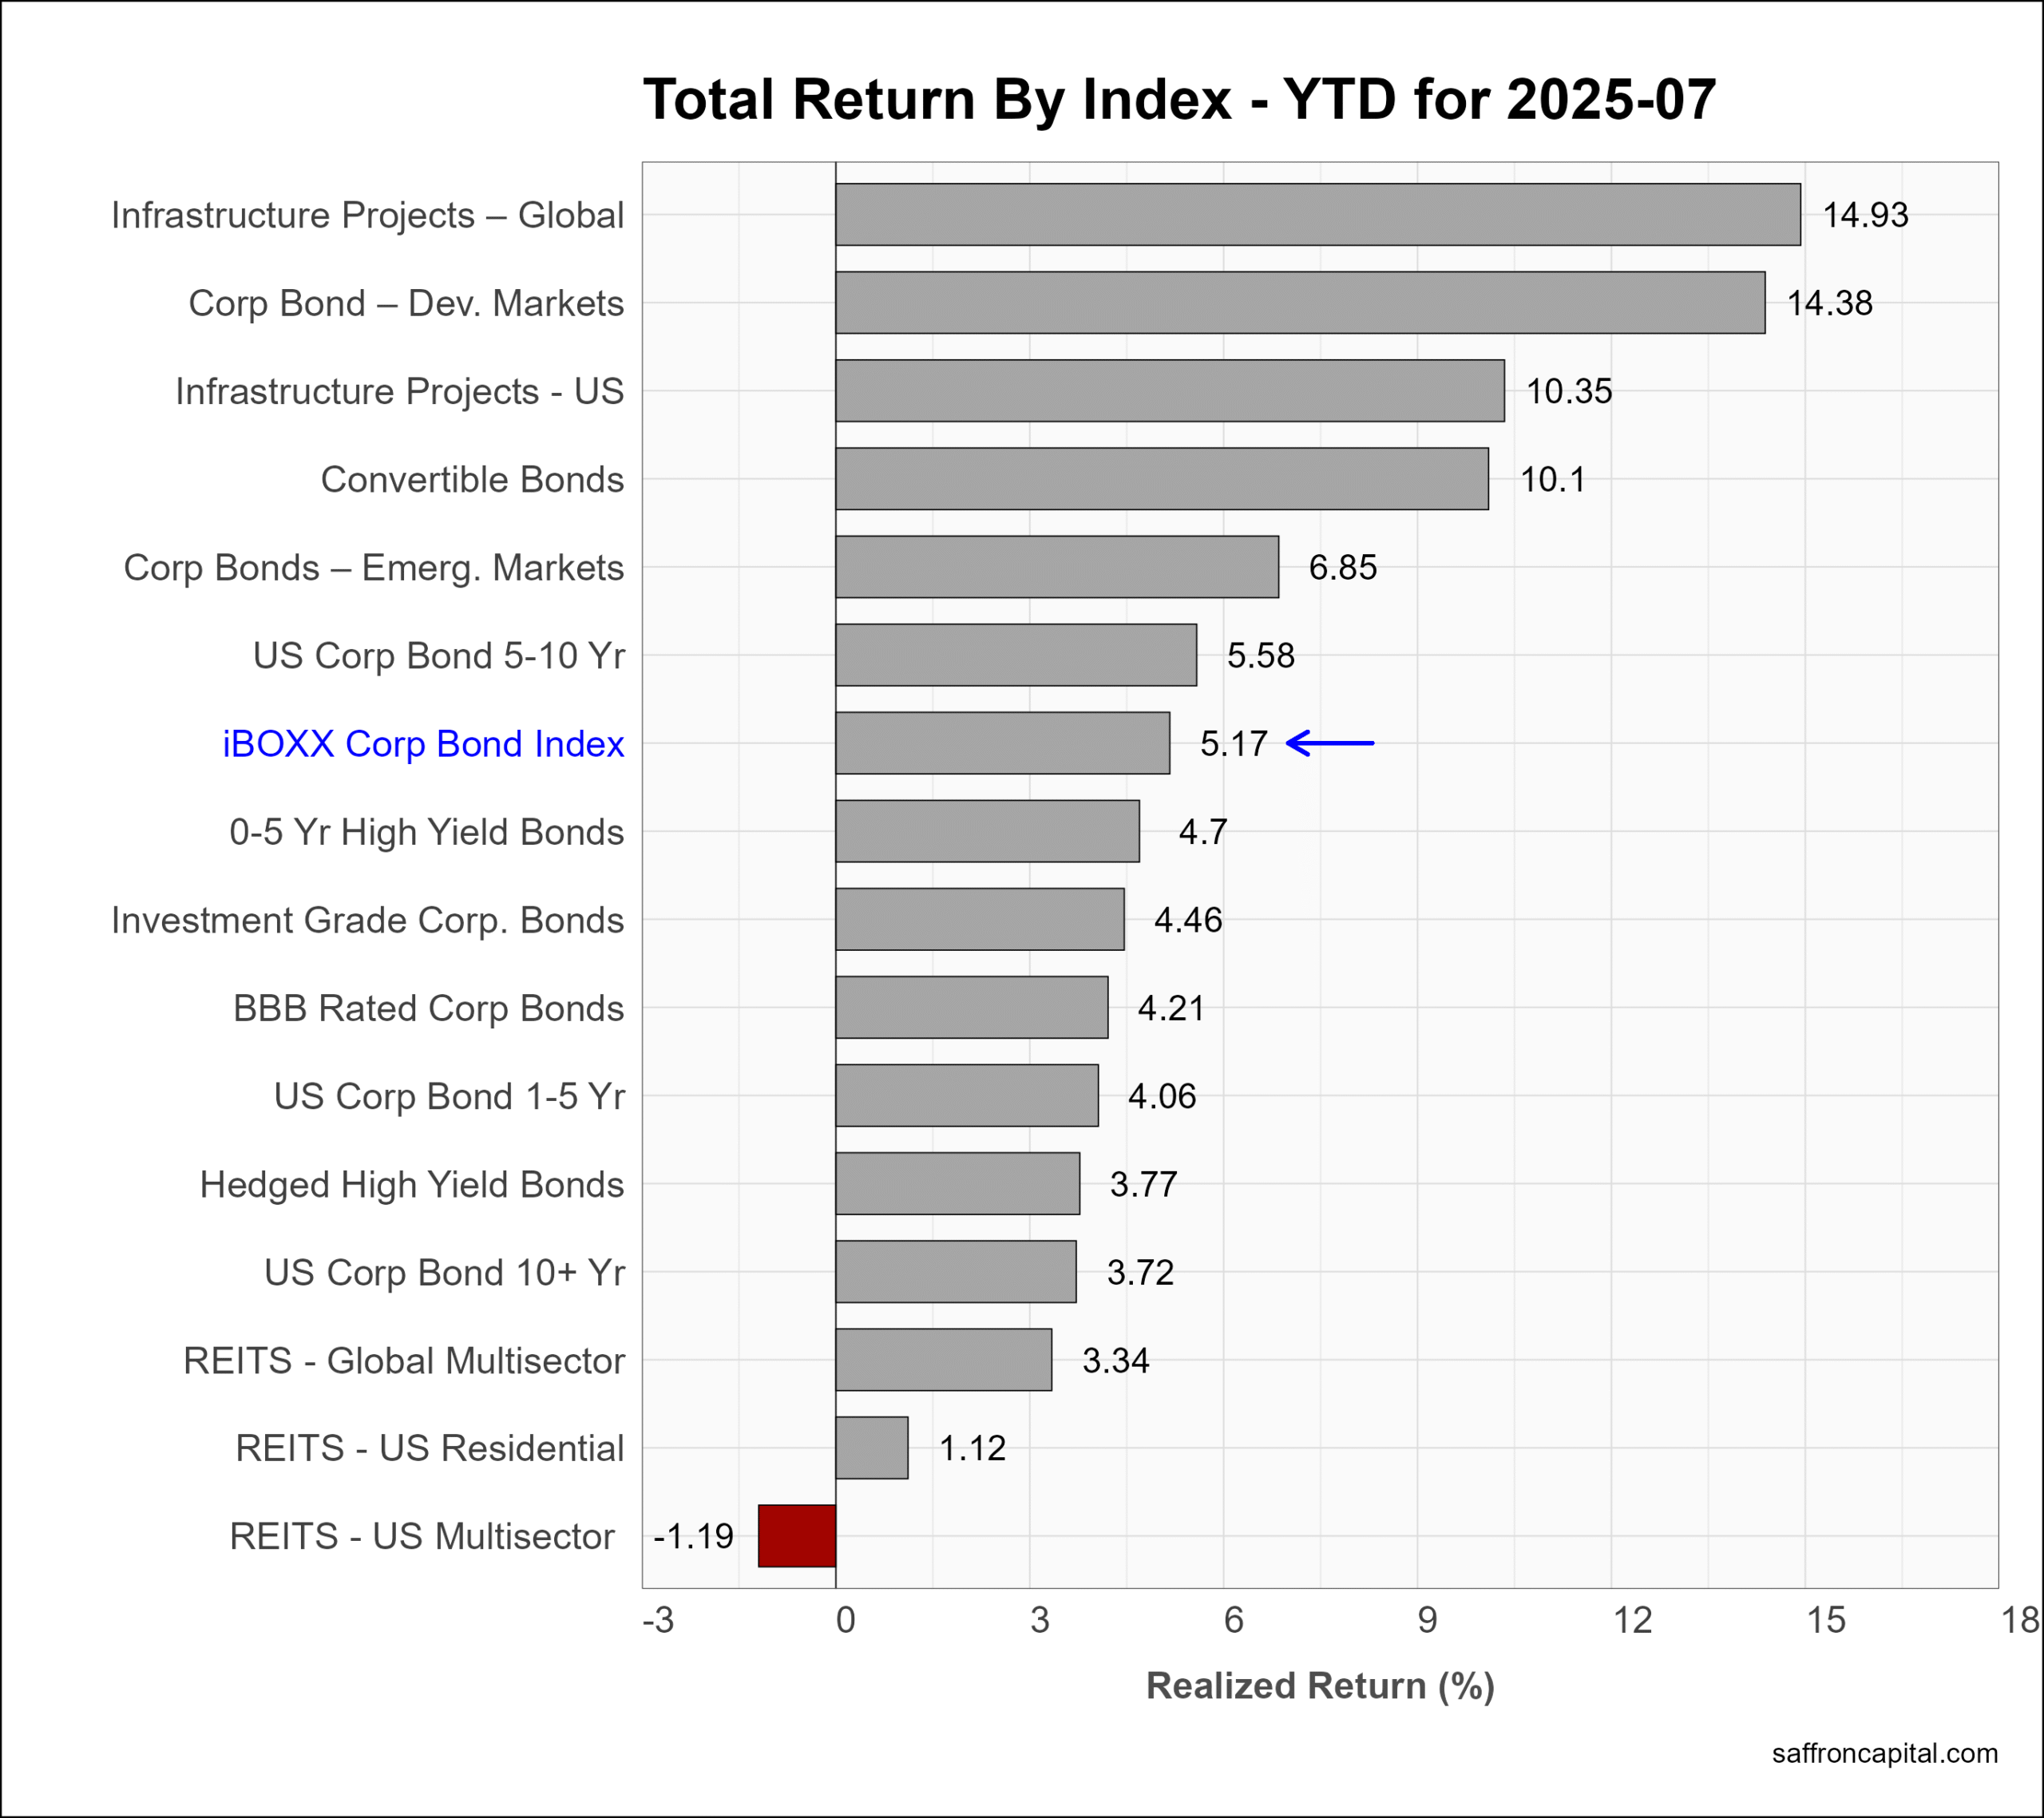
The iBoxx Corporate Bond Index (+0.14%) was also unchanged in July. Convertible Bonds (+2.94%) and US Infrastructure project Bonds (+2.85%) were top performers, while Developed Market Corporate bonds (-2.09%) and US REITS (-1.55% to -0.97%) all underperformed. Year-to-date, Global Infrastructure Project Bonds (+14.93%) top the performance chart, while REITS continue to underperform the corporate index (+5.17%).
Click to enlarge
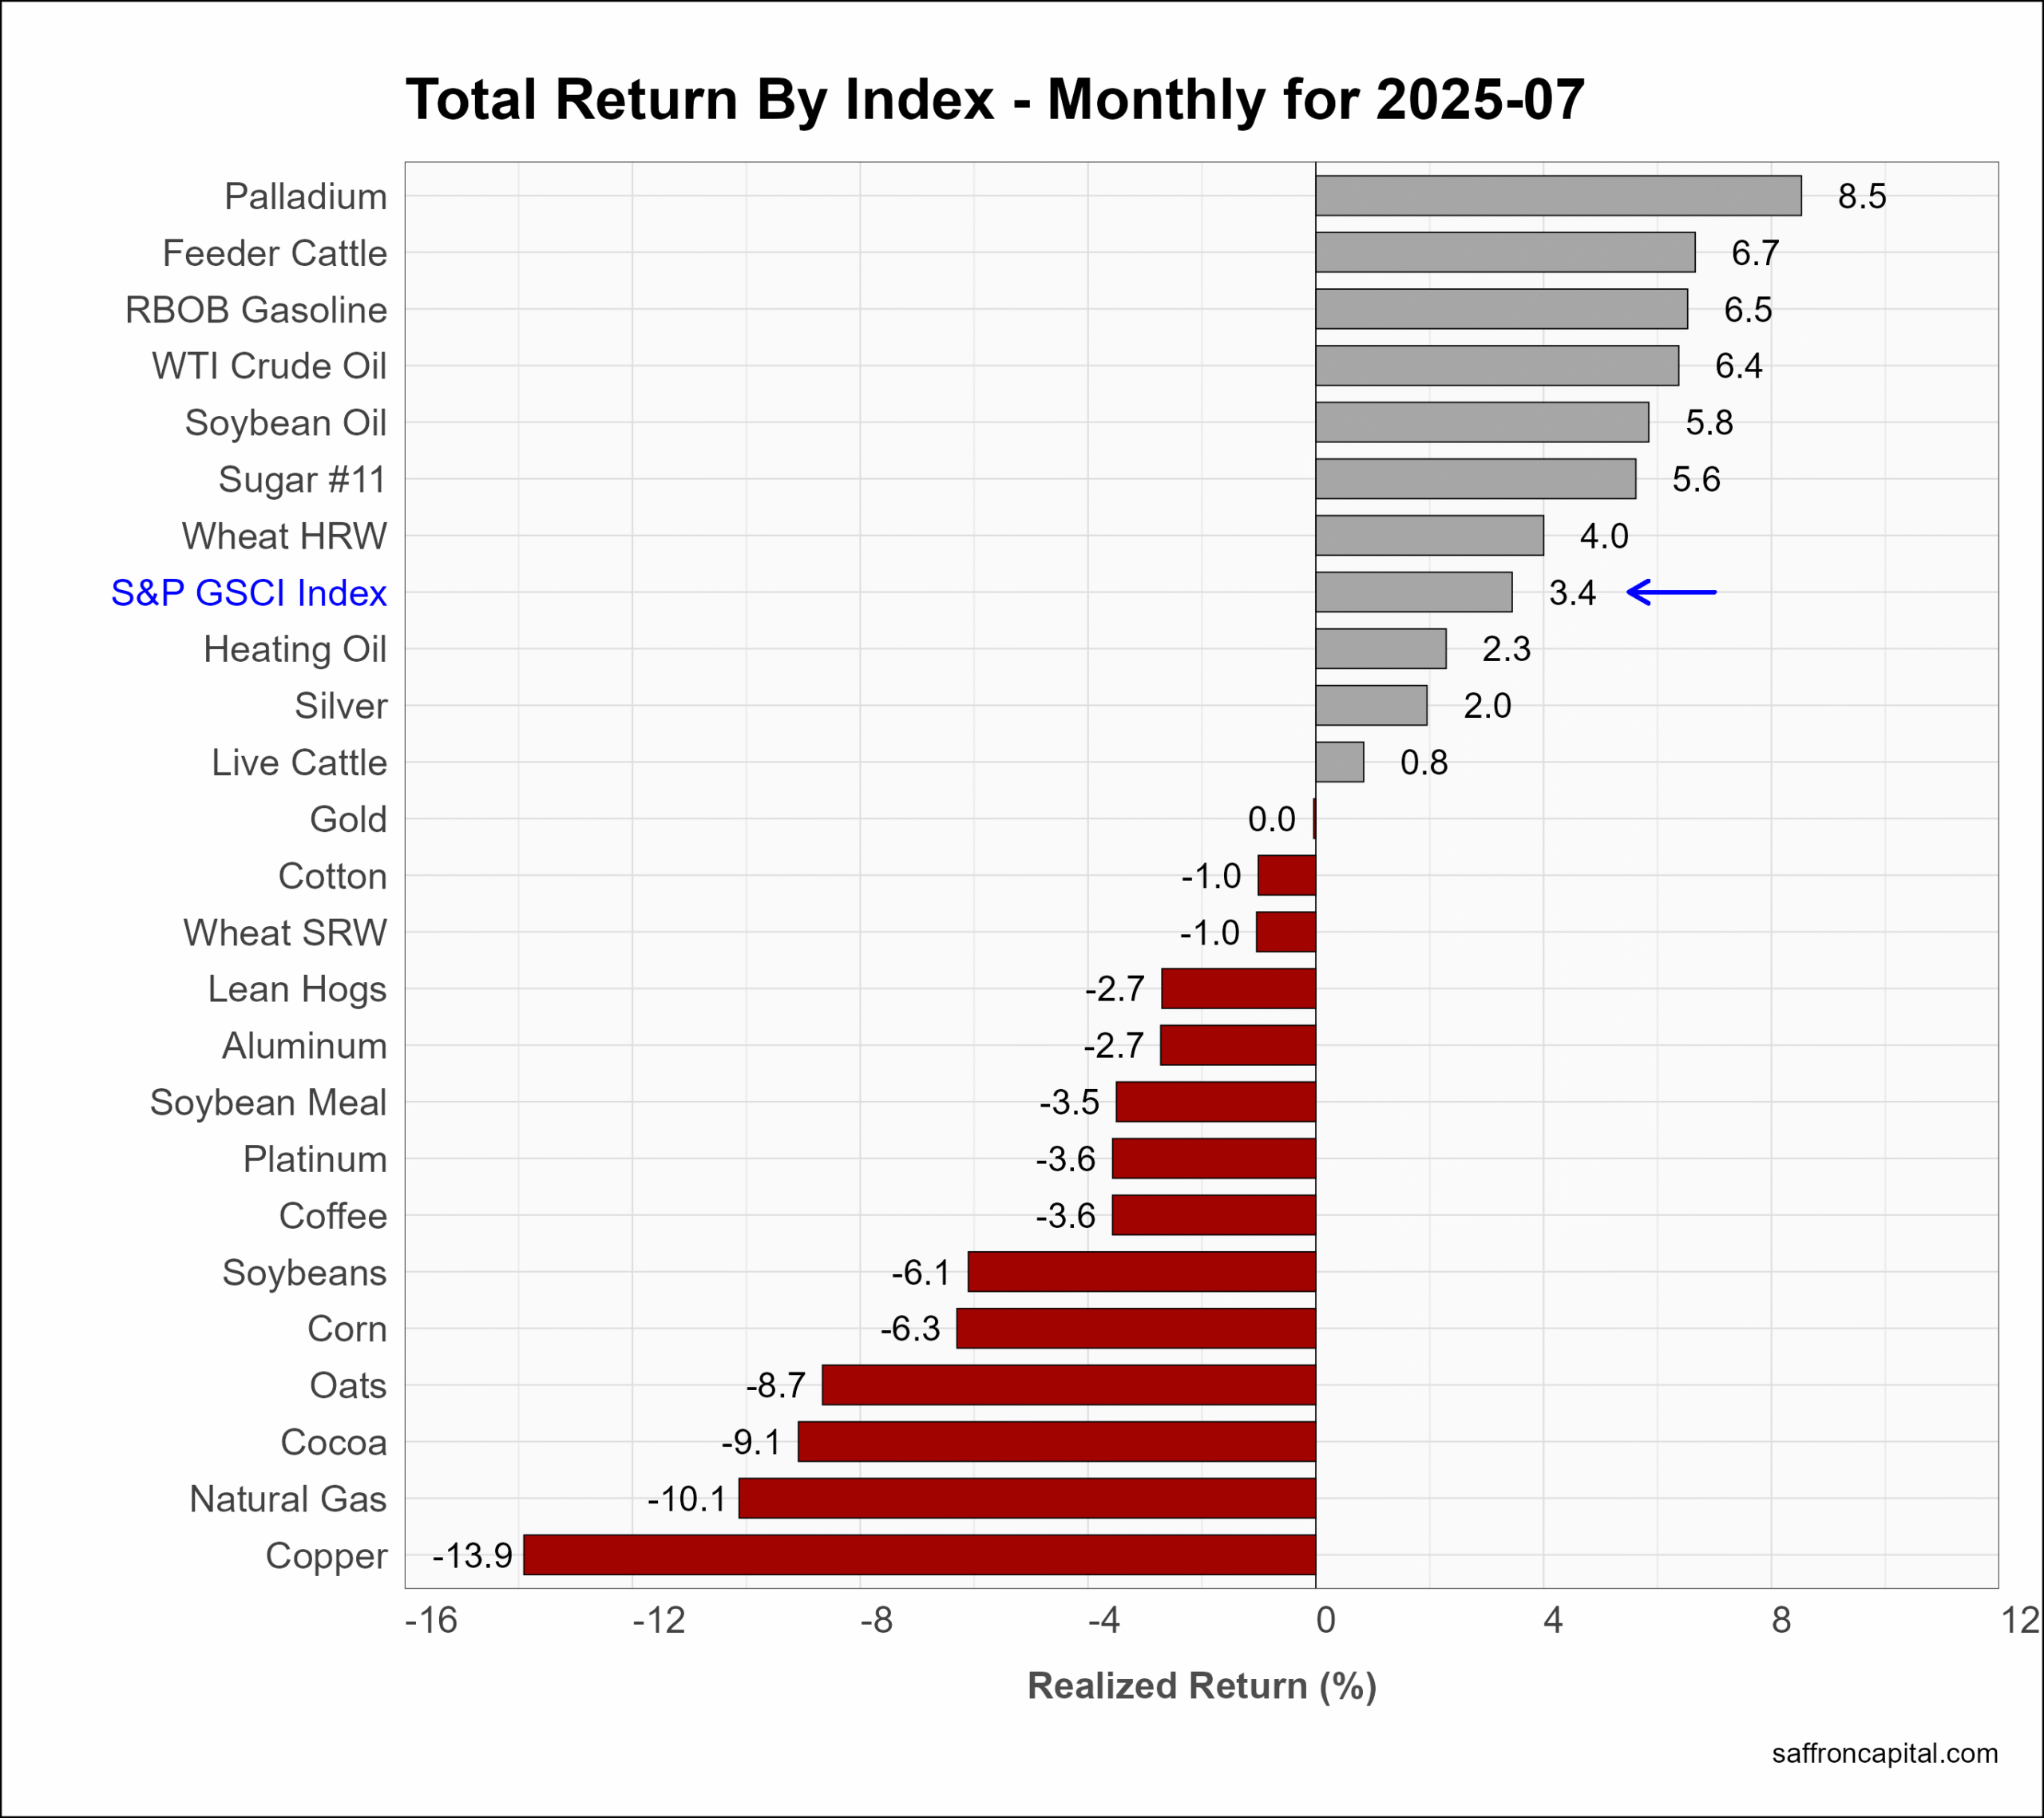
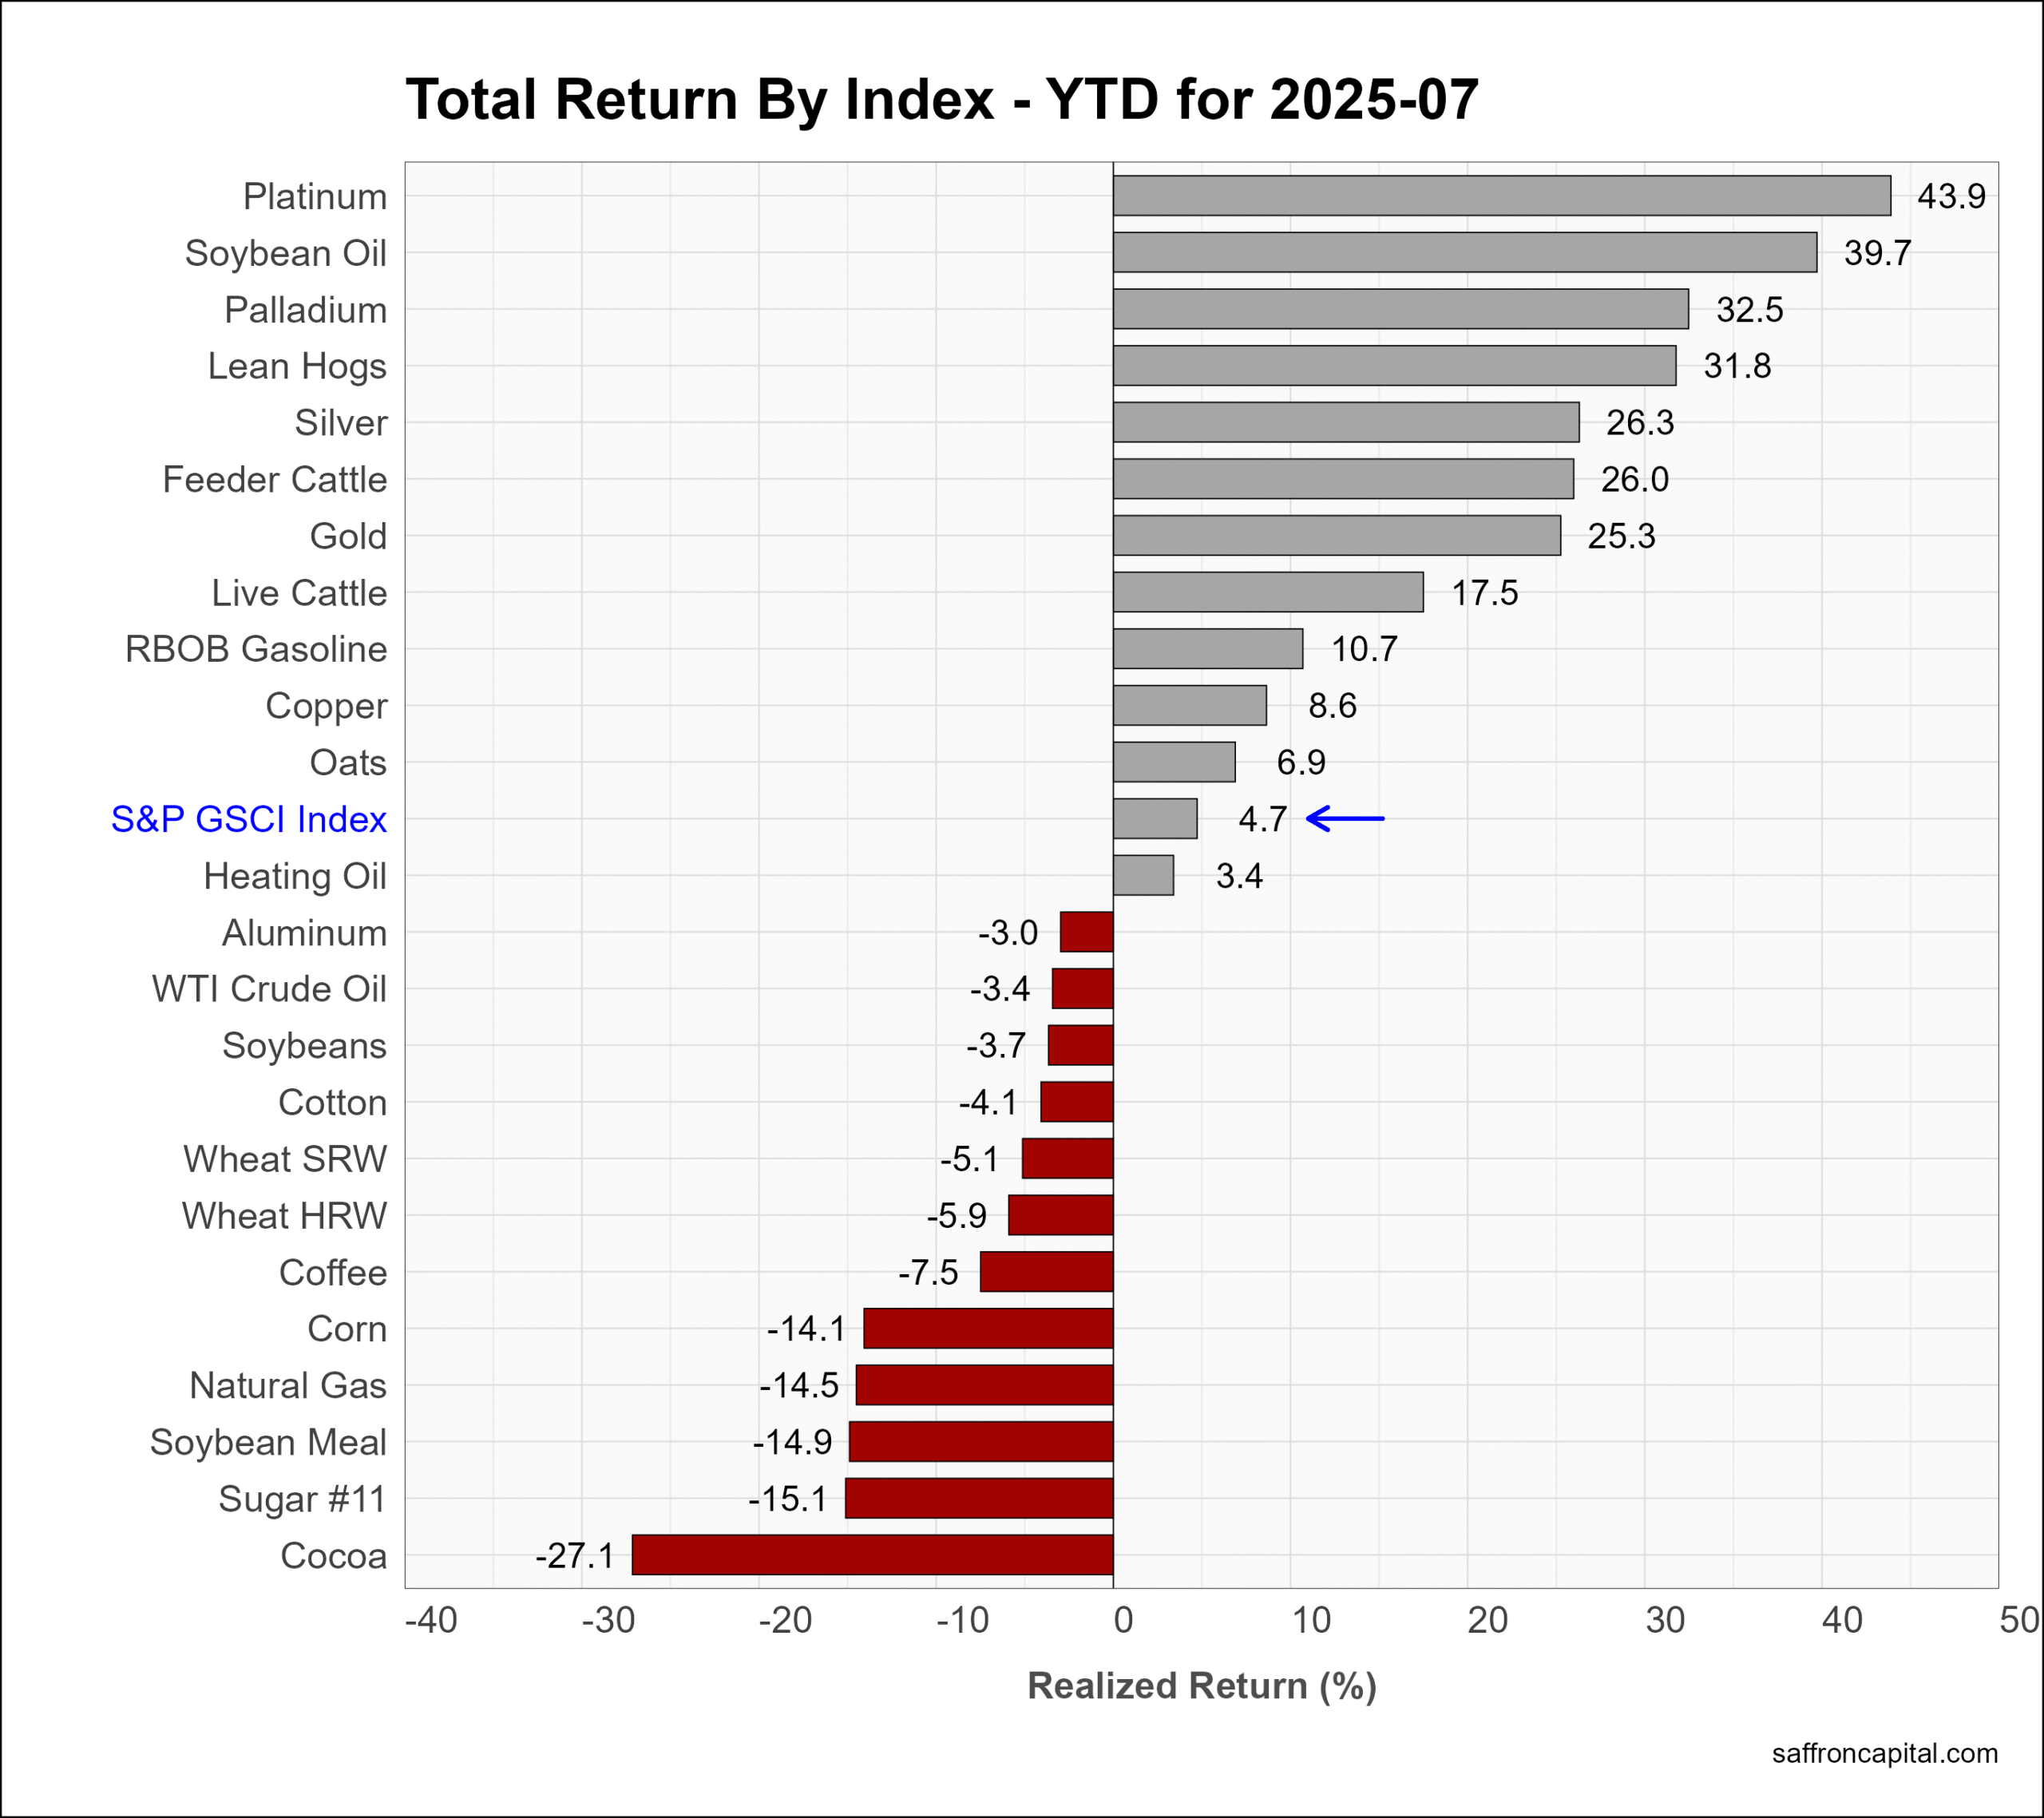
Commodities
Commodities, as measured by the S&P GS Commodity Index (+3.4%) was up in July. Palladium (+8.5%) had the strongest returns, follwoed by Feeder Cattle (+6.7%) and Gasoline (+6.5%). Large losses were seen in Copper (-13.9%) and Natural Gas (-10.1%). Year-to-date, the commodity index (+4.7%) is trailing US stocks and corporate fixed income returns. Notwithstanding, Platinum (+43.9%), Soybean Oil (+39.7%), and Palladium (+32.5%) have seen outstanding returns.
Click to enlarge
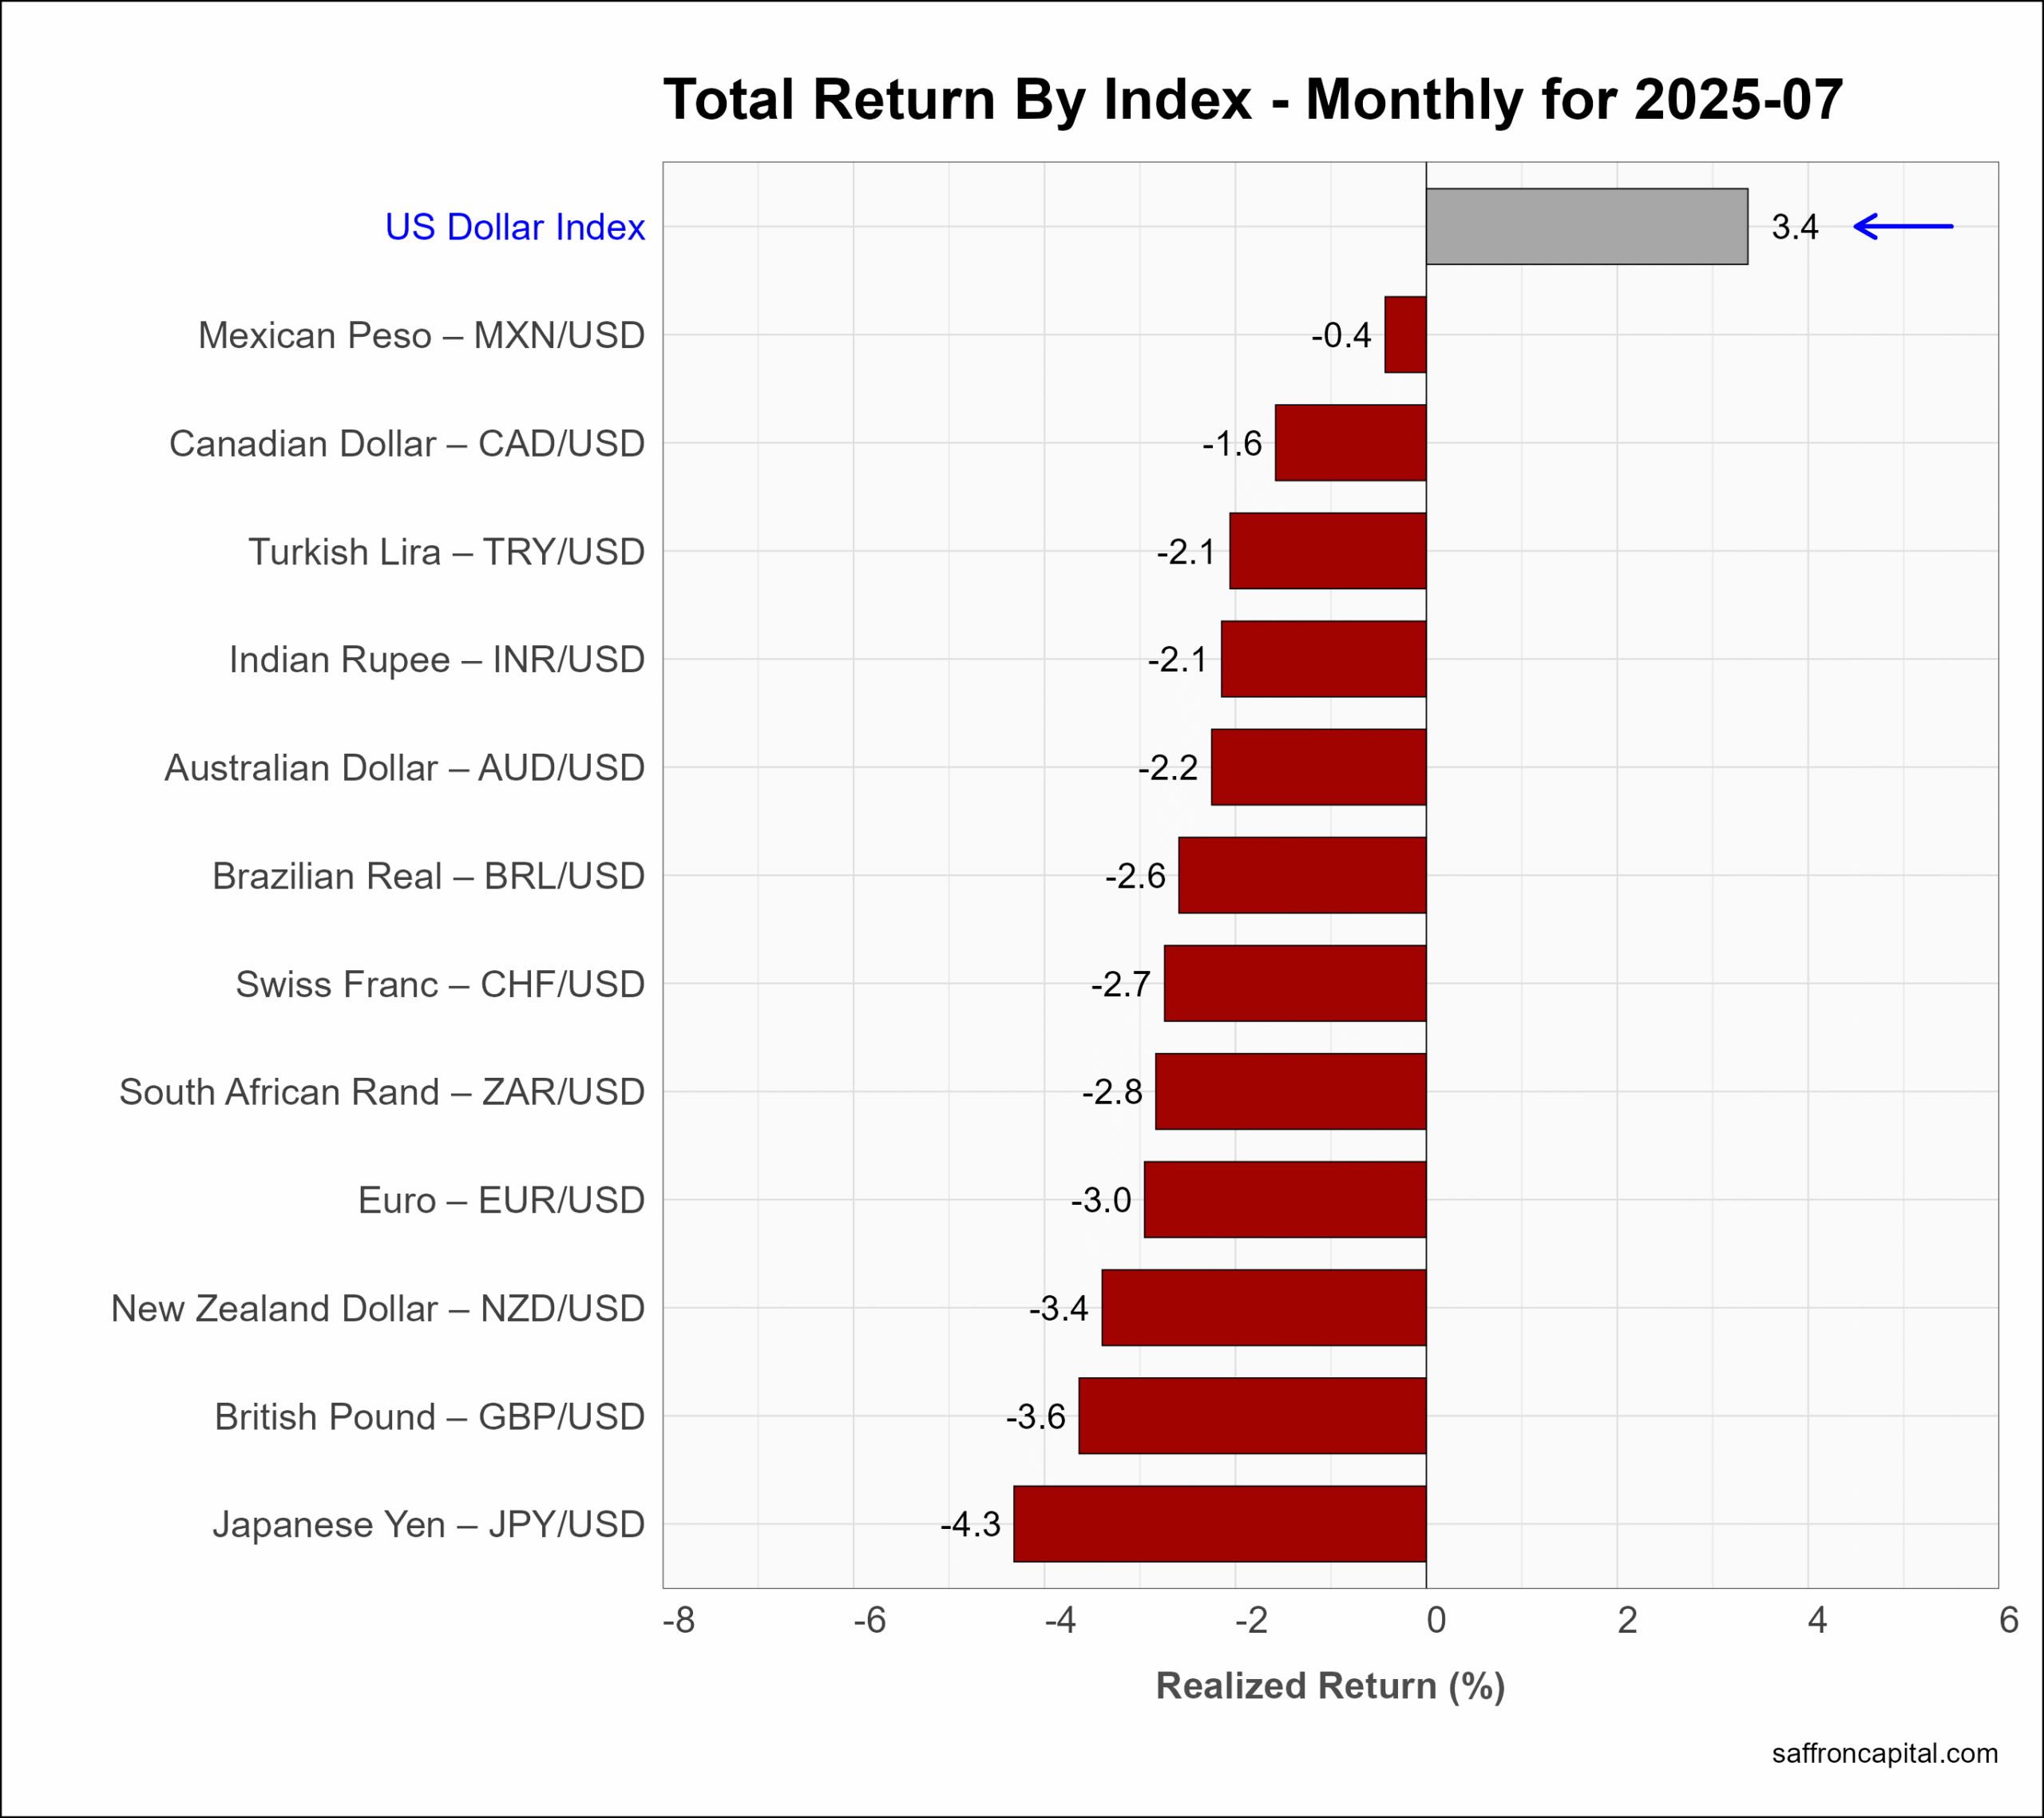
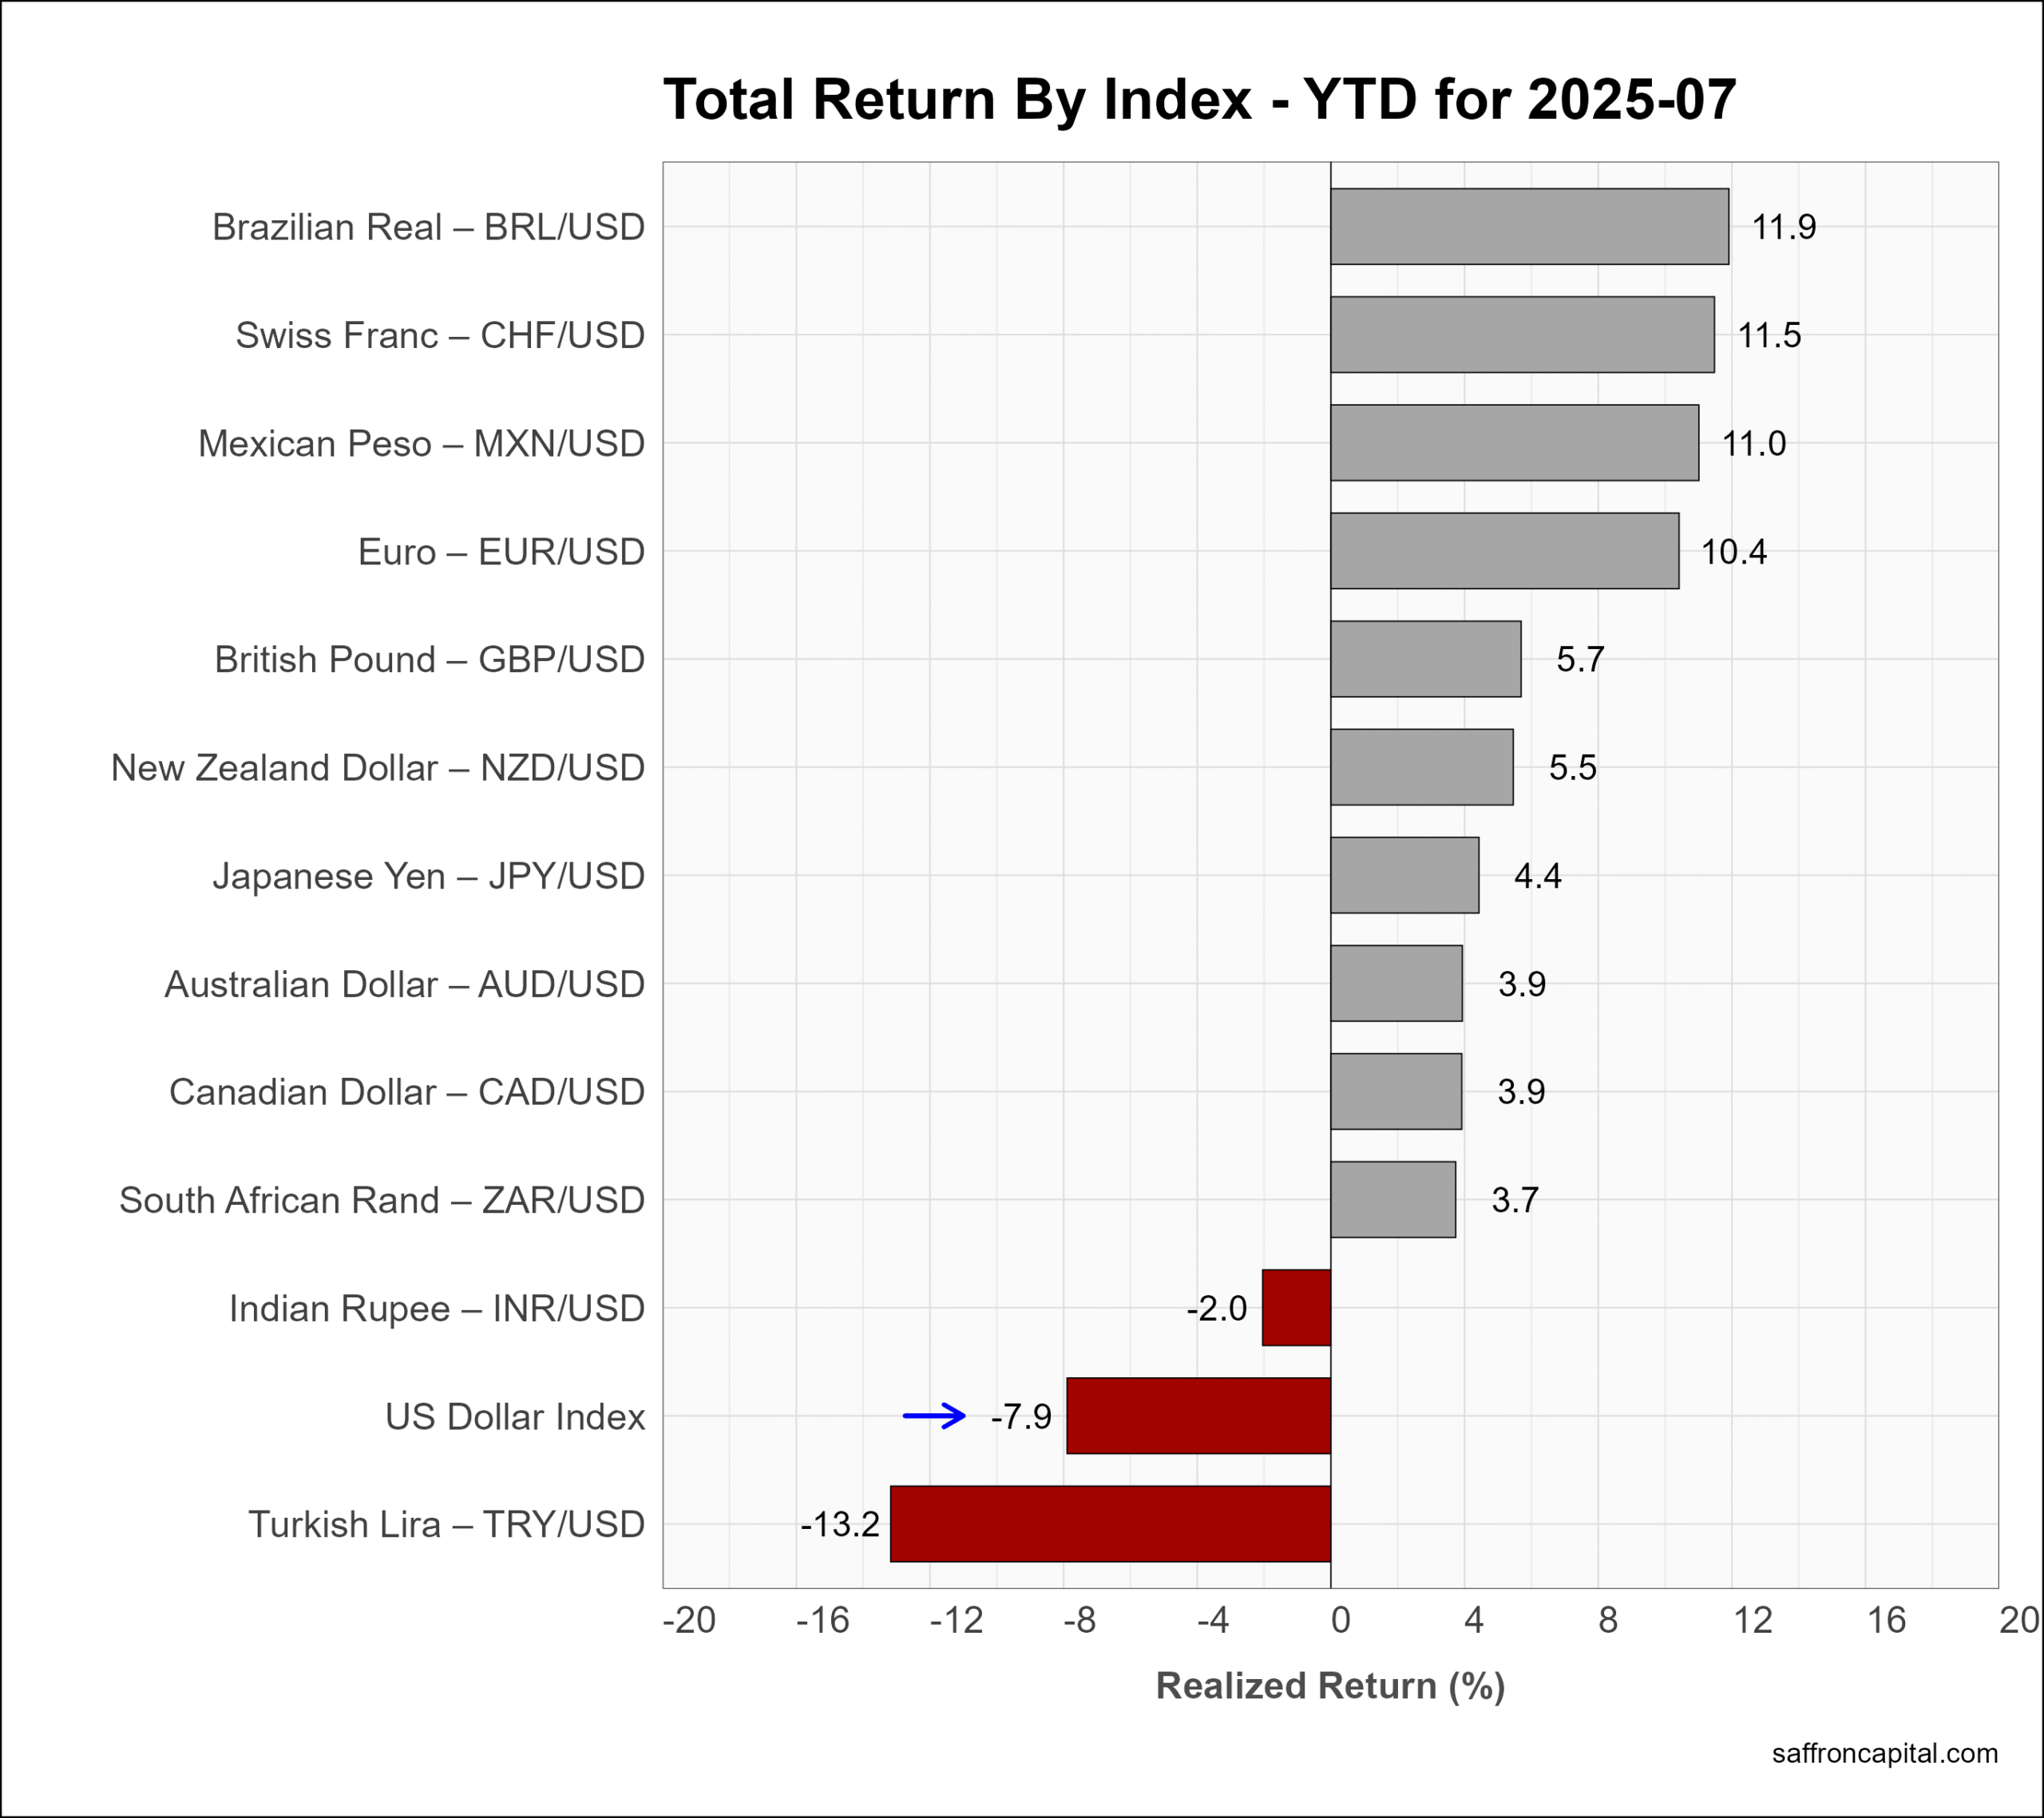
Currencies
The U.S. Dollar index (+3.4%) rose July after falling more than 10% in the first half of the year. The Japanese Yen (-4.3%) and the British Pound (-3.6%) were the weakest of the top currencies. The US Dollar is now down -7.9% since the start of the year.
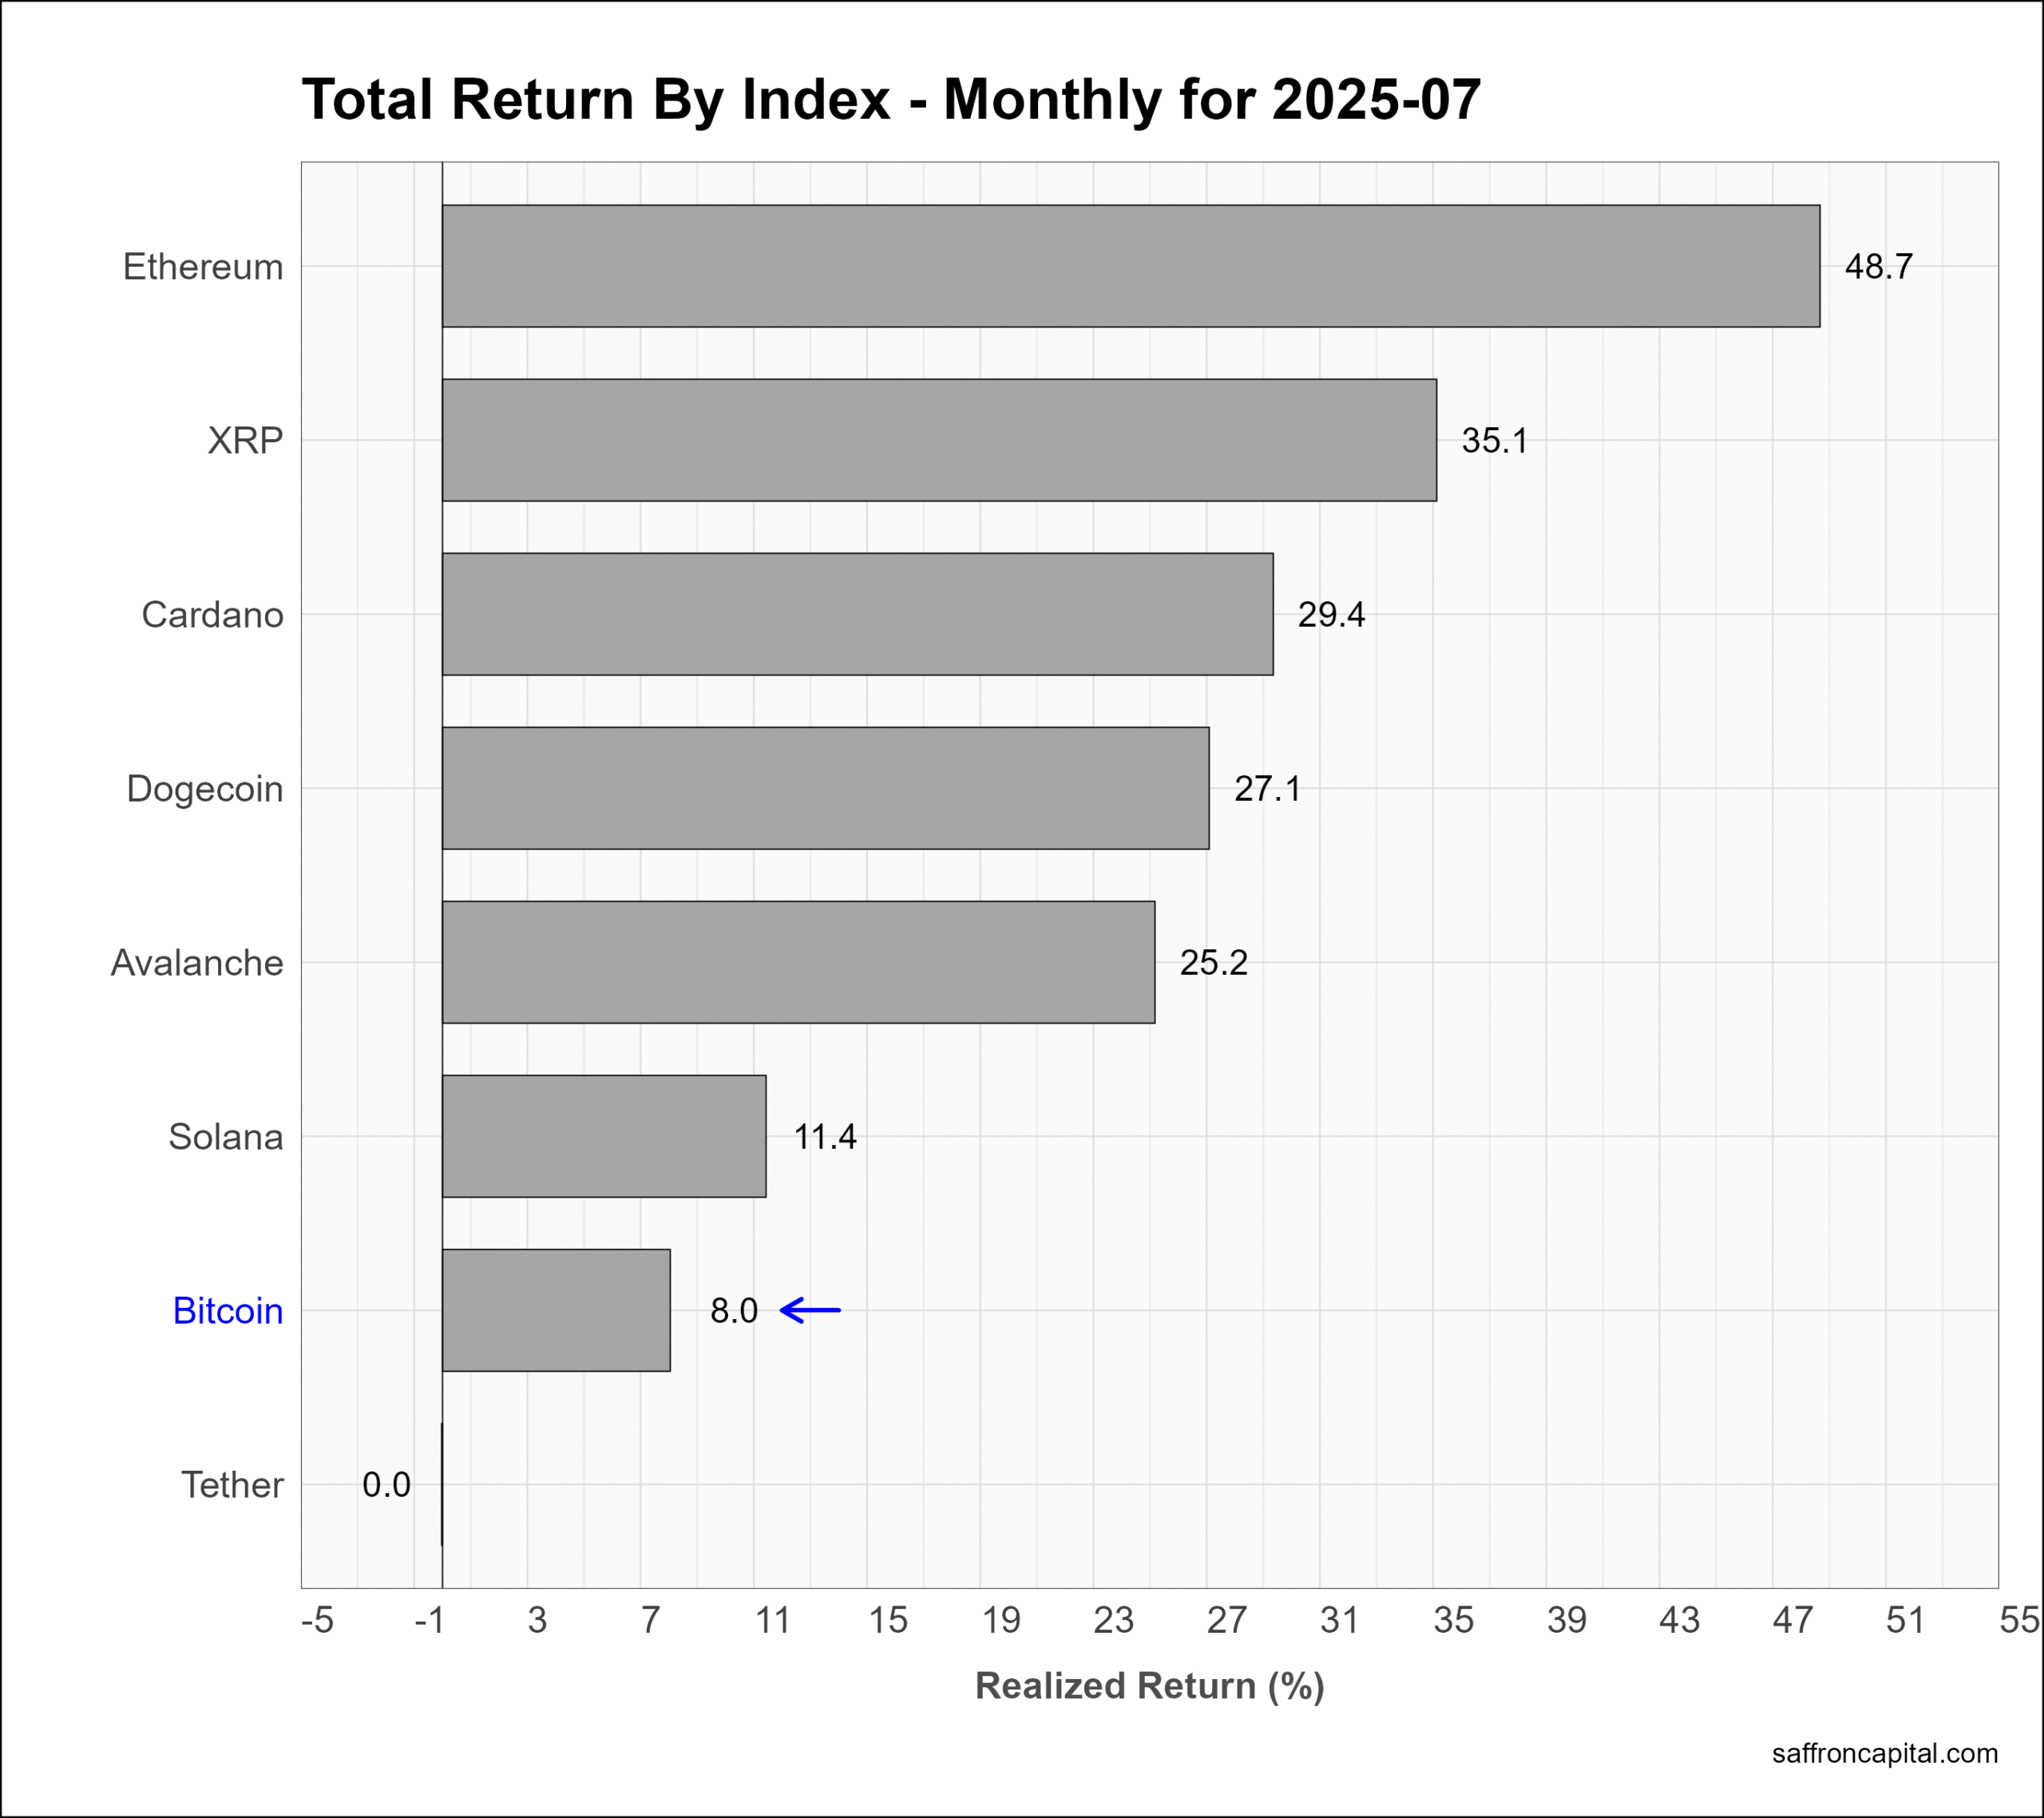
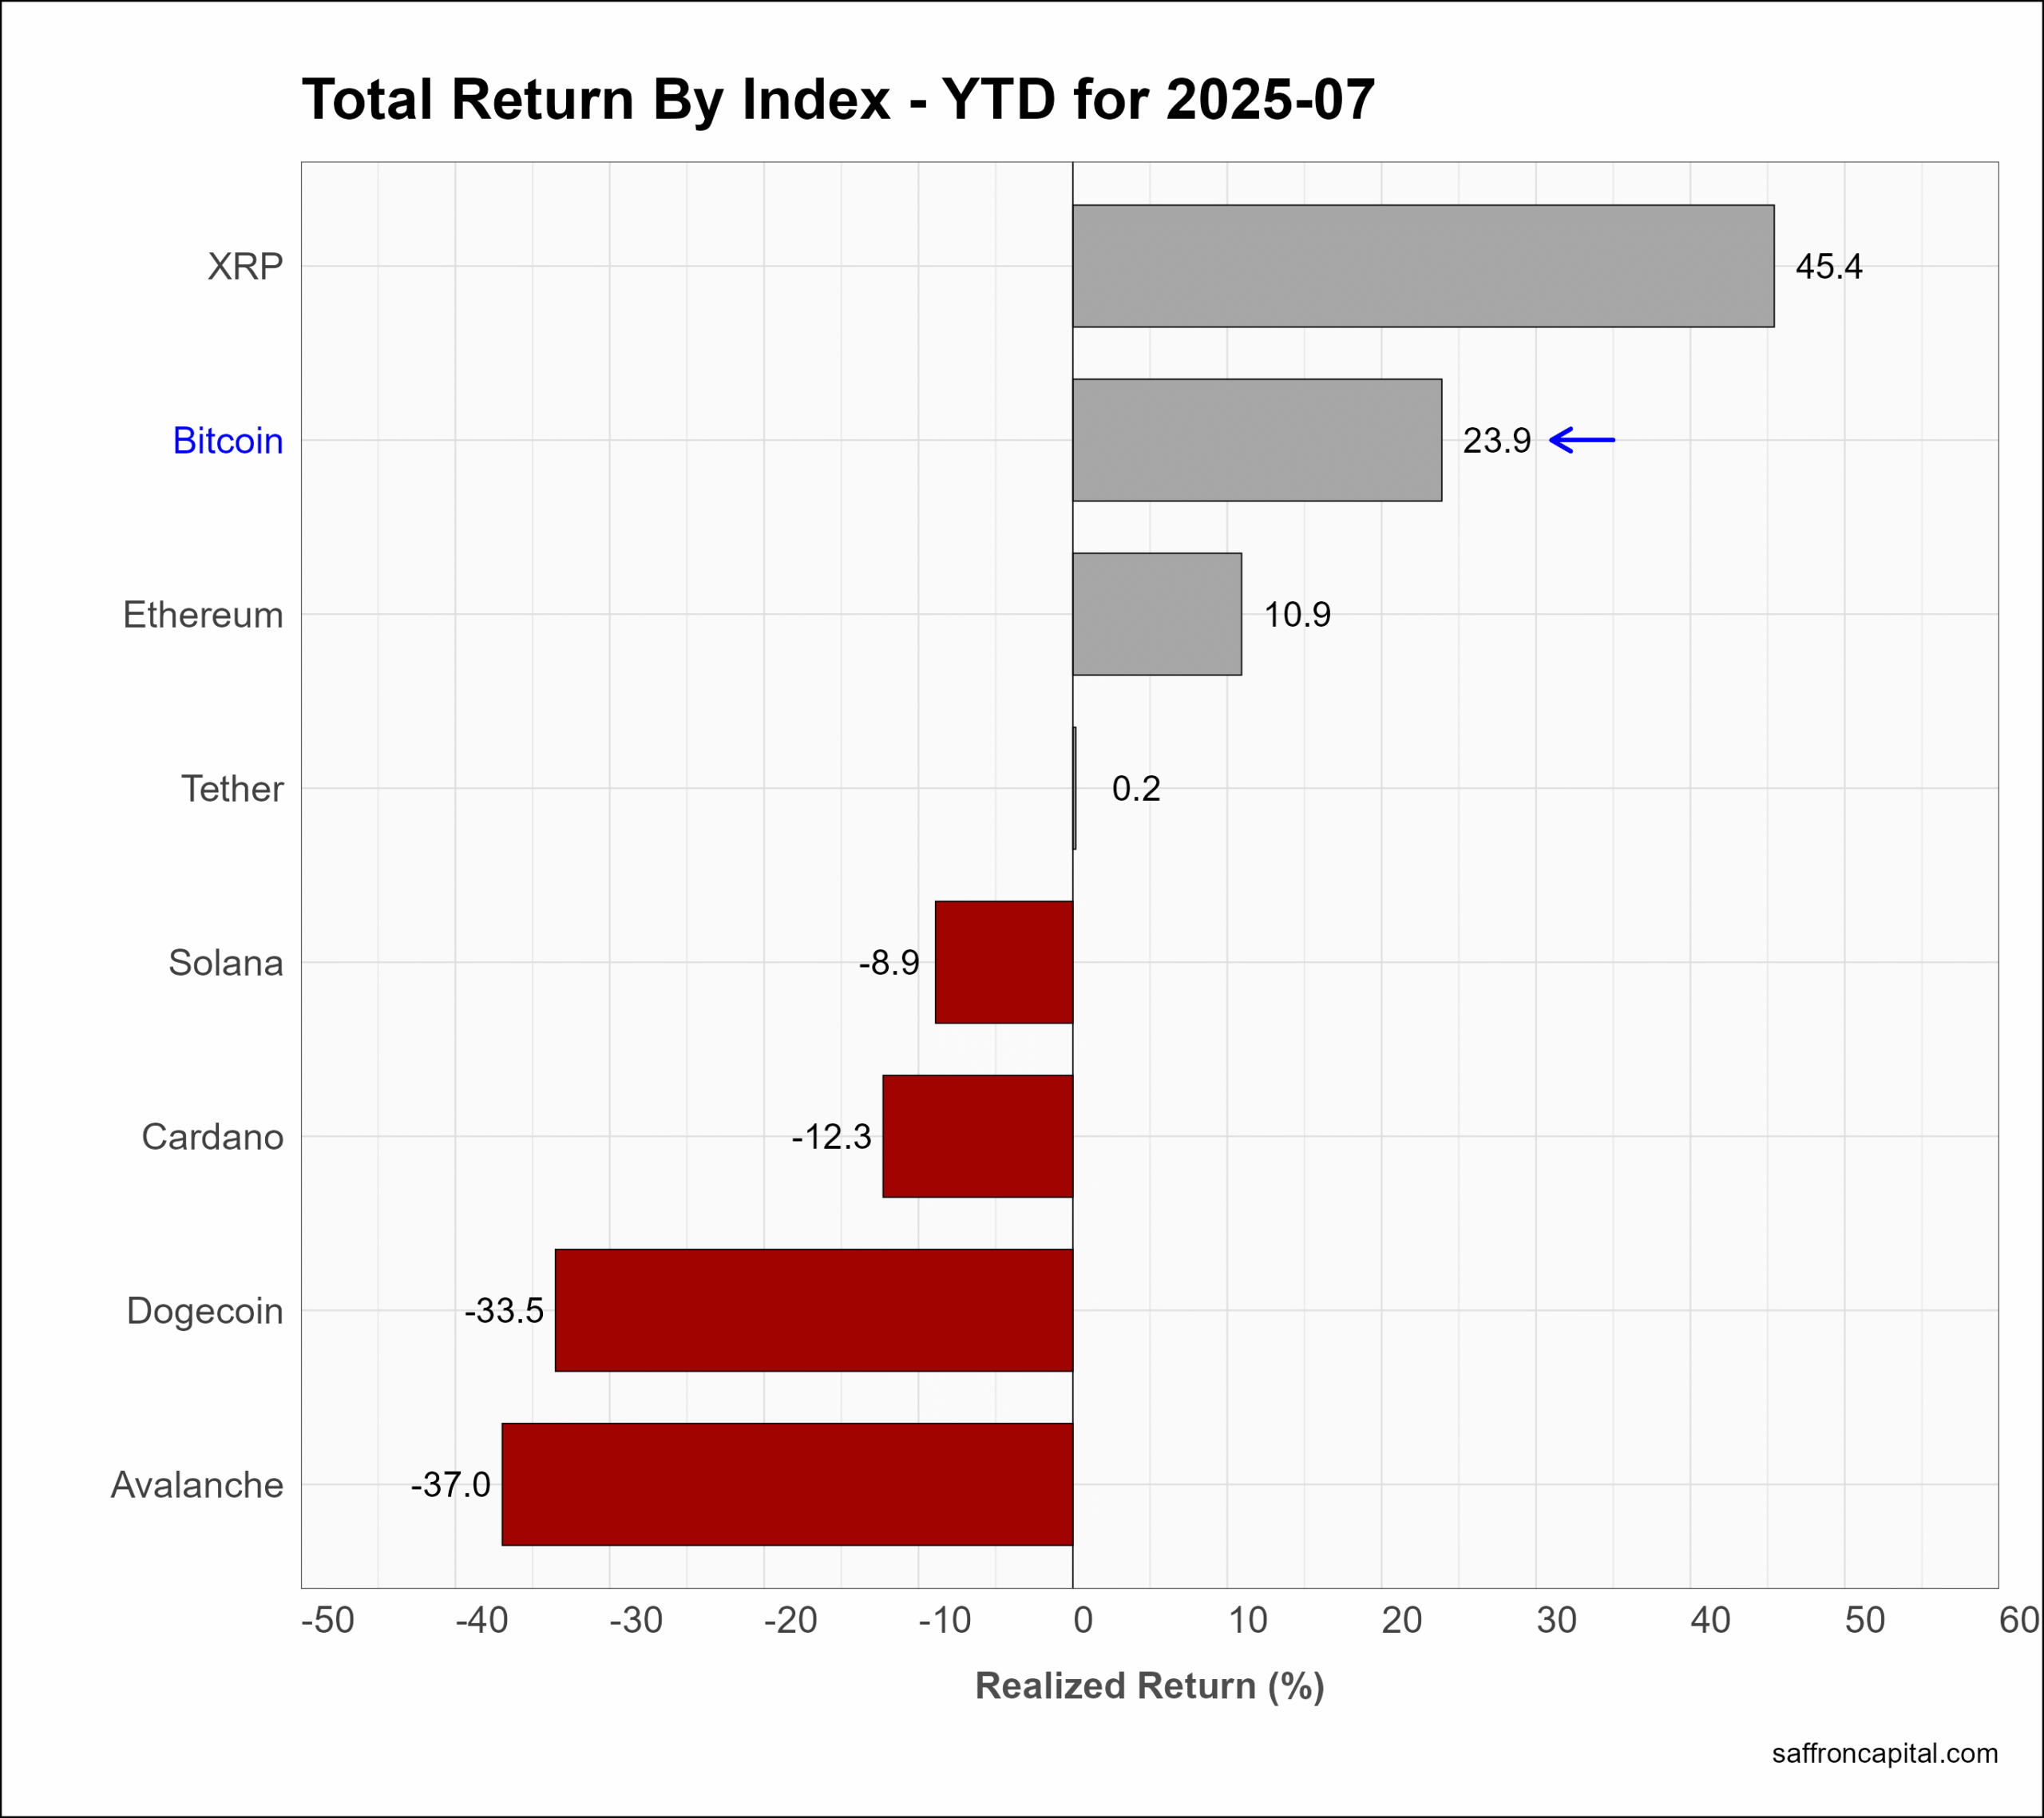
Cryptocurrencies
Benchmark Bitcoin (+8.0%) was up in July and trailed Ethereum (+48.7%), XRP (+35.1%) and Cardano (+29.4%). Over the seven months of 2025, Bitcoin (+23.9%) is solidly outperforming US stocks but is still trailing Gold (+25.3%).
Click to enlarge
Have questions or concerns about the performance of your portfolio? Could you benefit from a capital preservation strategy or a custom portfolio formulation that better aligns to your risk appetite? Whatever your needs, we are here to listen and to help. Contact us here.
Saffron Capital LLC is a registered investment advisor that is employee-owned and Minnesota-based.


