September returns mark six straight month of consecutive stock market gains. September 2025 was also the best September for equity returns in 15 years. It was a stellar third quarter, thanks to a Fed policy shift, strong earnings upgrades, and robust consumer spending. The S&P 500 was up 3.5% last month despite ongoing trade negotiations, increased inflation, and a labor market slowdown. Meanwhile, the US Aggregate Bond index (+1.13%) made steady progress last month, resulting in solid performance year-to-date (+6.19%). Precious metals where the top performing asset group, notably platinum (+16.0%), which continues to be used as stores of value and a hedge against trade or financial market uncertainty.
The following analysis reviews September returns by asset group. The visual summary aims to help investors to benchmark portfolio returns and to see emerging trends in asset allocations across markets.
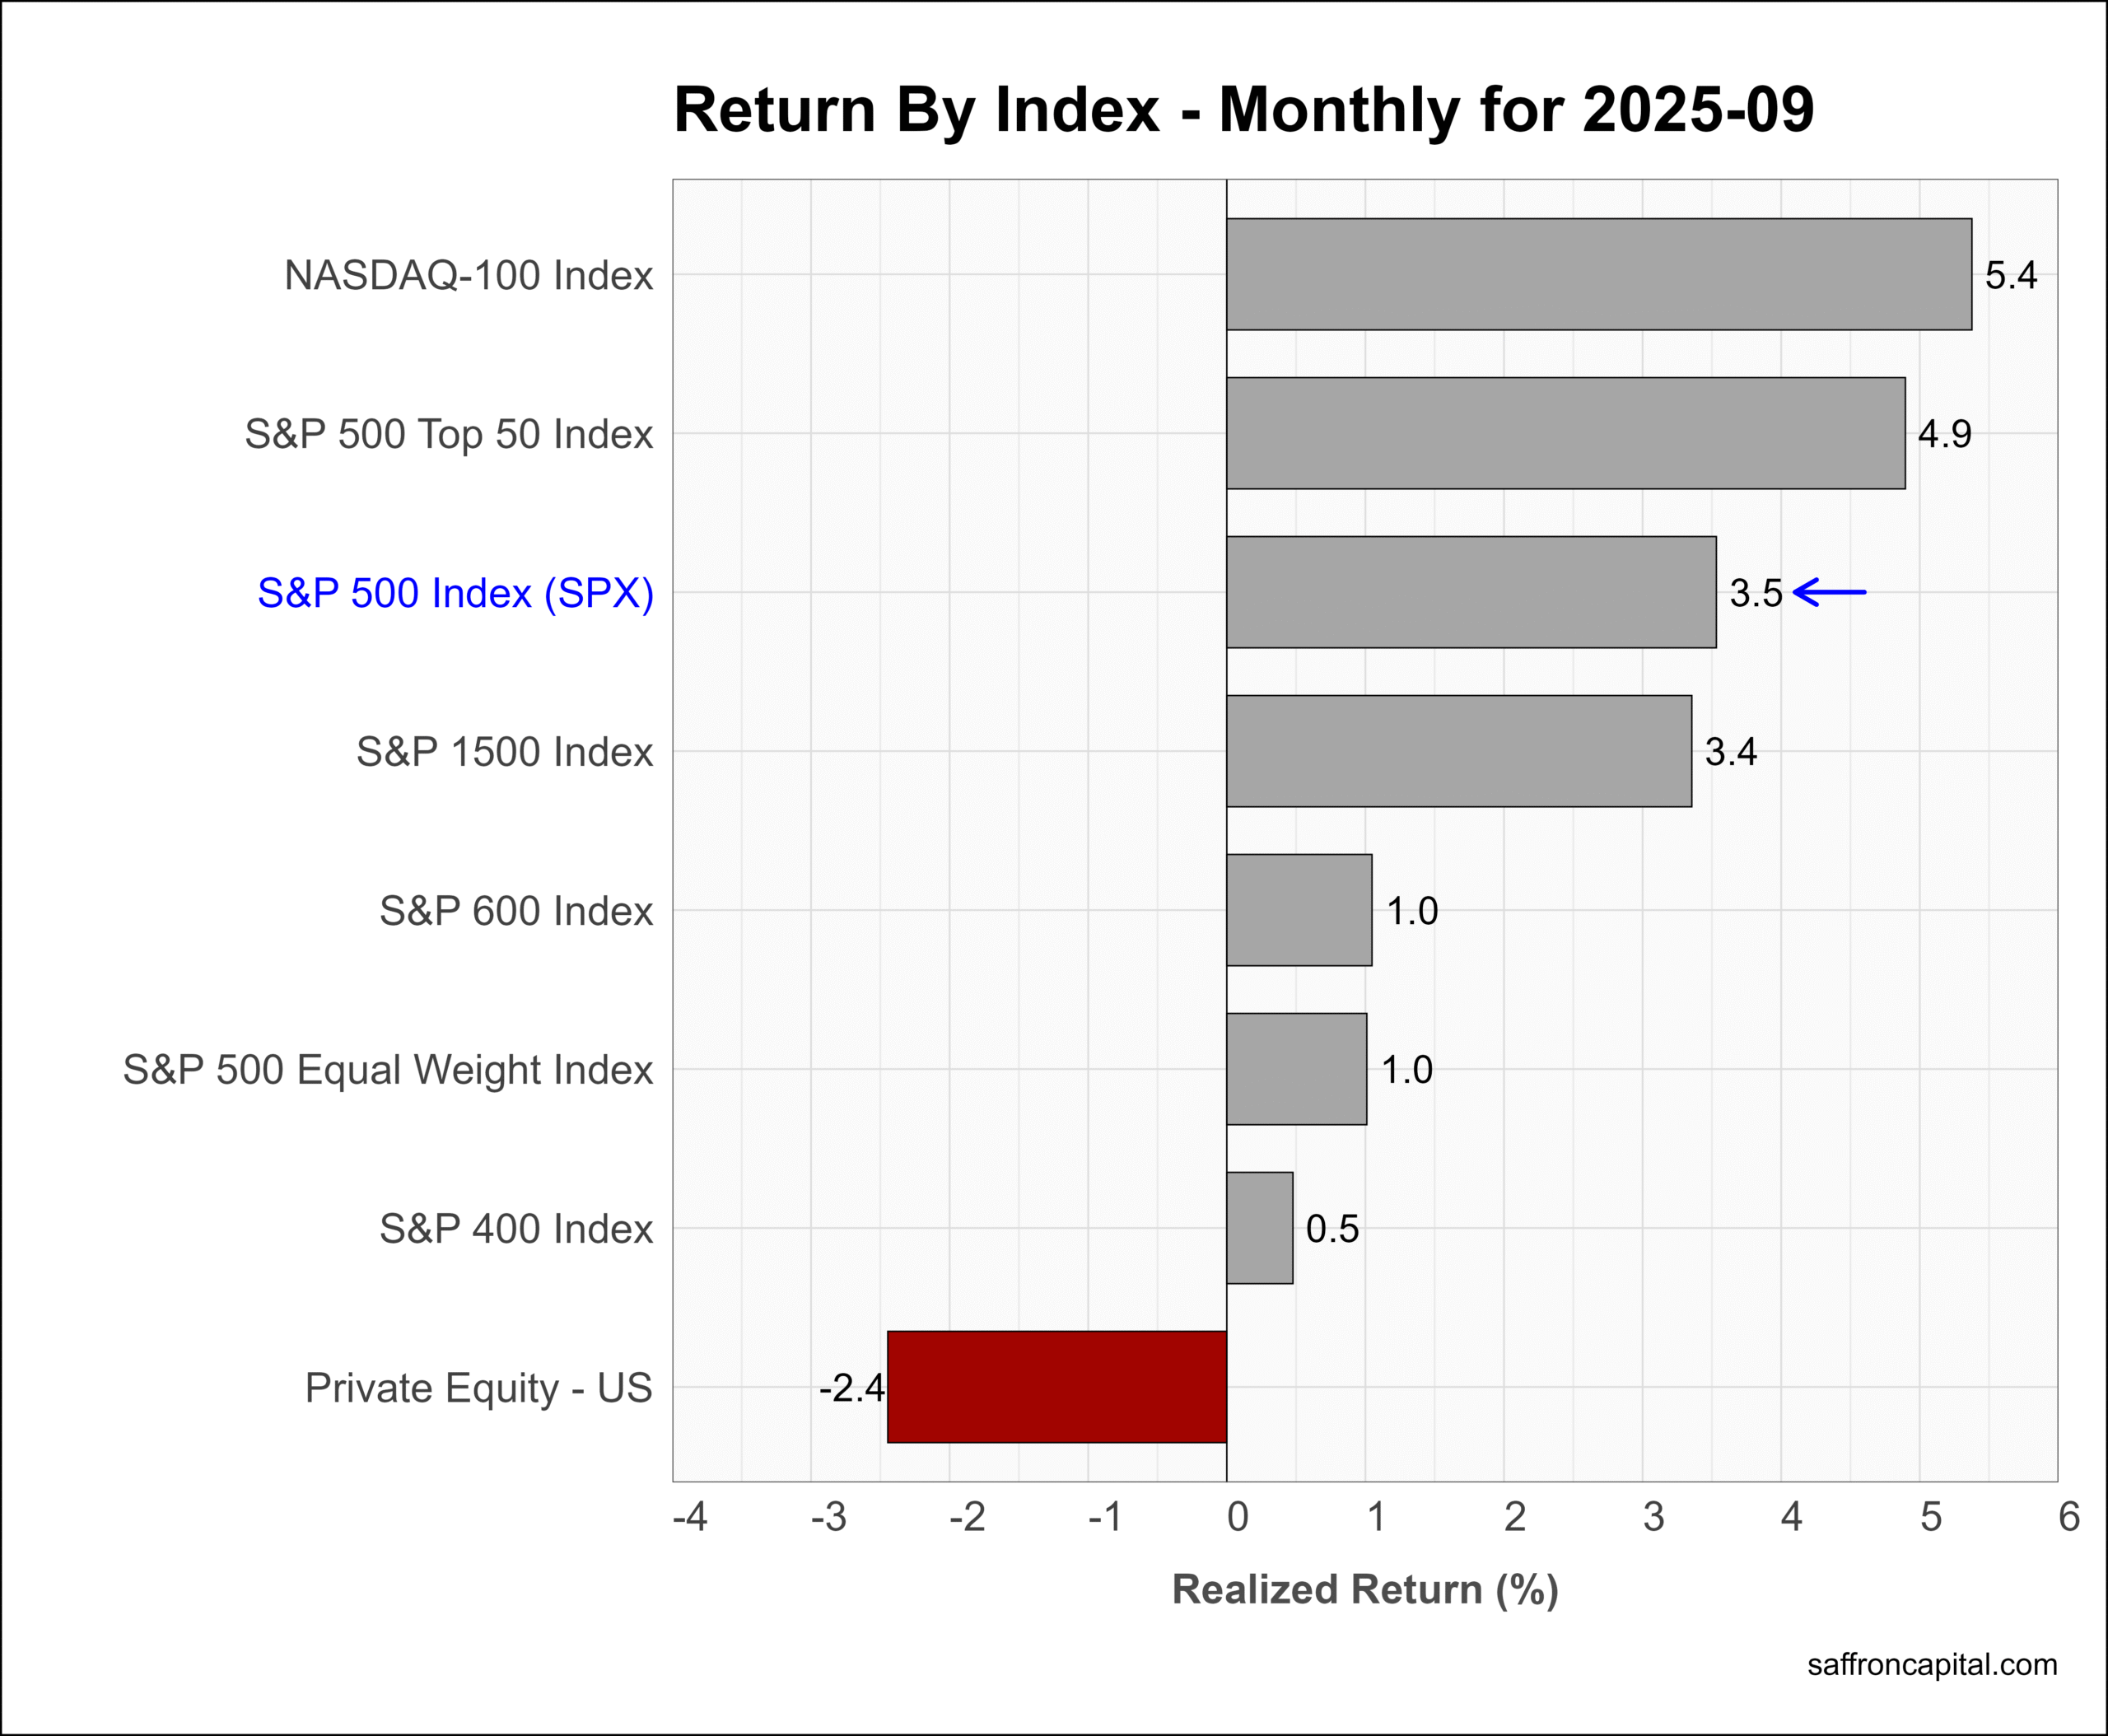
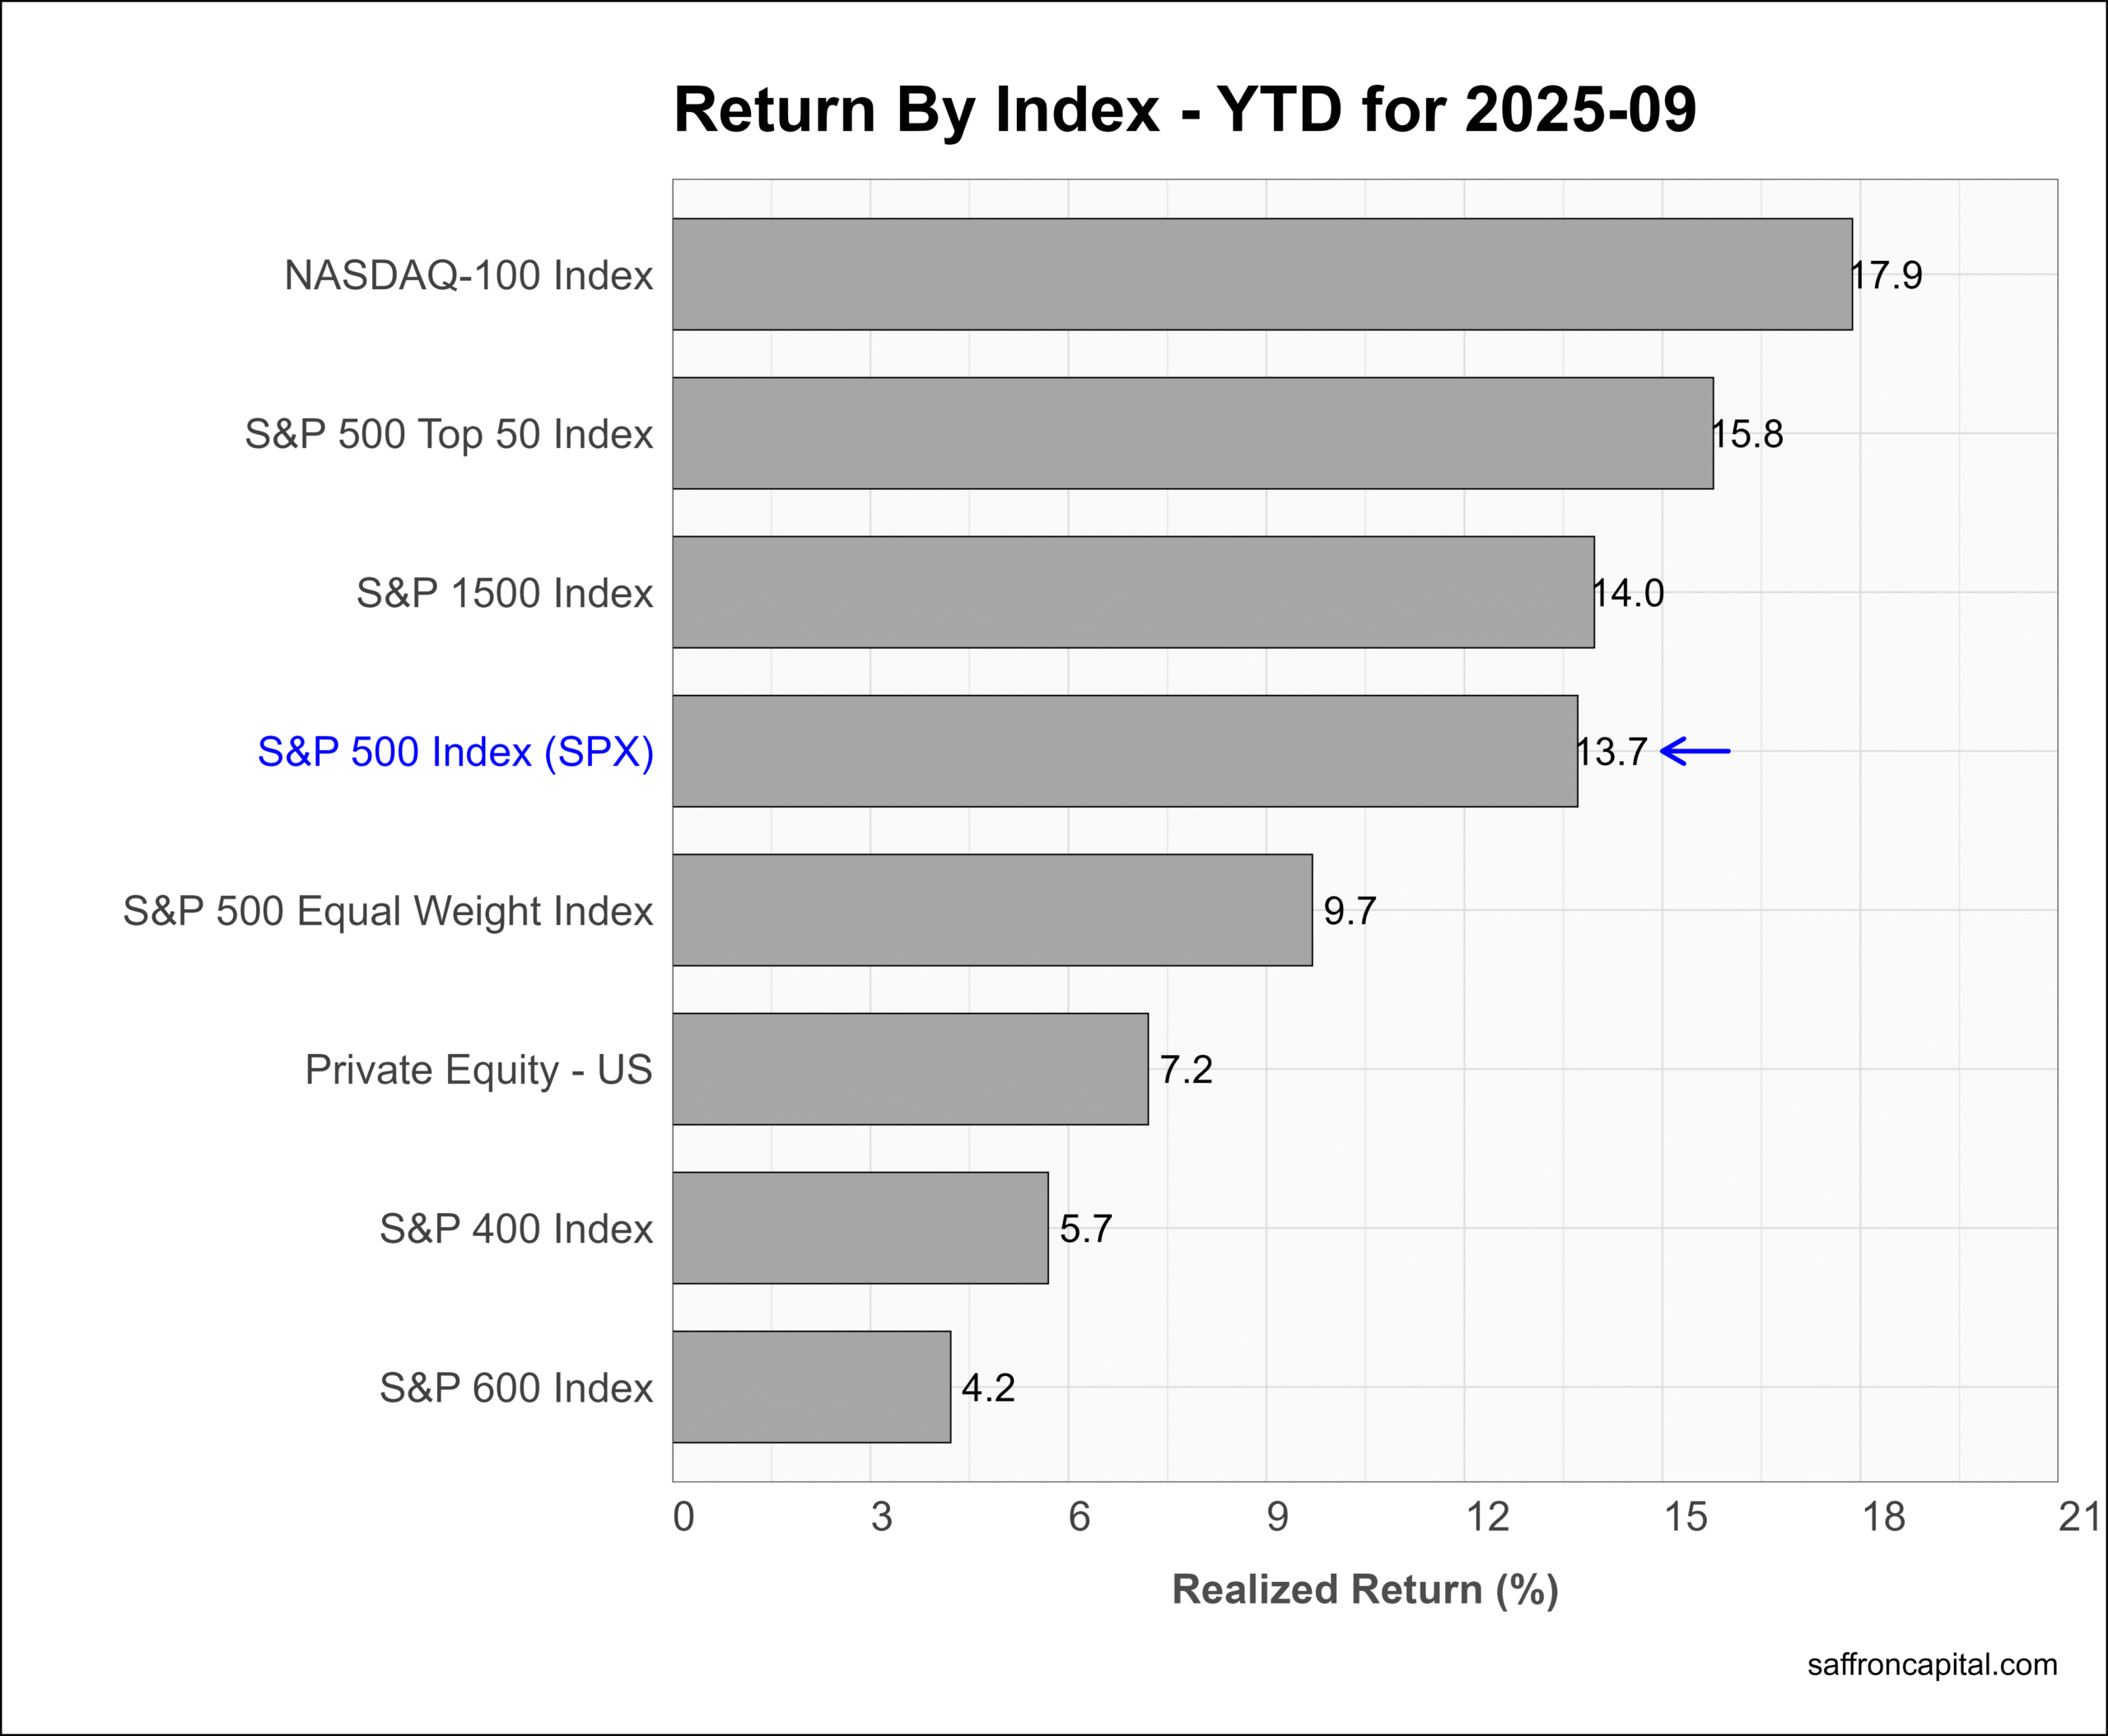
Core US Indices
The NASDAQ 100 index (+5.4%) topped the headline indices in September. Tech stocks benefited from strong earnings upgrades and interest rate sensitivity. The S&P 500 Top 50 index (+4.9%) also performed well as the large-cap easily beat the S&P 600 Small-Cap (+1.0%) and the S&P 400 Mid-Cap (+0.5%) indexes. Private equity funds (-2.4%) saw negative returns. Year-to-date, the benchmark S&P 500 index (+13.7%) is now solidy entrenched with double-digit gains.
Click to enlarge
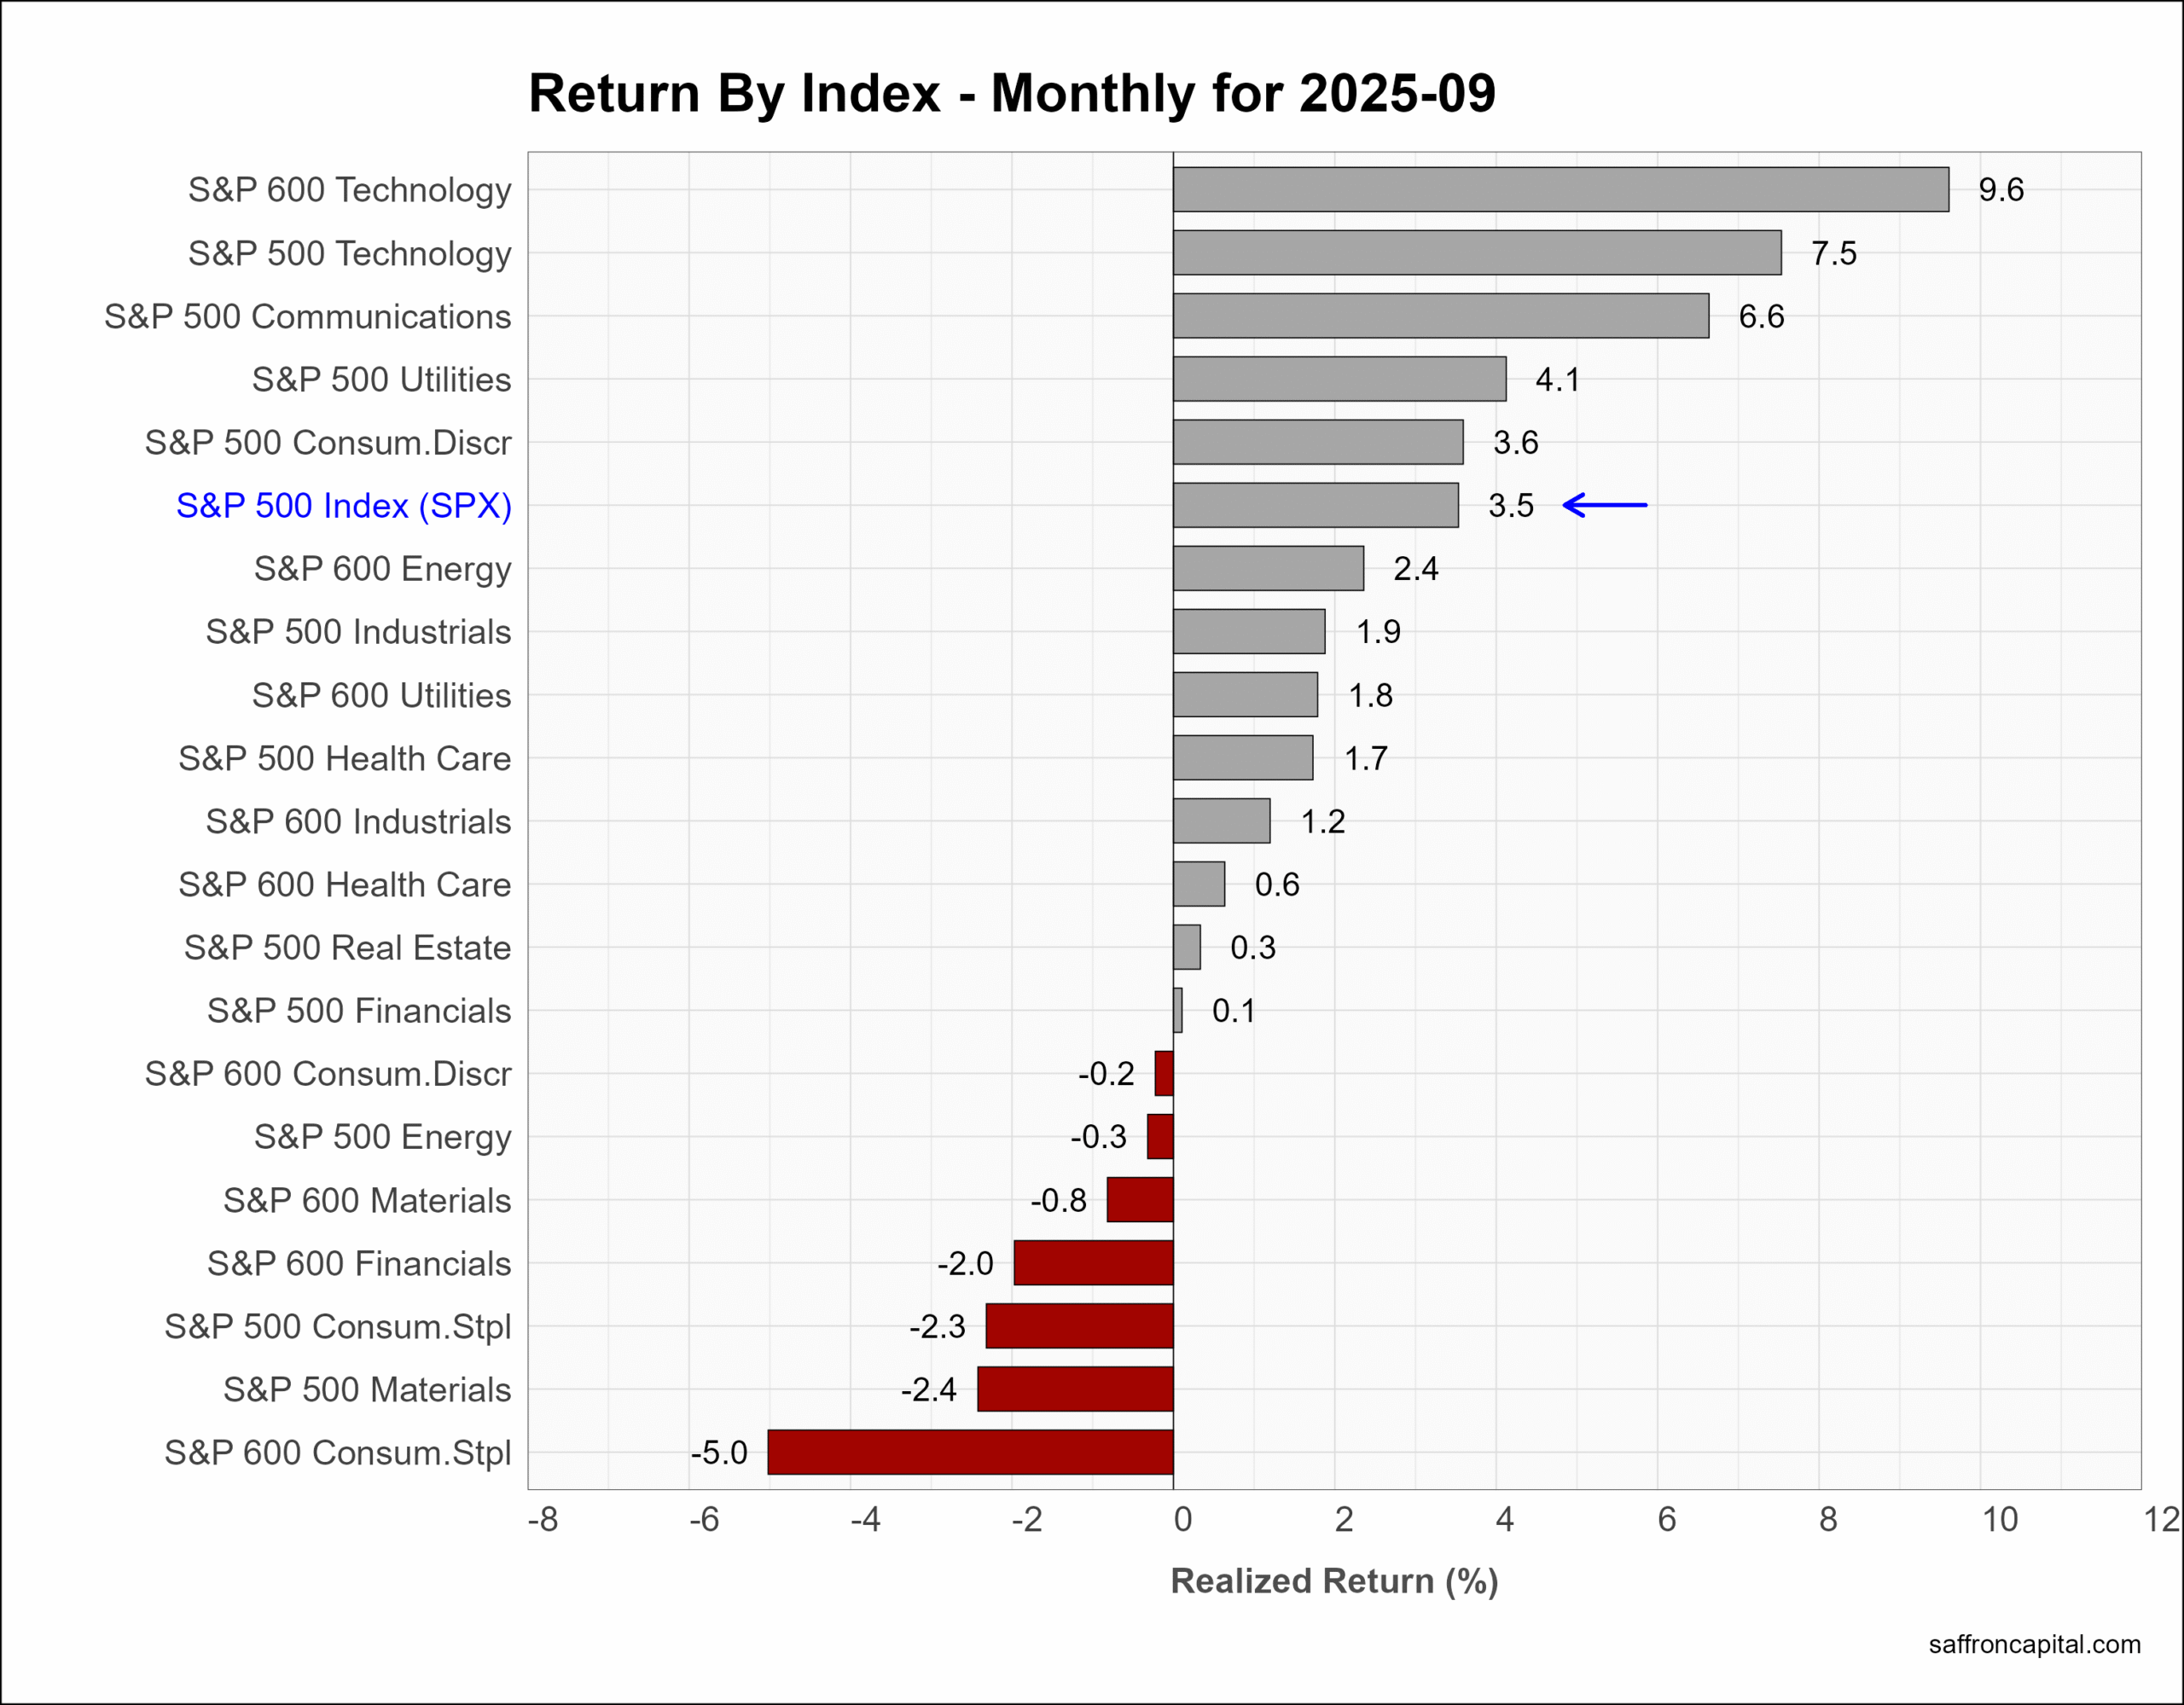
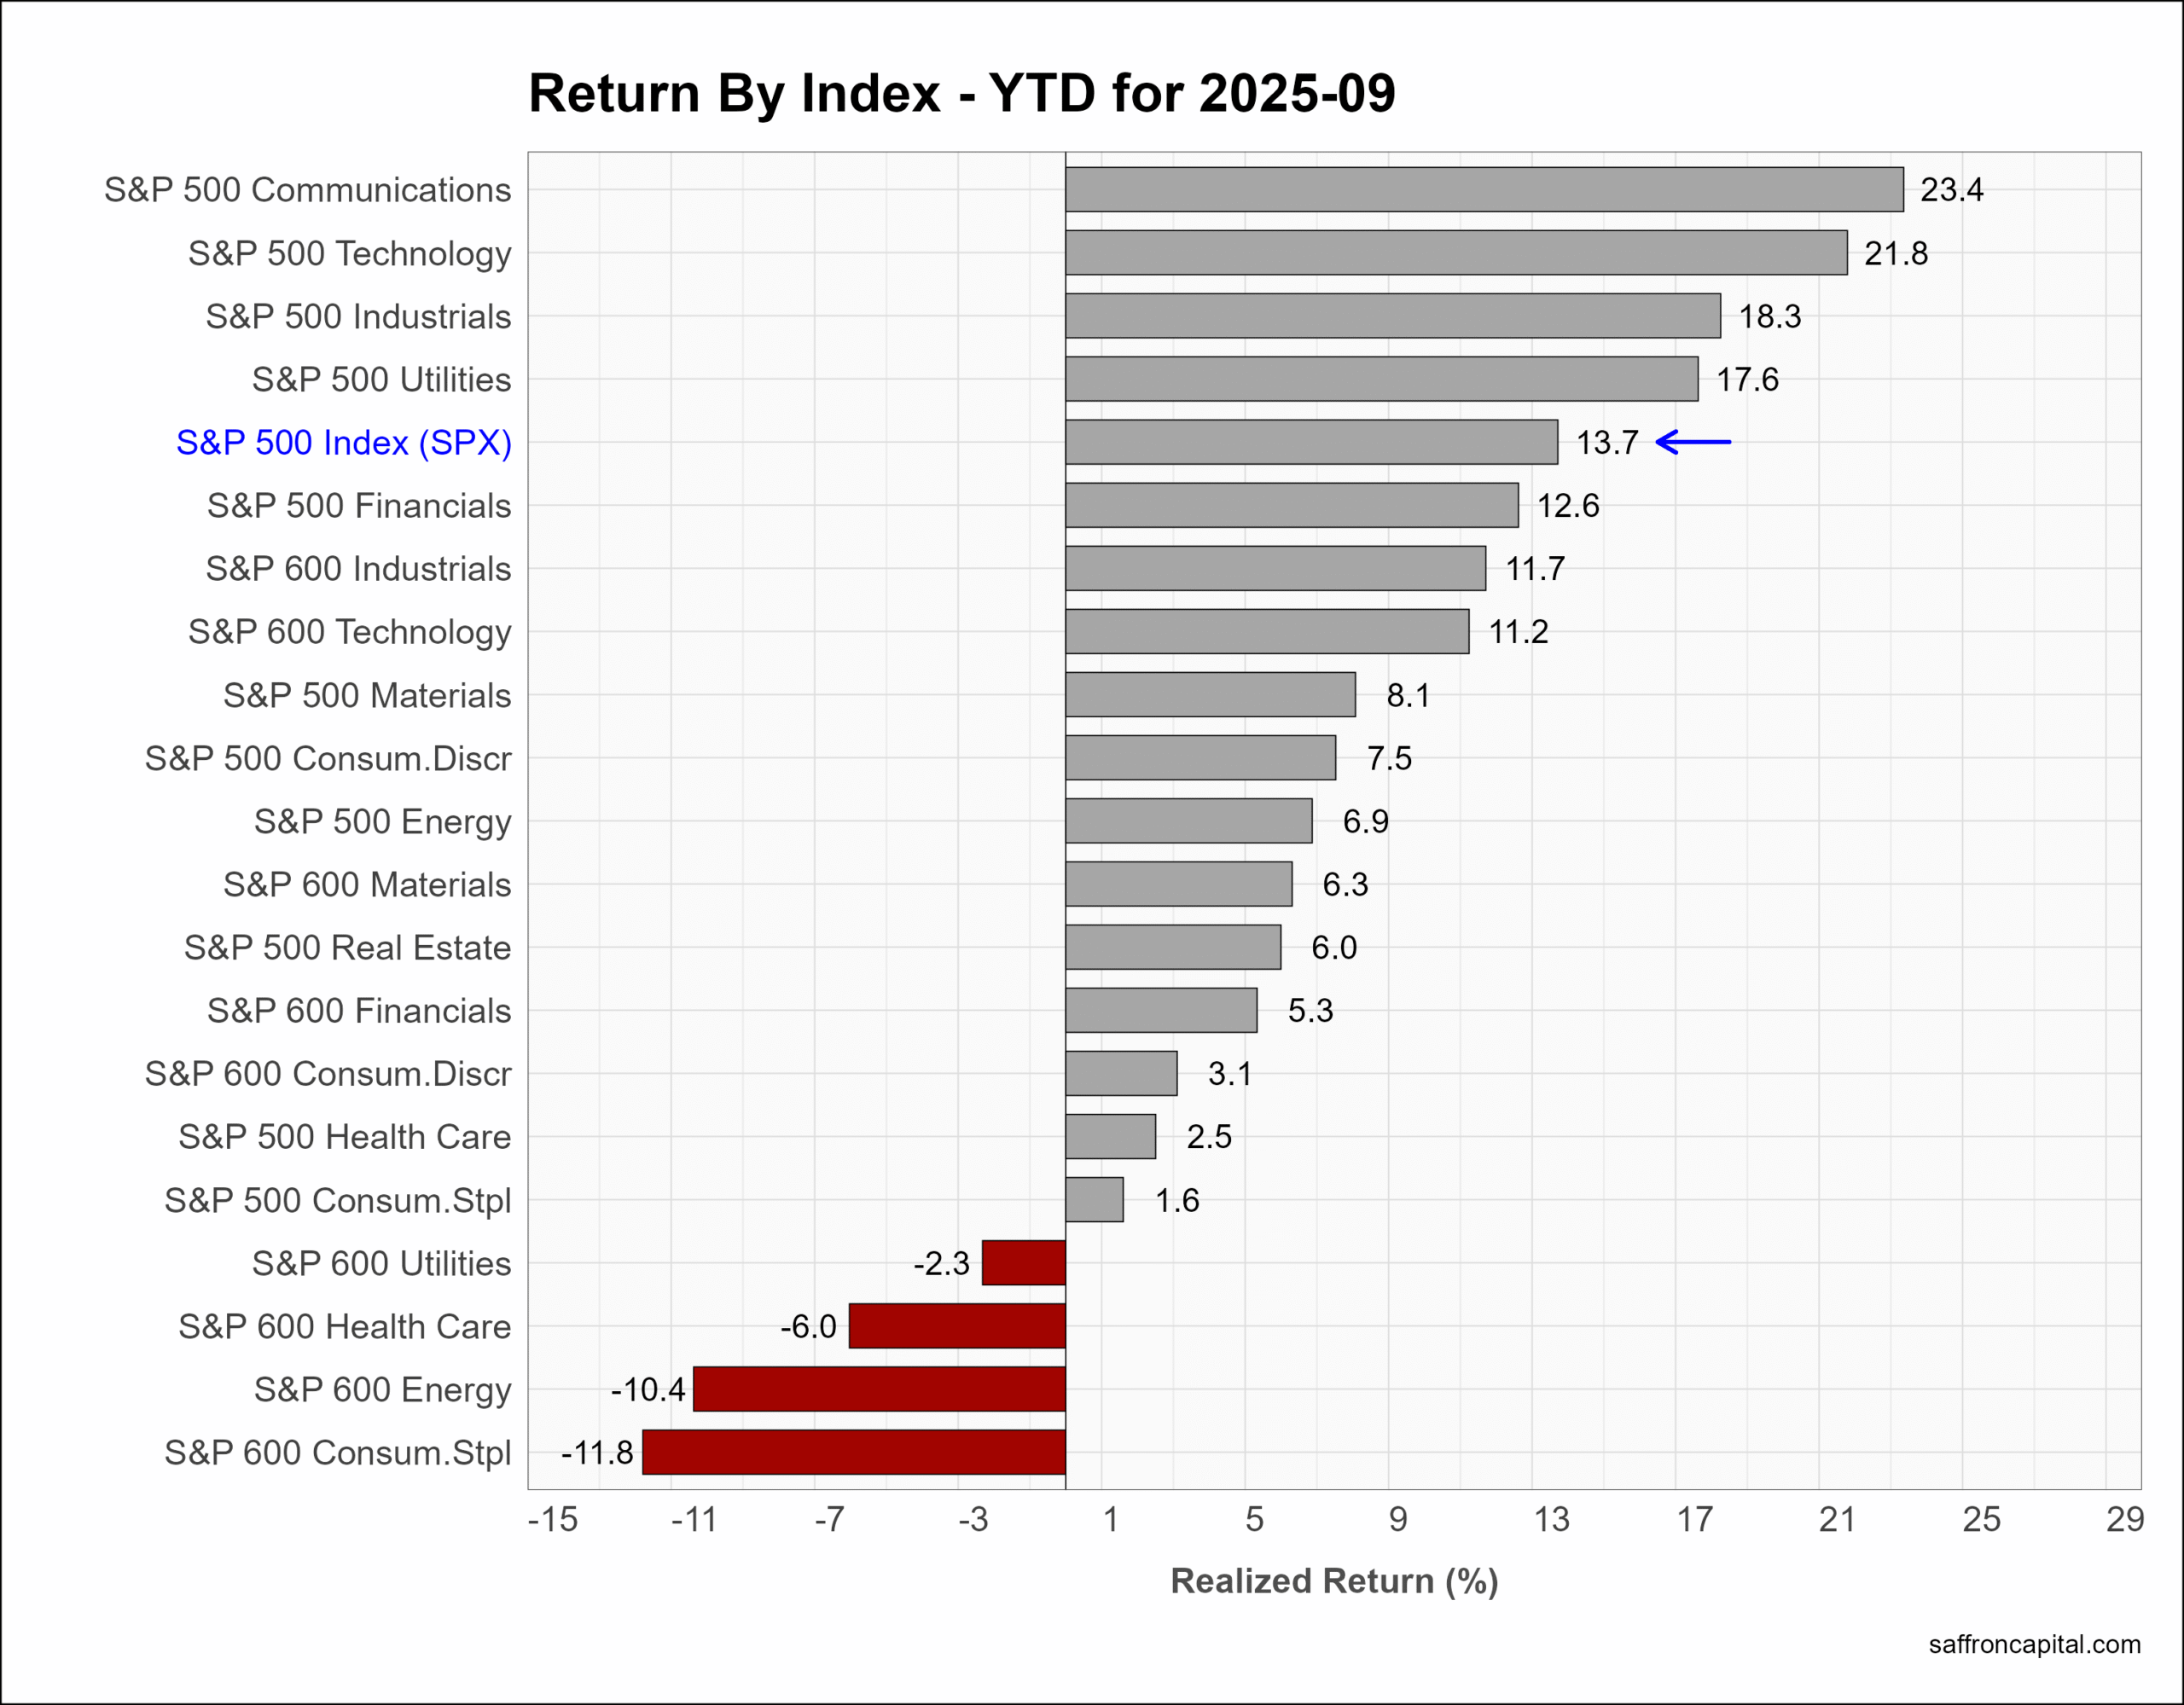
US Sector Indices
Sector rotations impacted September returns, which were led by small-cap Technology (+9.6%), large-cap Technology (+7.5%), and large-cap Communication Services (+6.6%). Among the large caps, laggards in September included Energy (-0.3%), Consumer Staples (-2.3%) and Materials (-2.4%). Year-to-date, Communication Services (+23.4%) tops the list, followed by Technology (+21.8%) and Industrials (+18.3%).
Click to enlarge
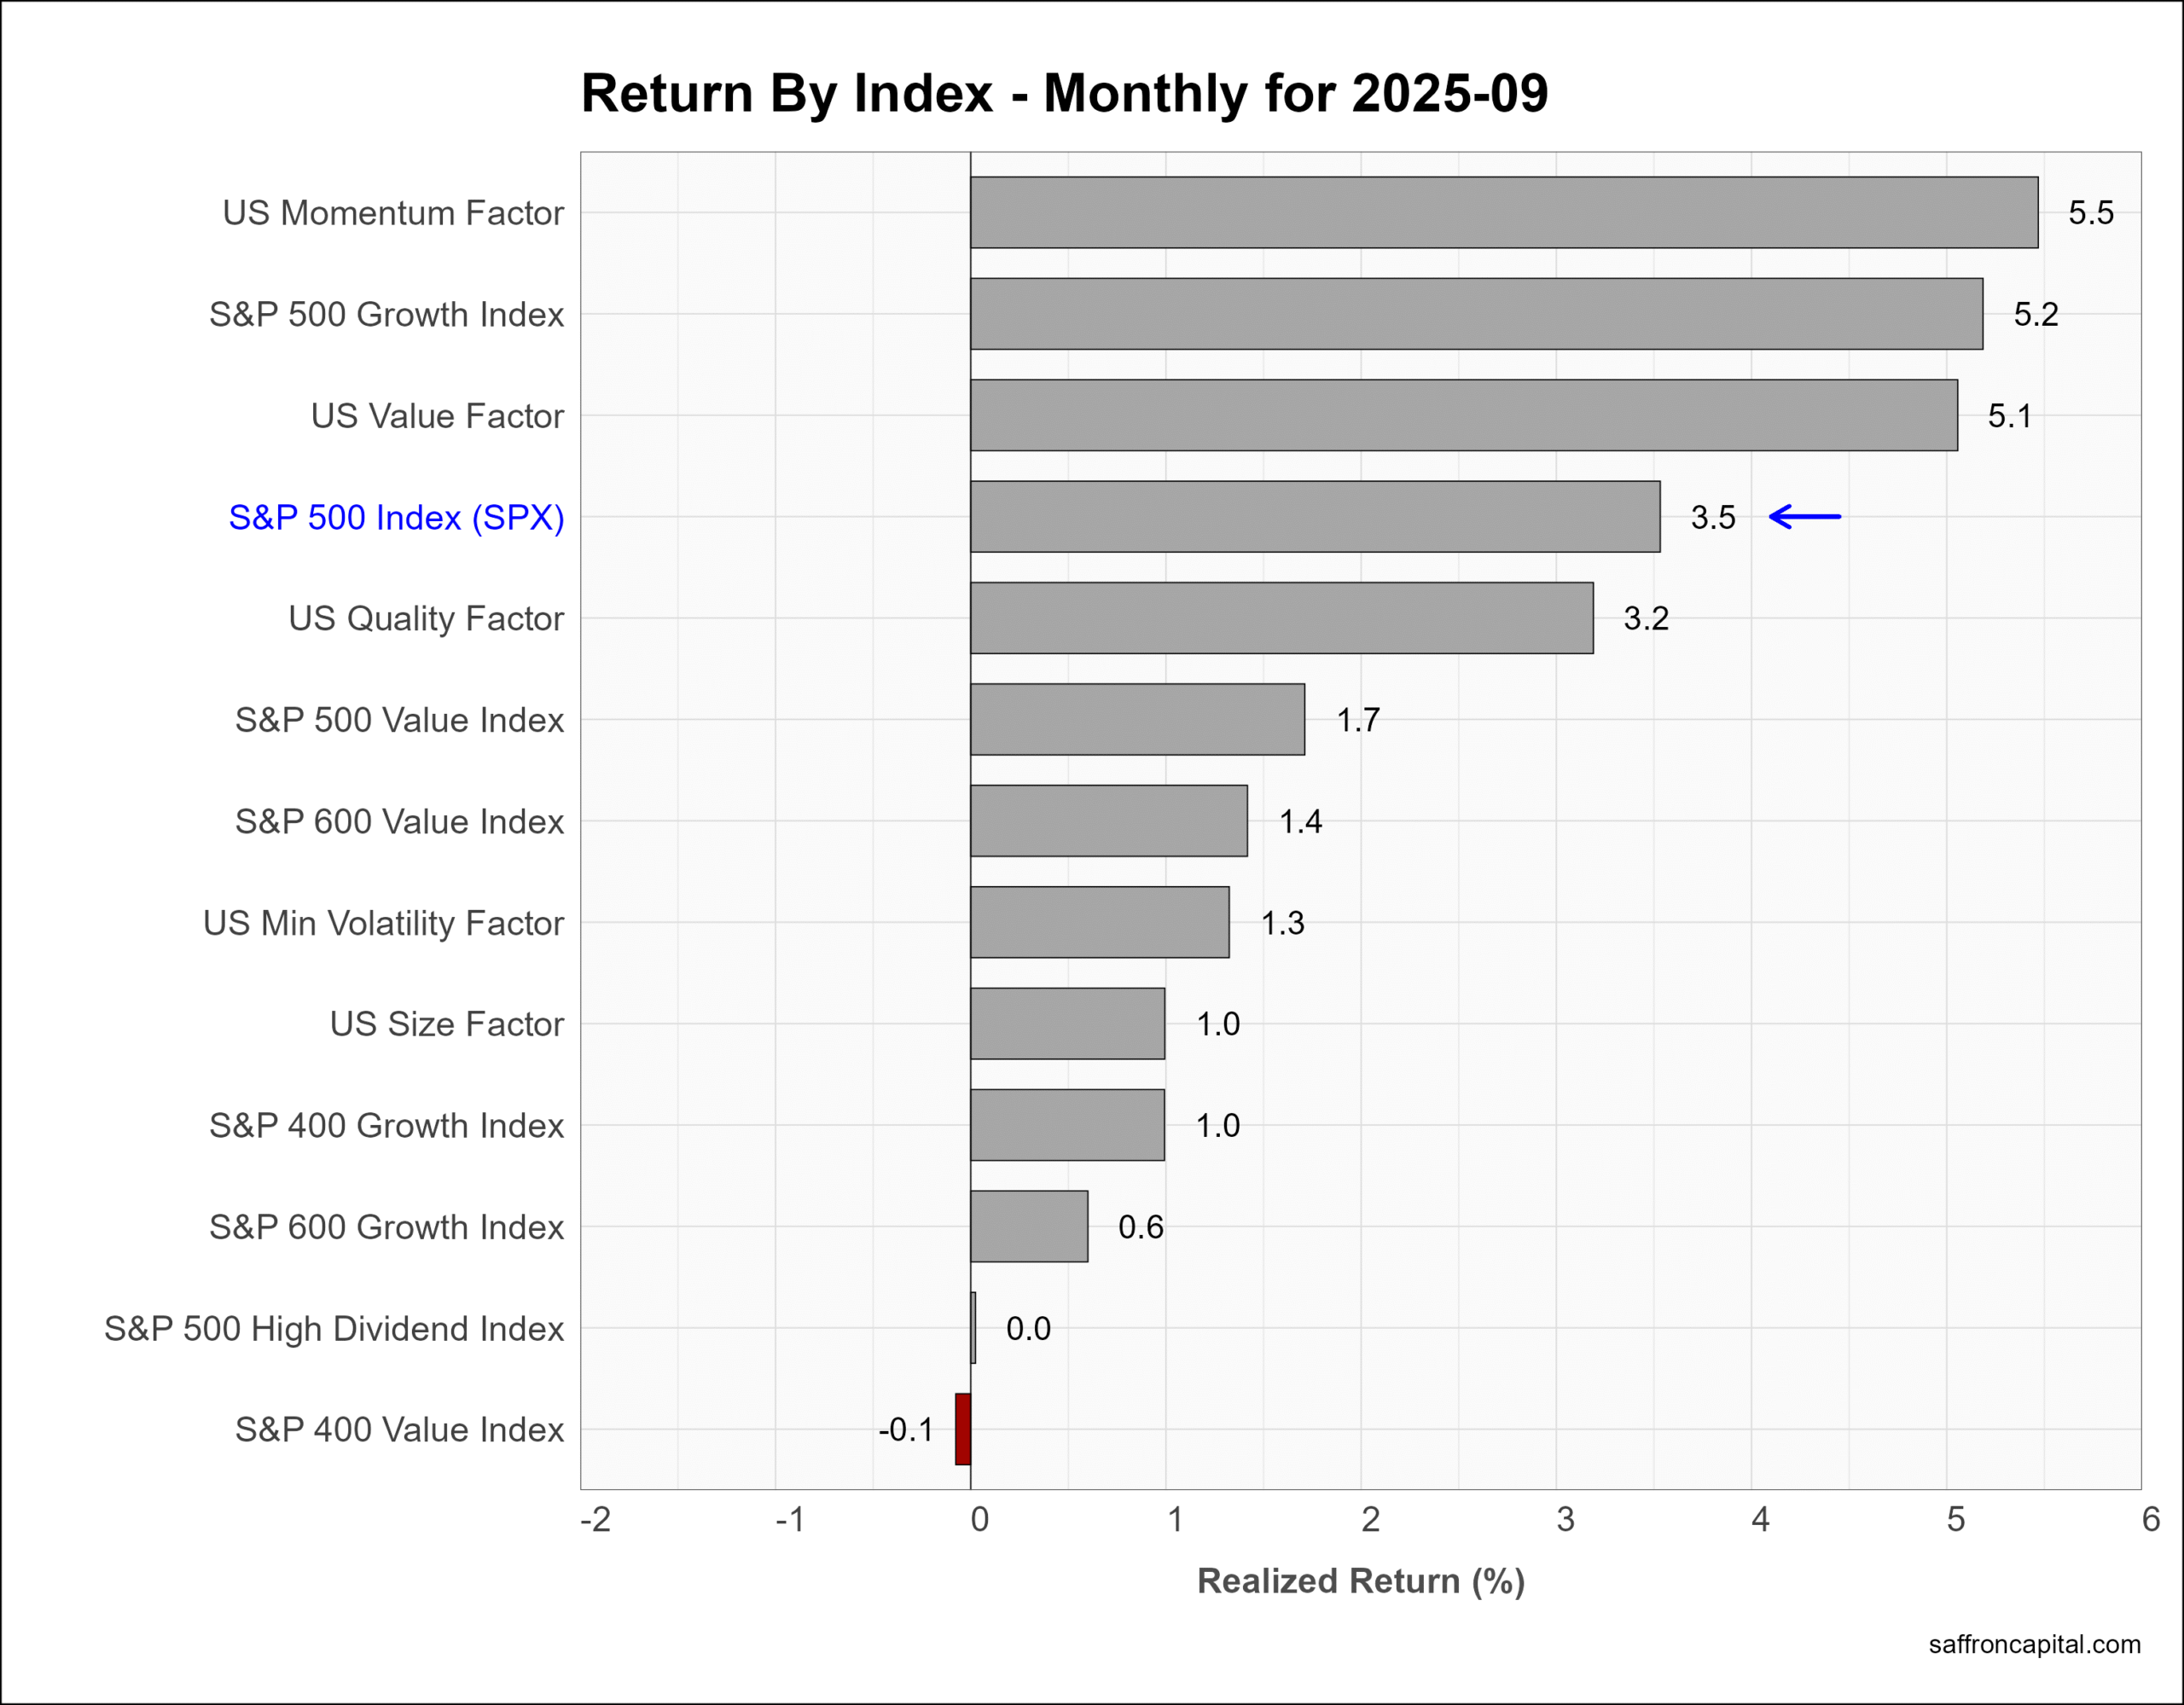
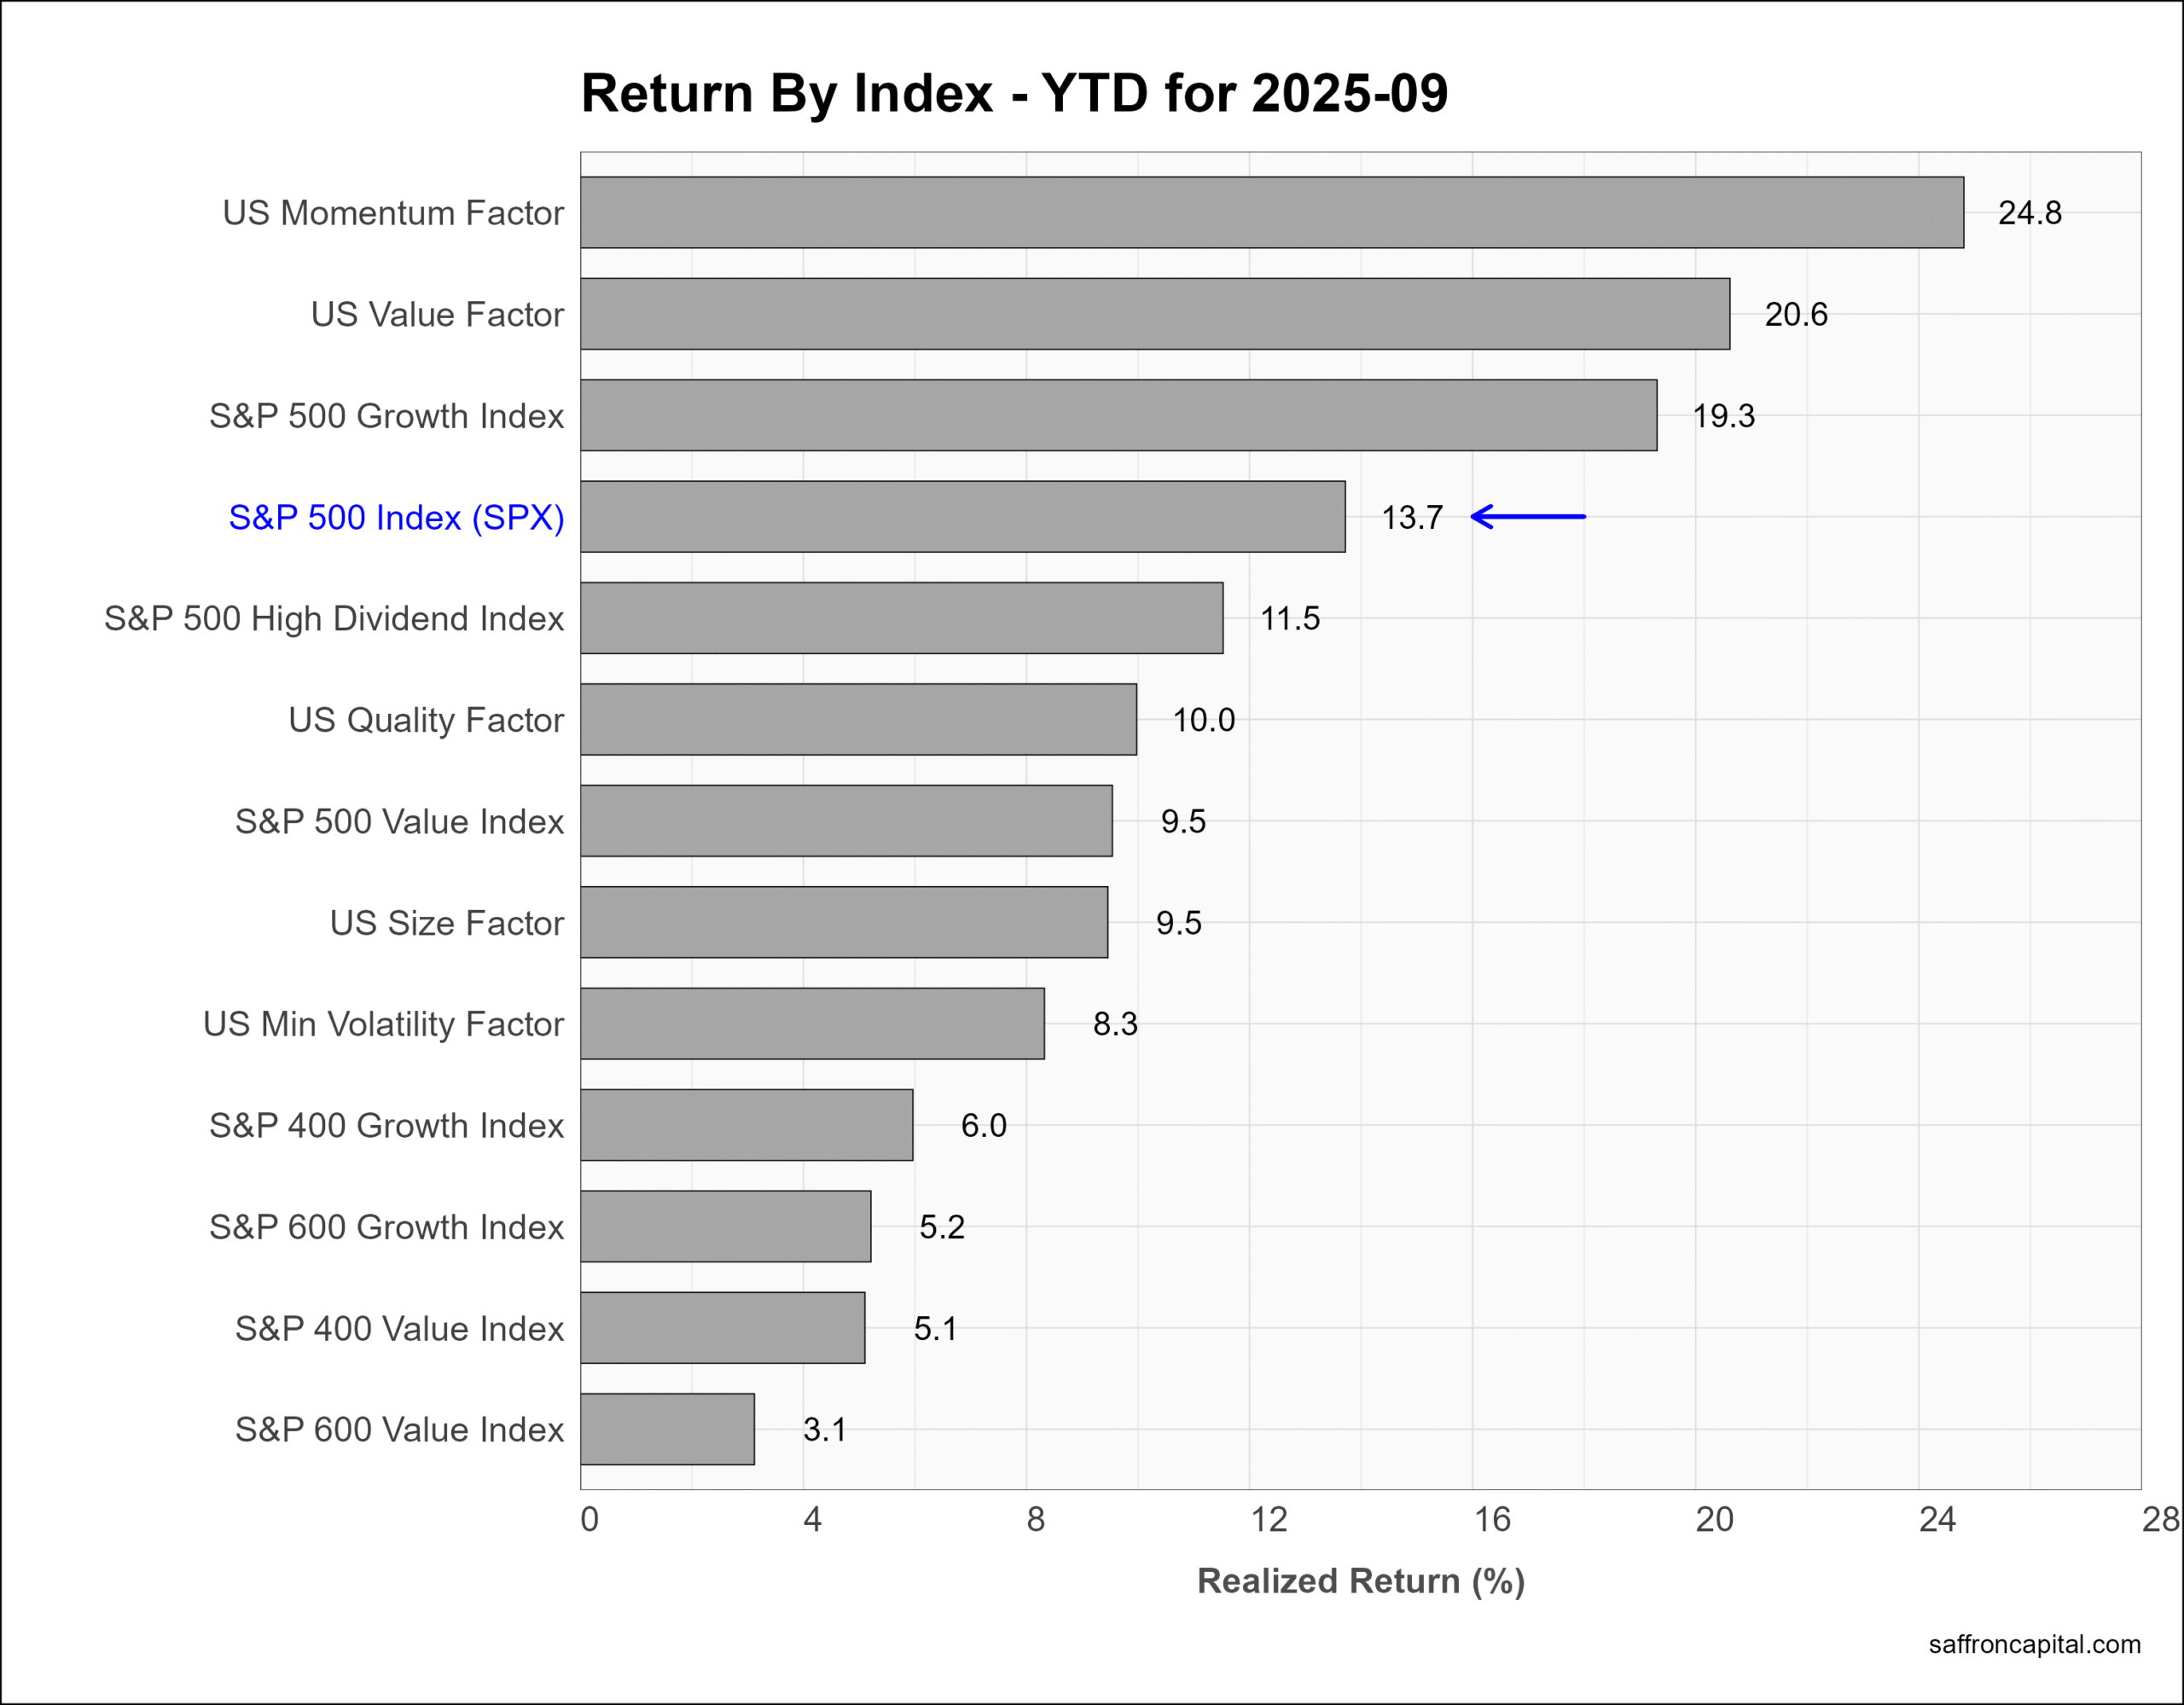
US Factor Indices
Factor portfolios are constructed to focus on the core drivers behind returns, which include company size, relative value, profitability, growth, and momentum. Multi-factor portfolios combine two or more factors. In September, the top performing factor was Momentum (+5.5%), Growth (5.2%), and Value (5.1%). The same factors also top the year-to-date scoreboard and all three are outperforming the S&P 500 index.
Click to enlarge
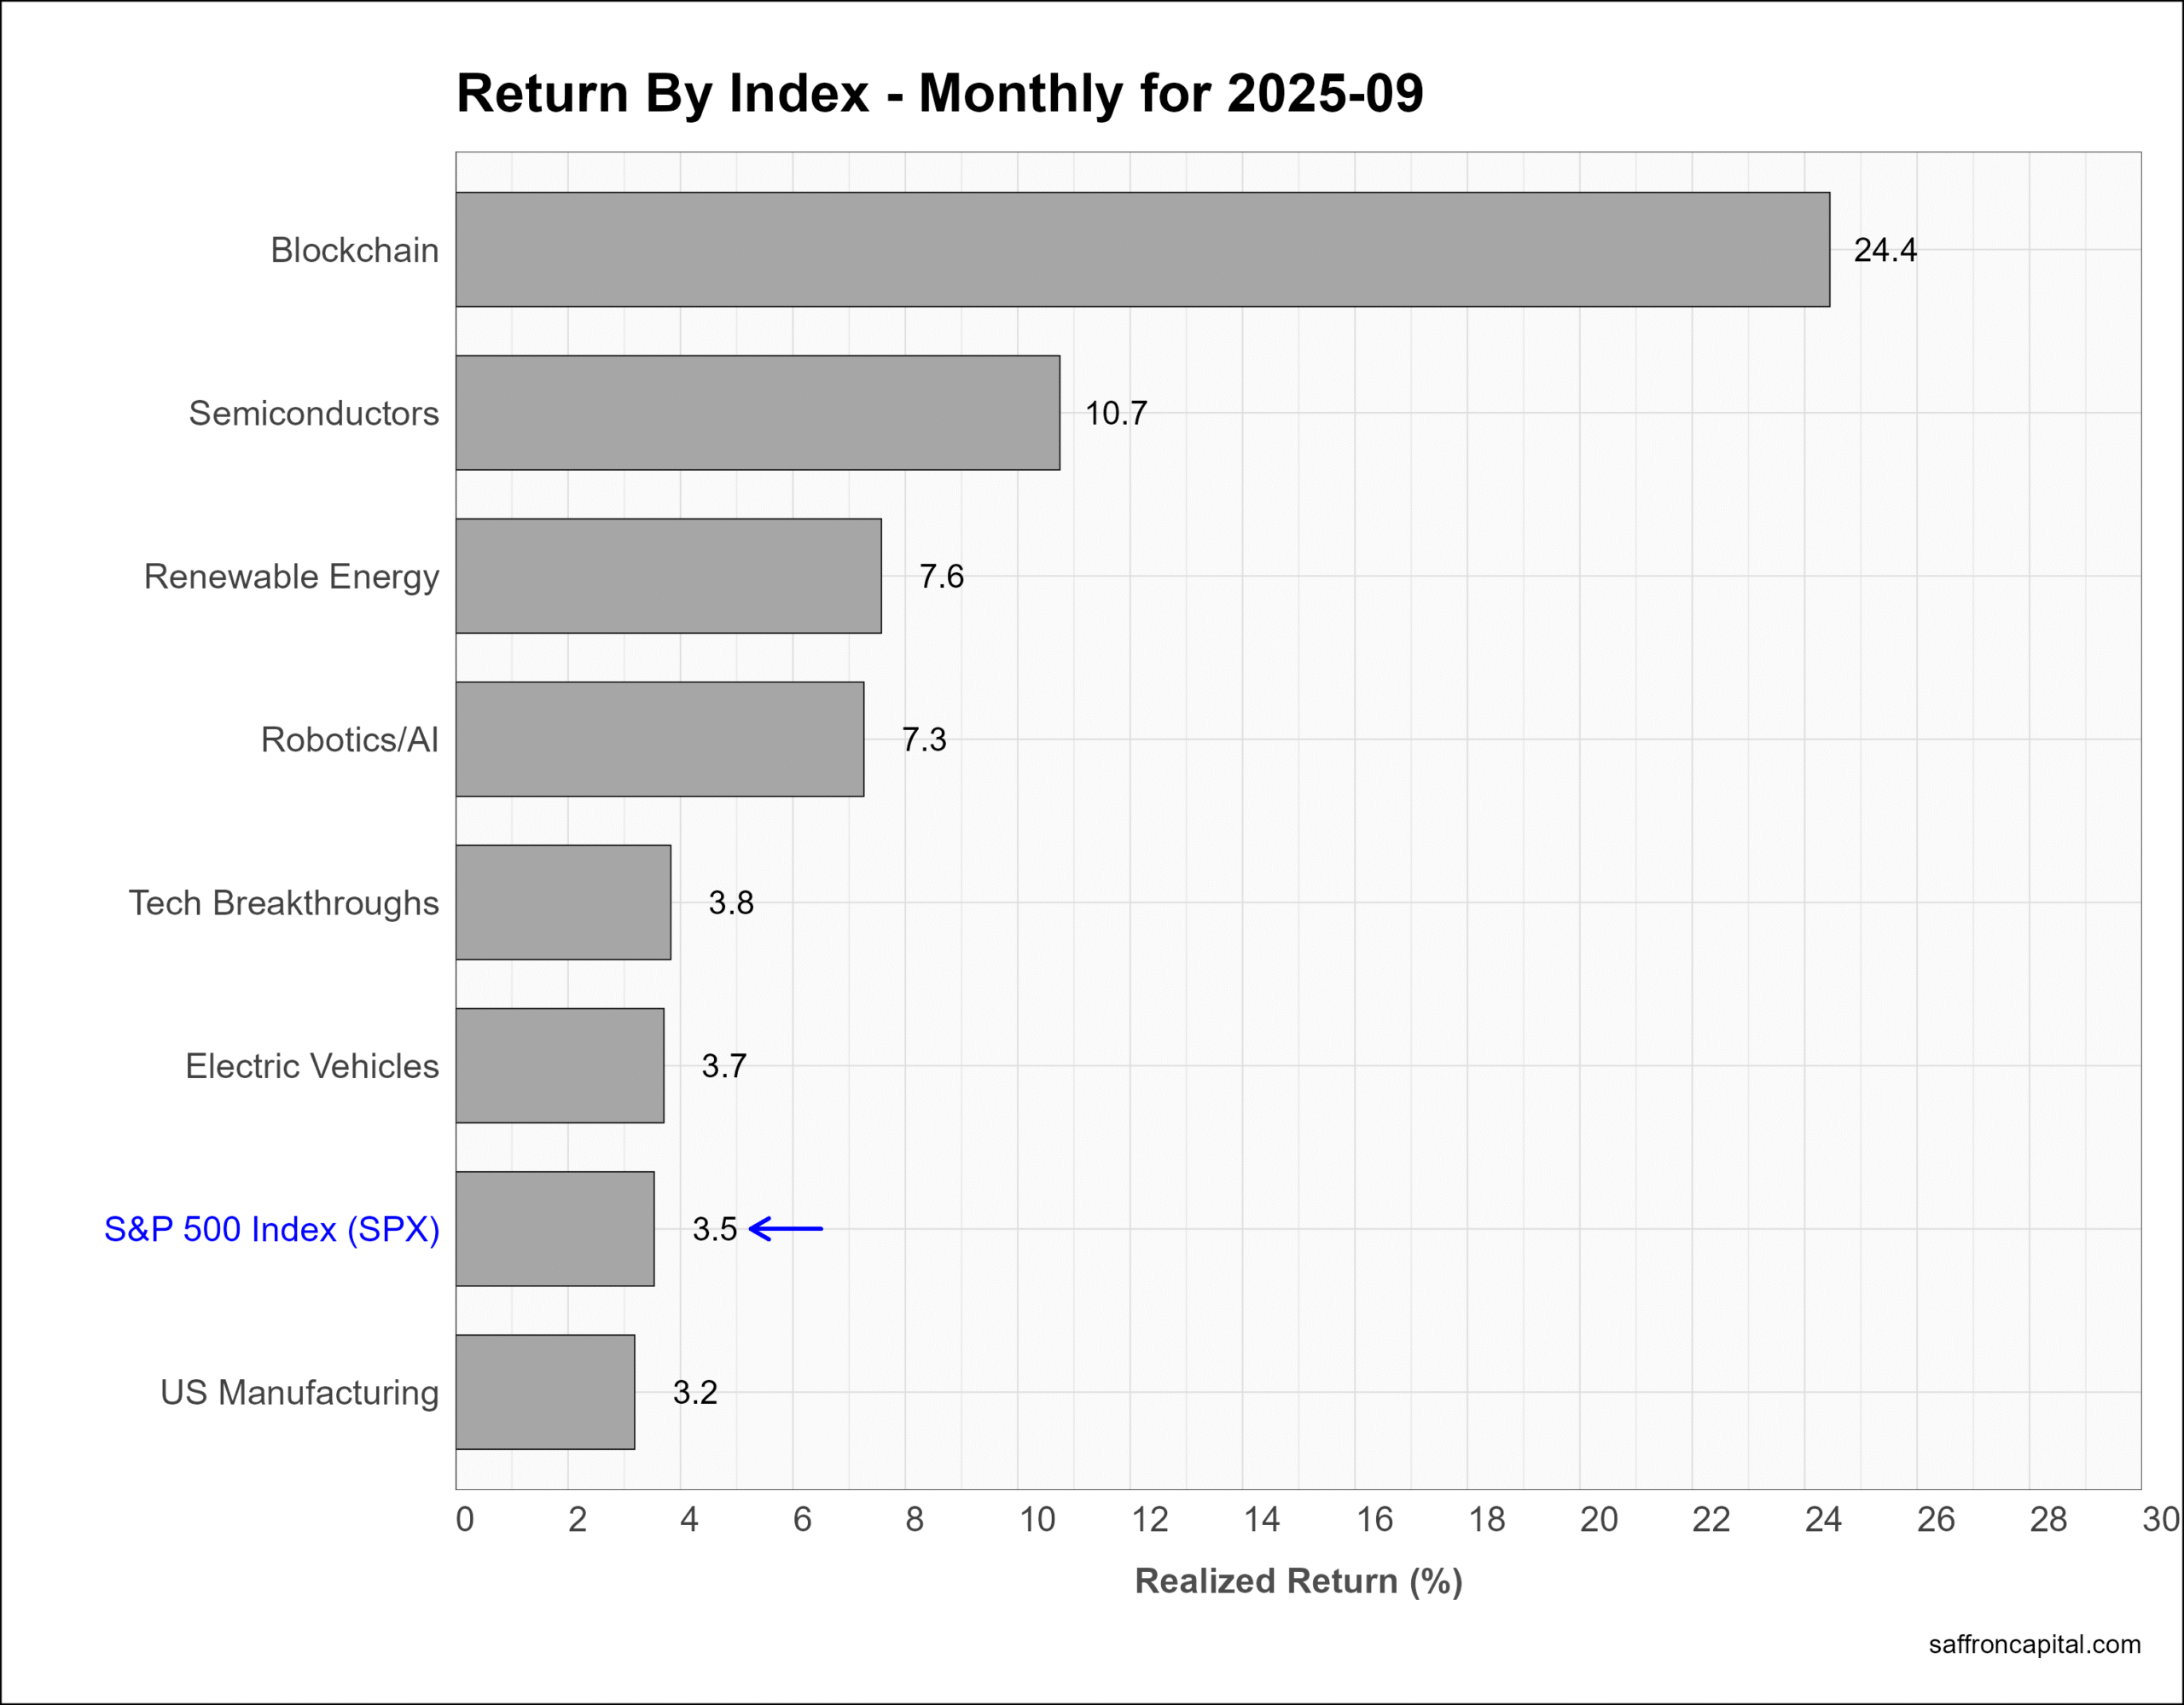
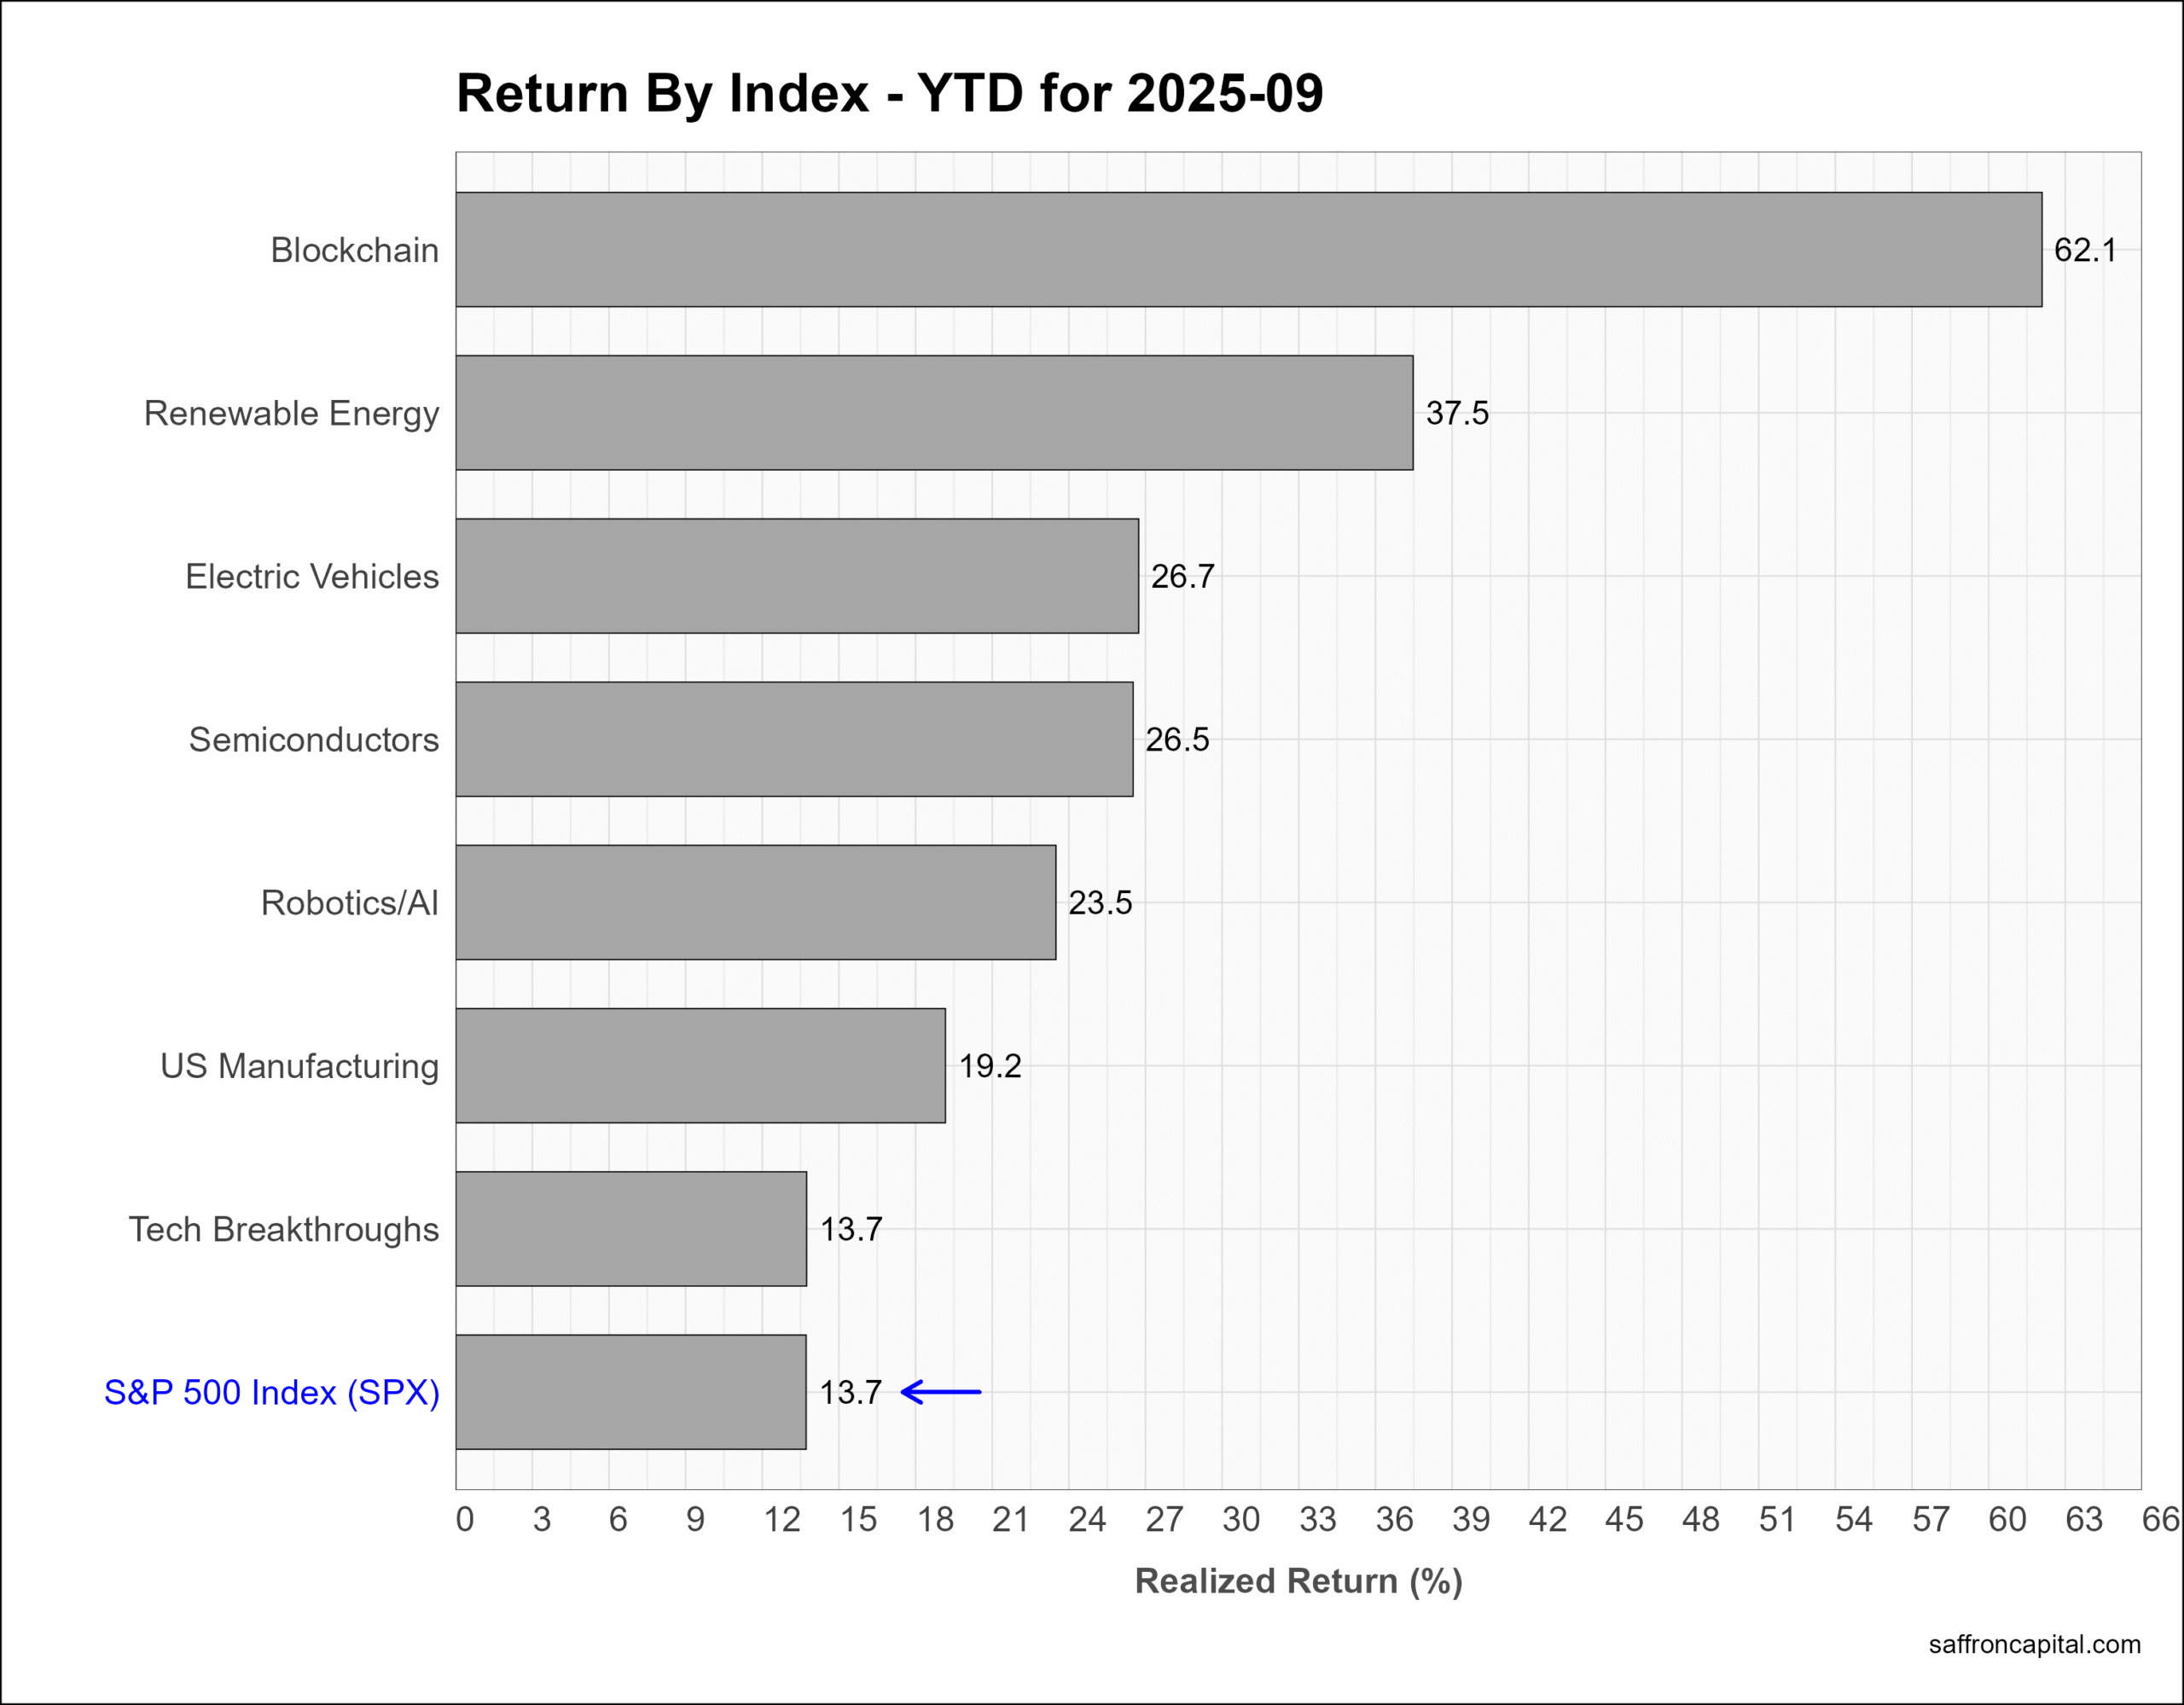
US Thematic Portfolios
US thematic portfolios are portfolios that seek to capture the primary growth trends of the U.S. economy. September returns were led by a surge in Blockchain shares (+24.4%) government and industry begin to apply blockchain technology beyond the crypto markets. Other top performers included Semiconductors (+10.7%) and Renewable energy (+7.6%) shares. Since January, all the thematic portfolios tracked are outperforming the S&P 500 index. The top spot goes to Blockchain shares (+62.1%), followed by Renewable Energy (+37.5%) and Electric Vehicles (+26.7%).
Click to enlarge
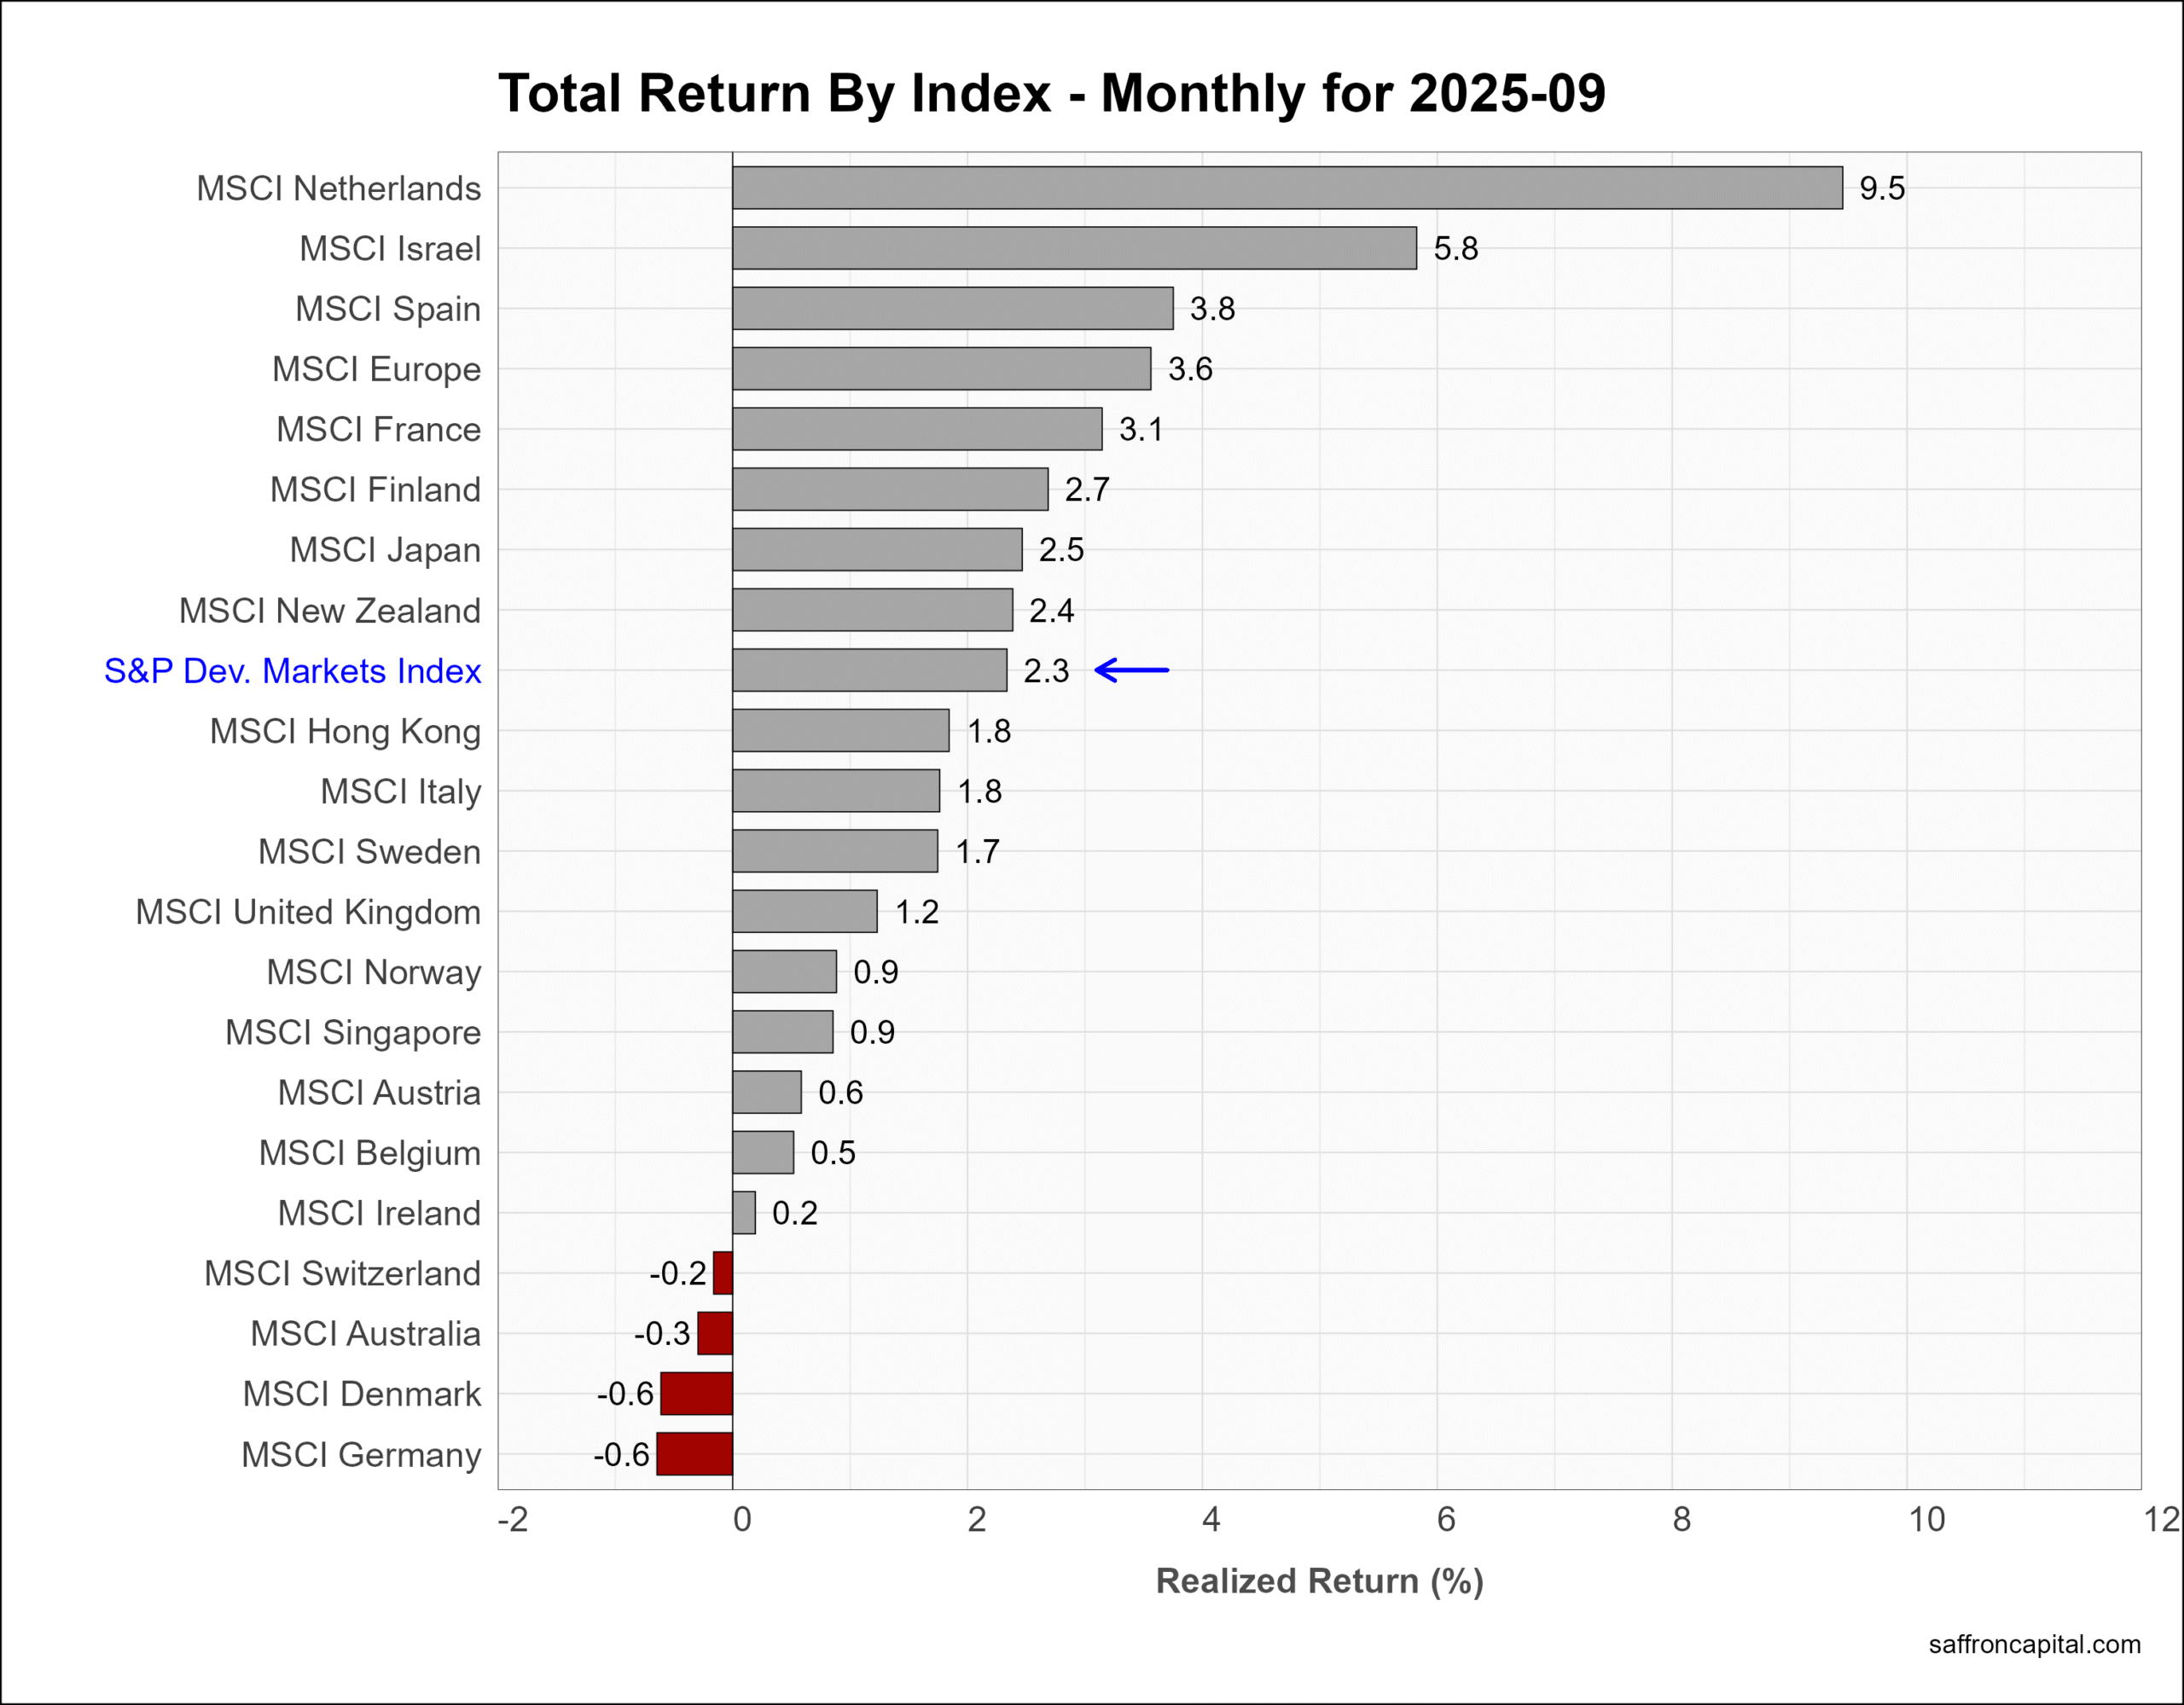
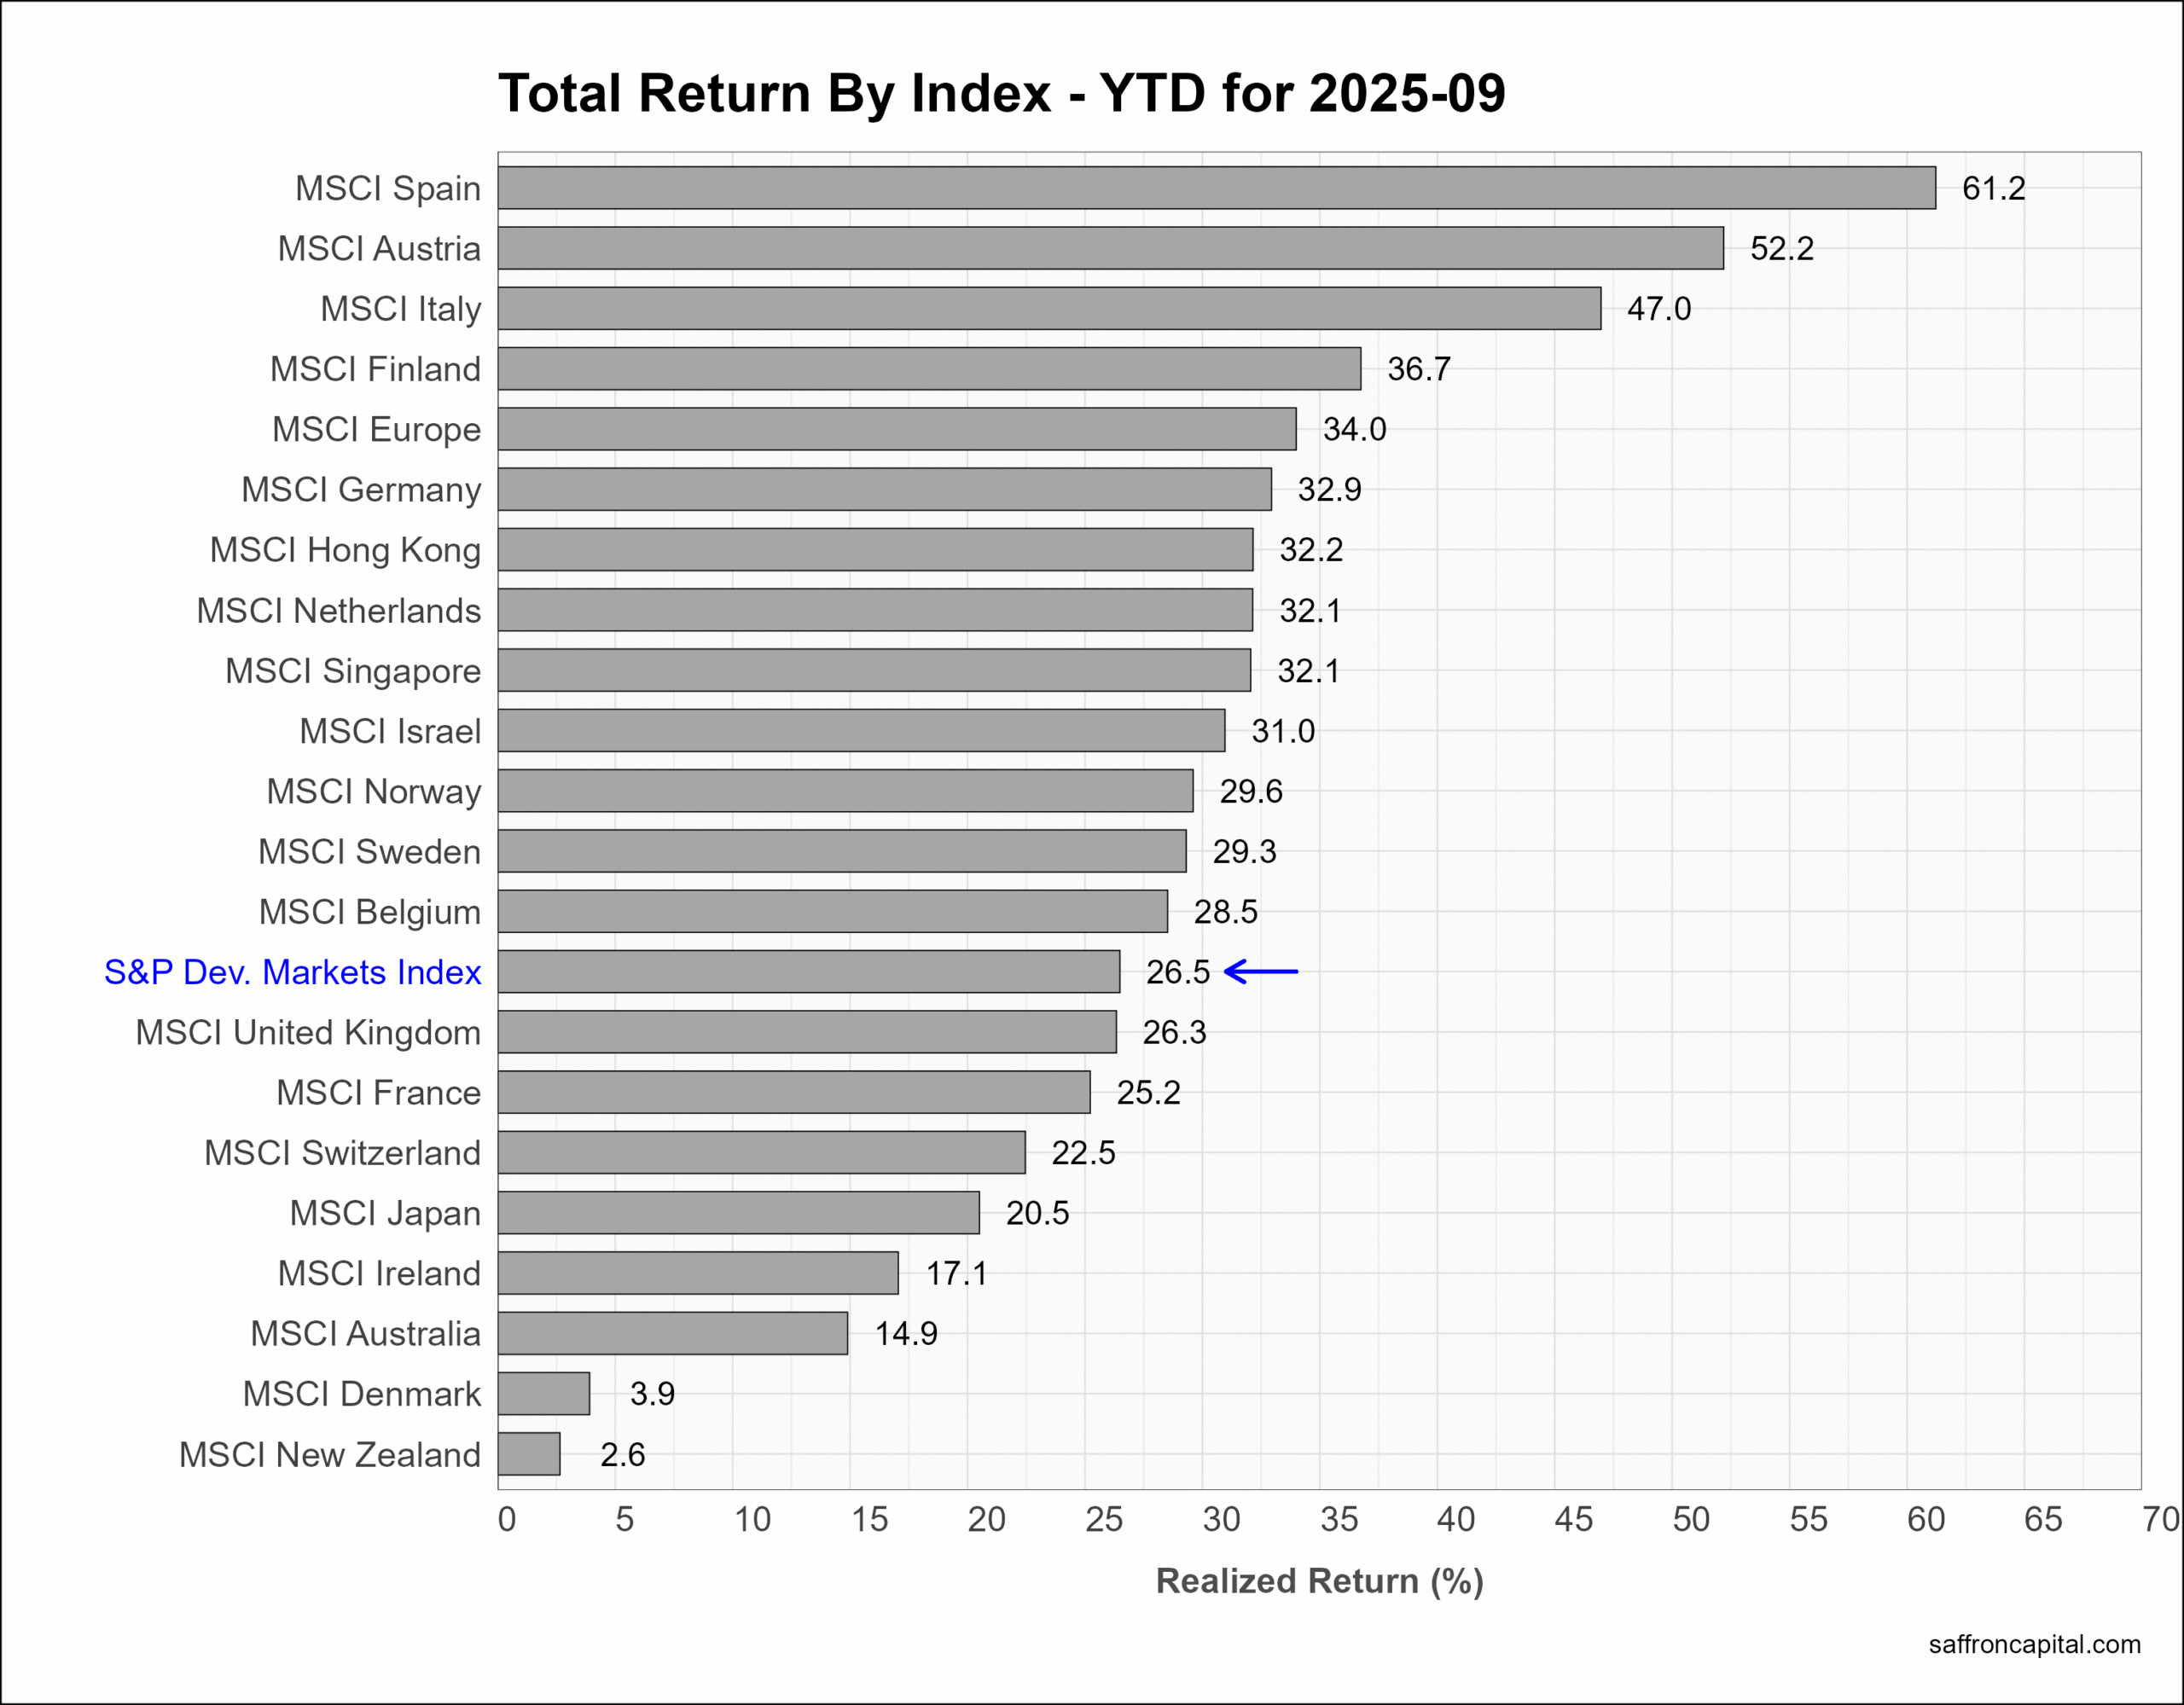
Developed Market Equities
The S&P Developed Markets index (+2.3%) lagged US benchmarks in September, but notable performance was seen in markets in the Netherlands (+9.5%) and Israel (+5.6%). European shares (+3.8%) had some of the weakest performers, including Germany (0.8%) and Denmark (-0.6%). The best markets year-to-date include Spain (+61.2%), Austria (+52.2%) and Italy (+47.0%).
Click to enlarge
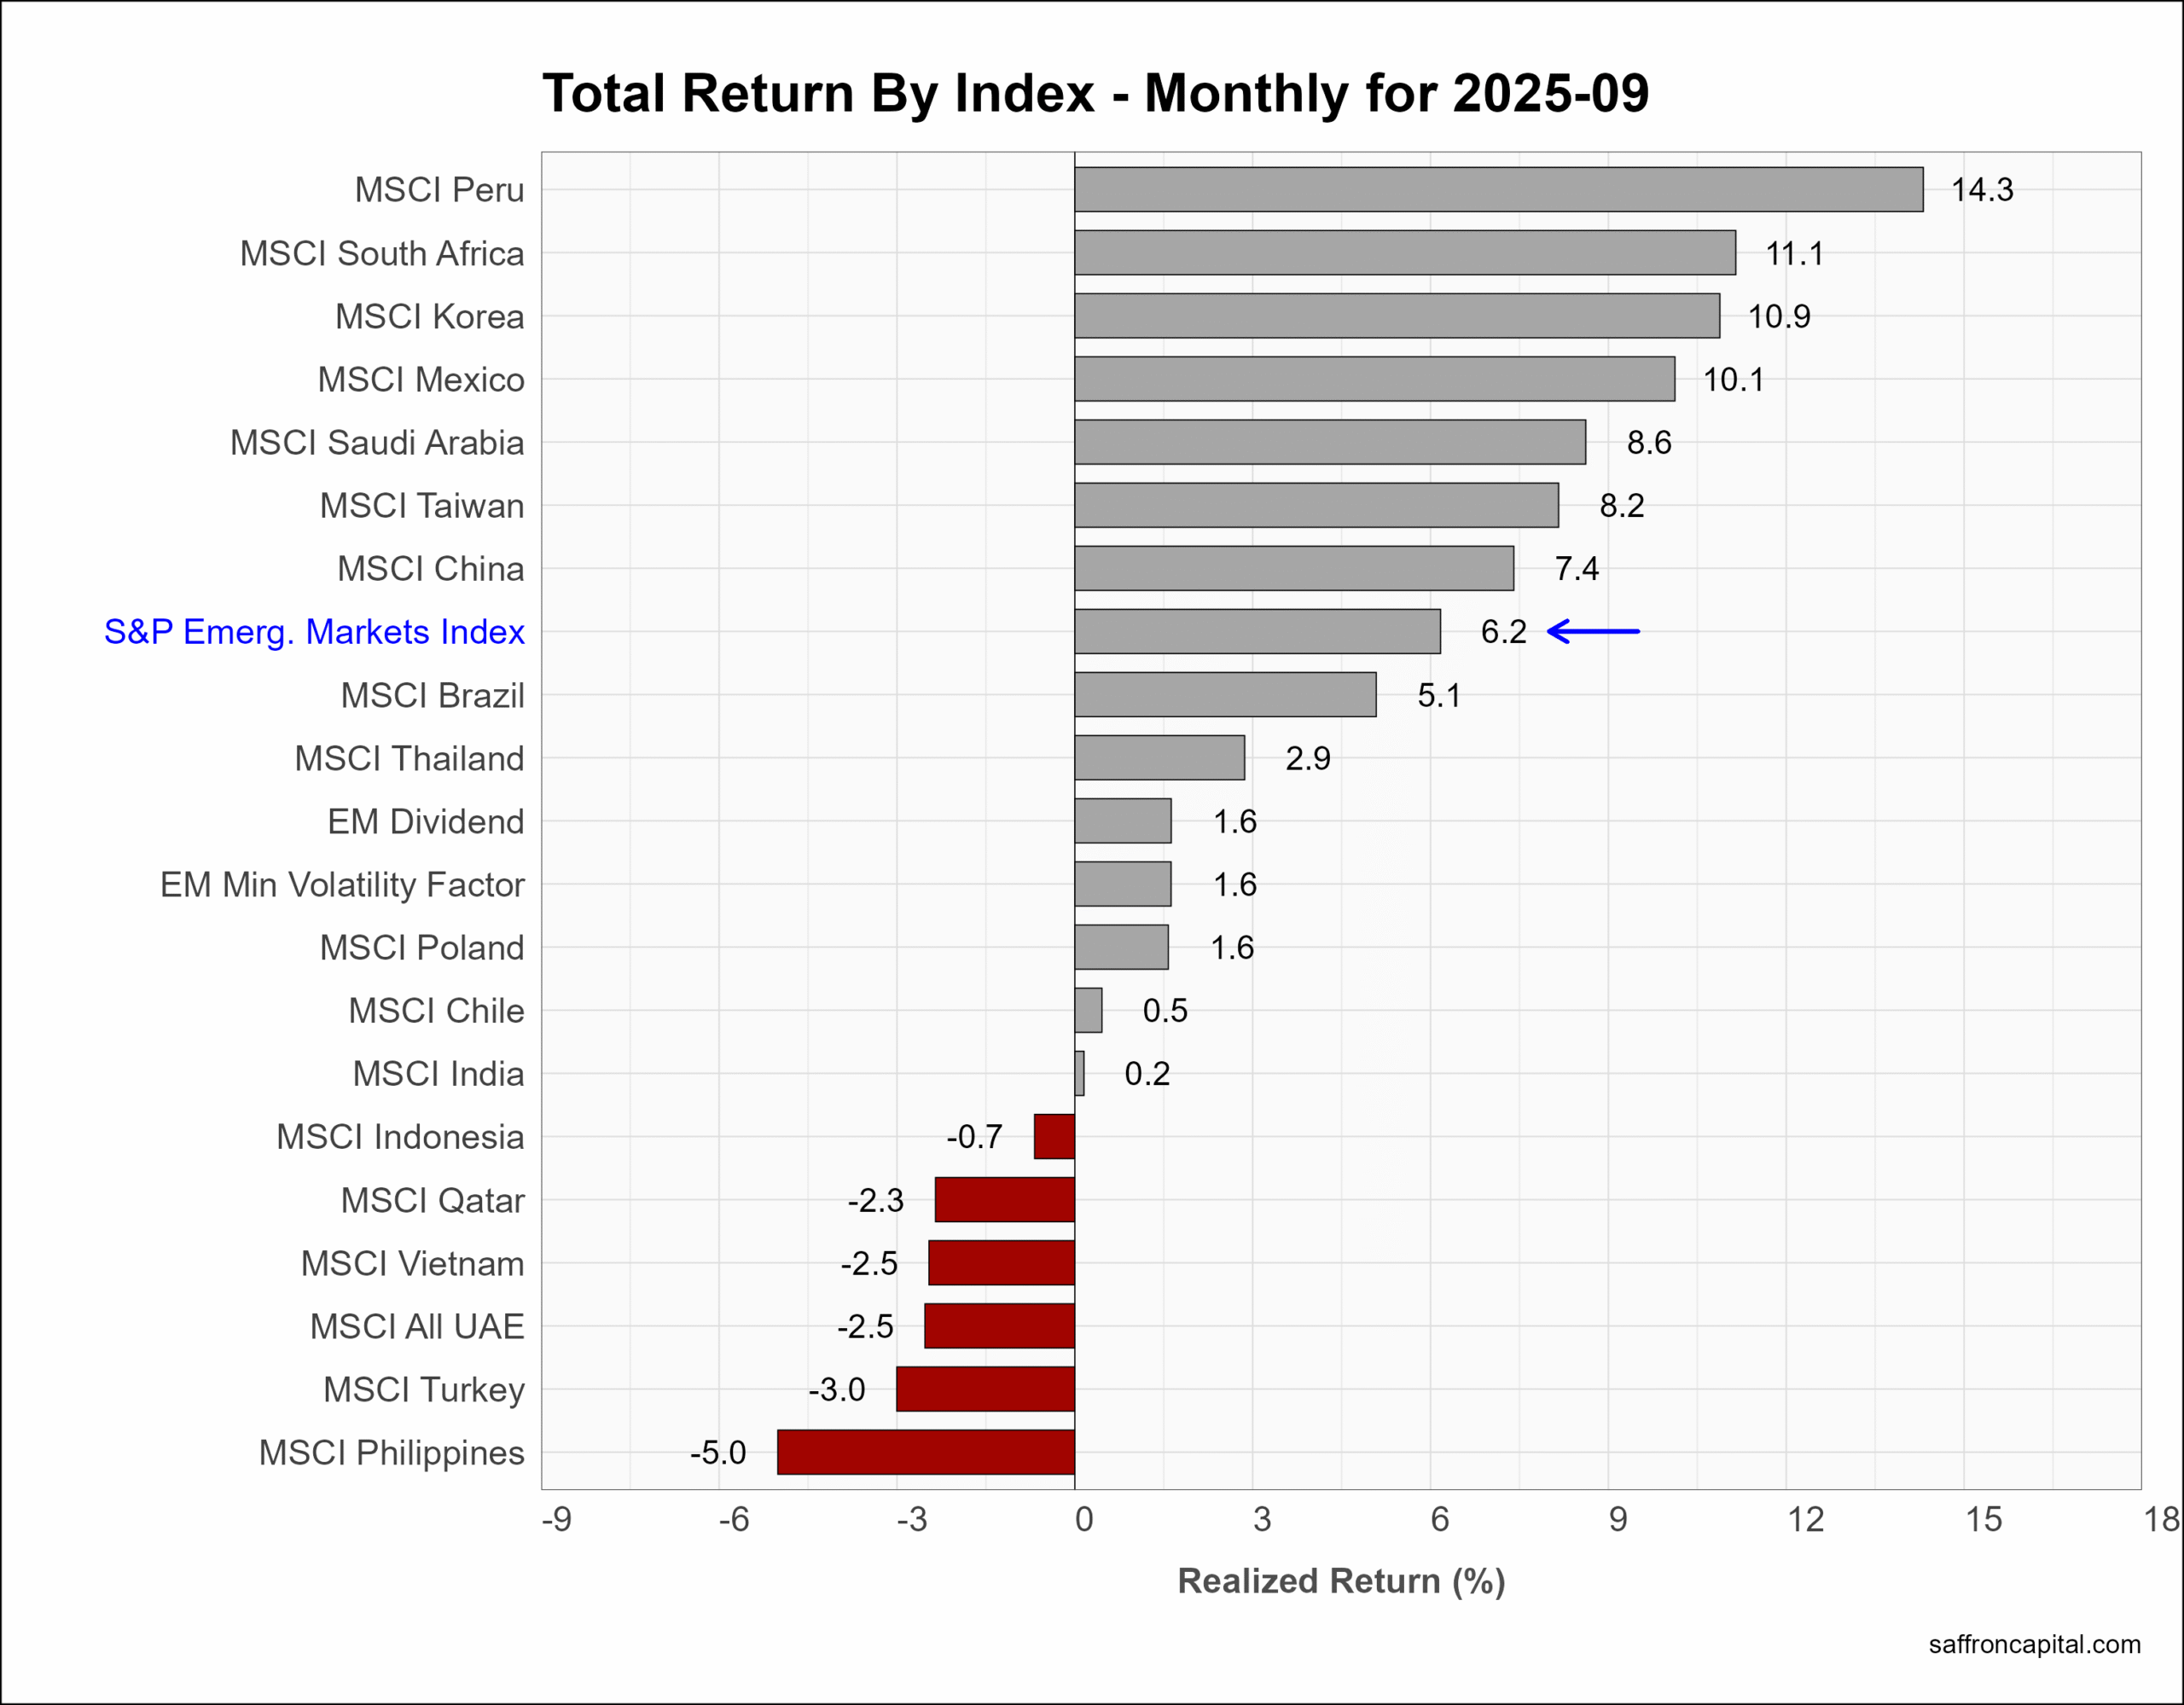
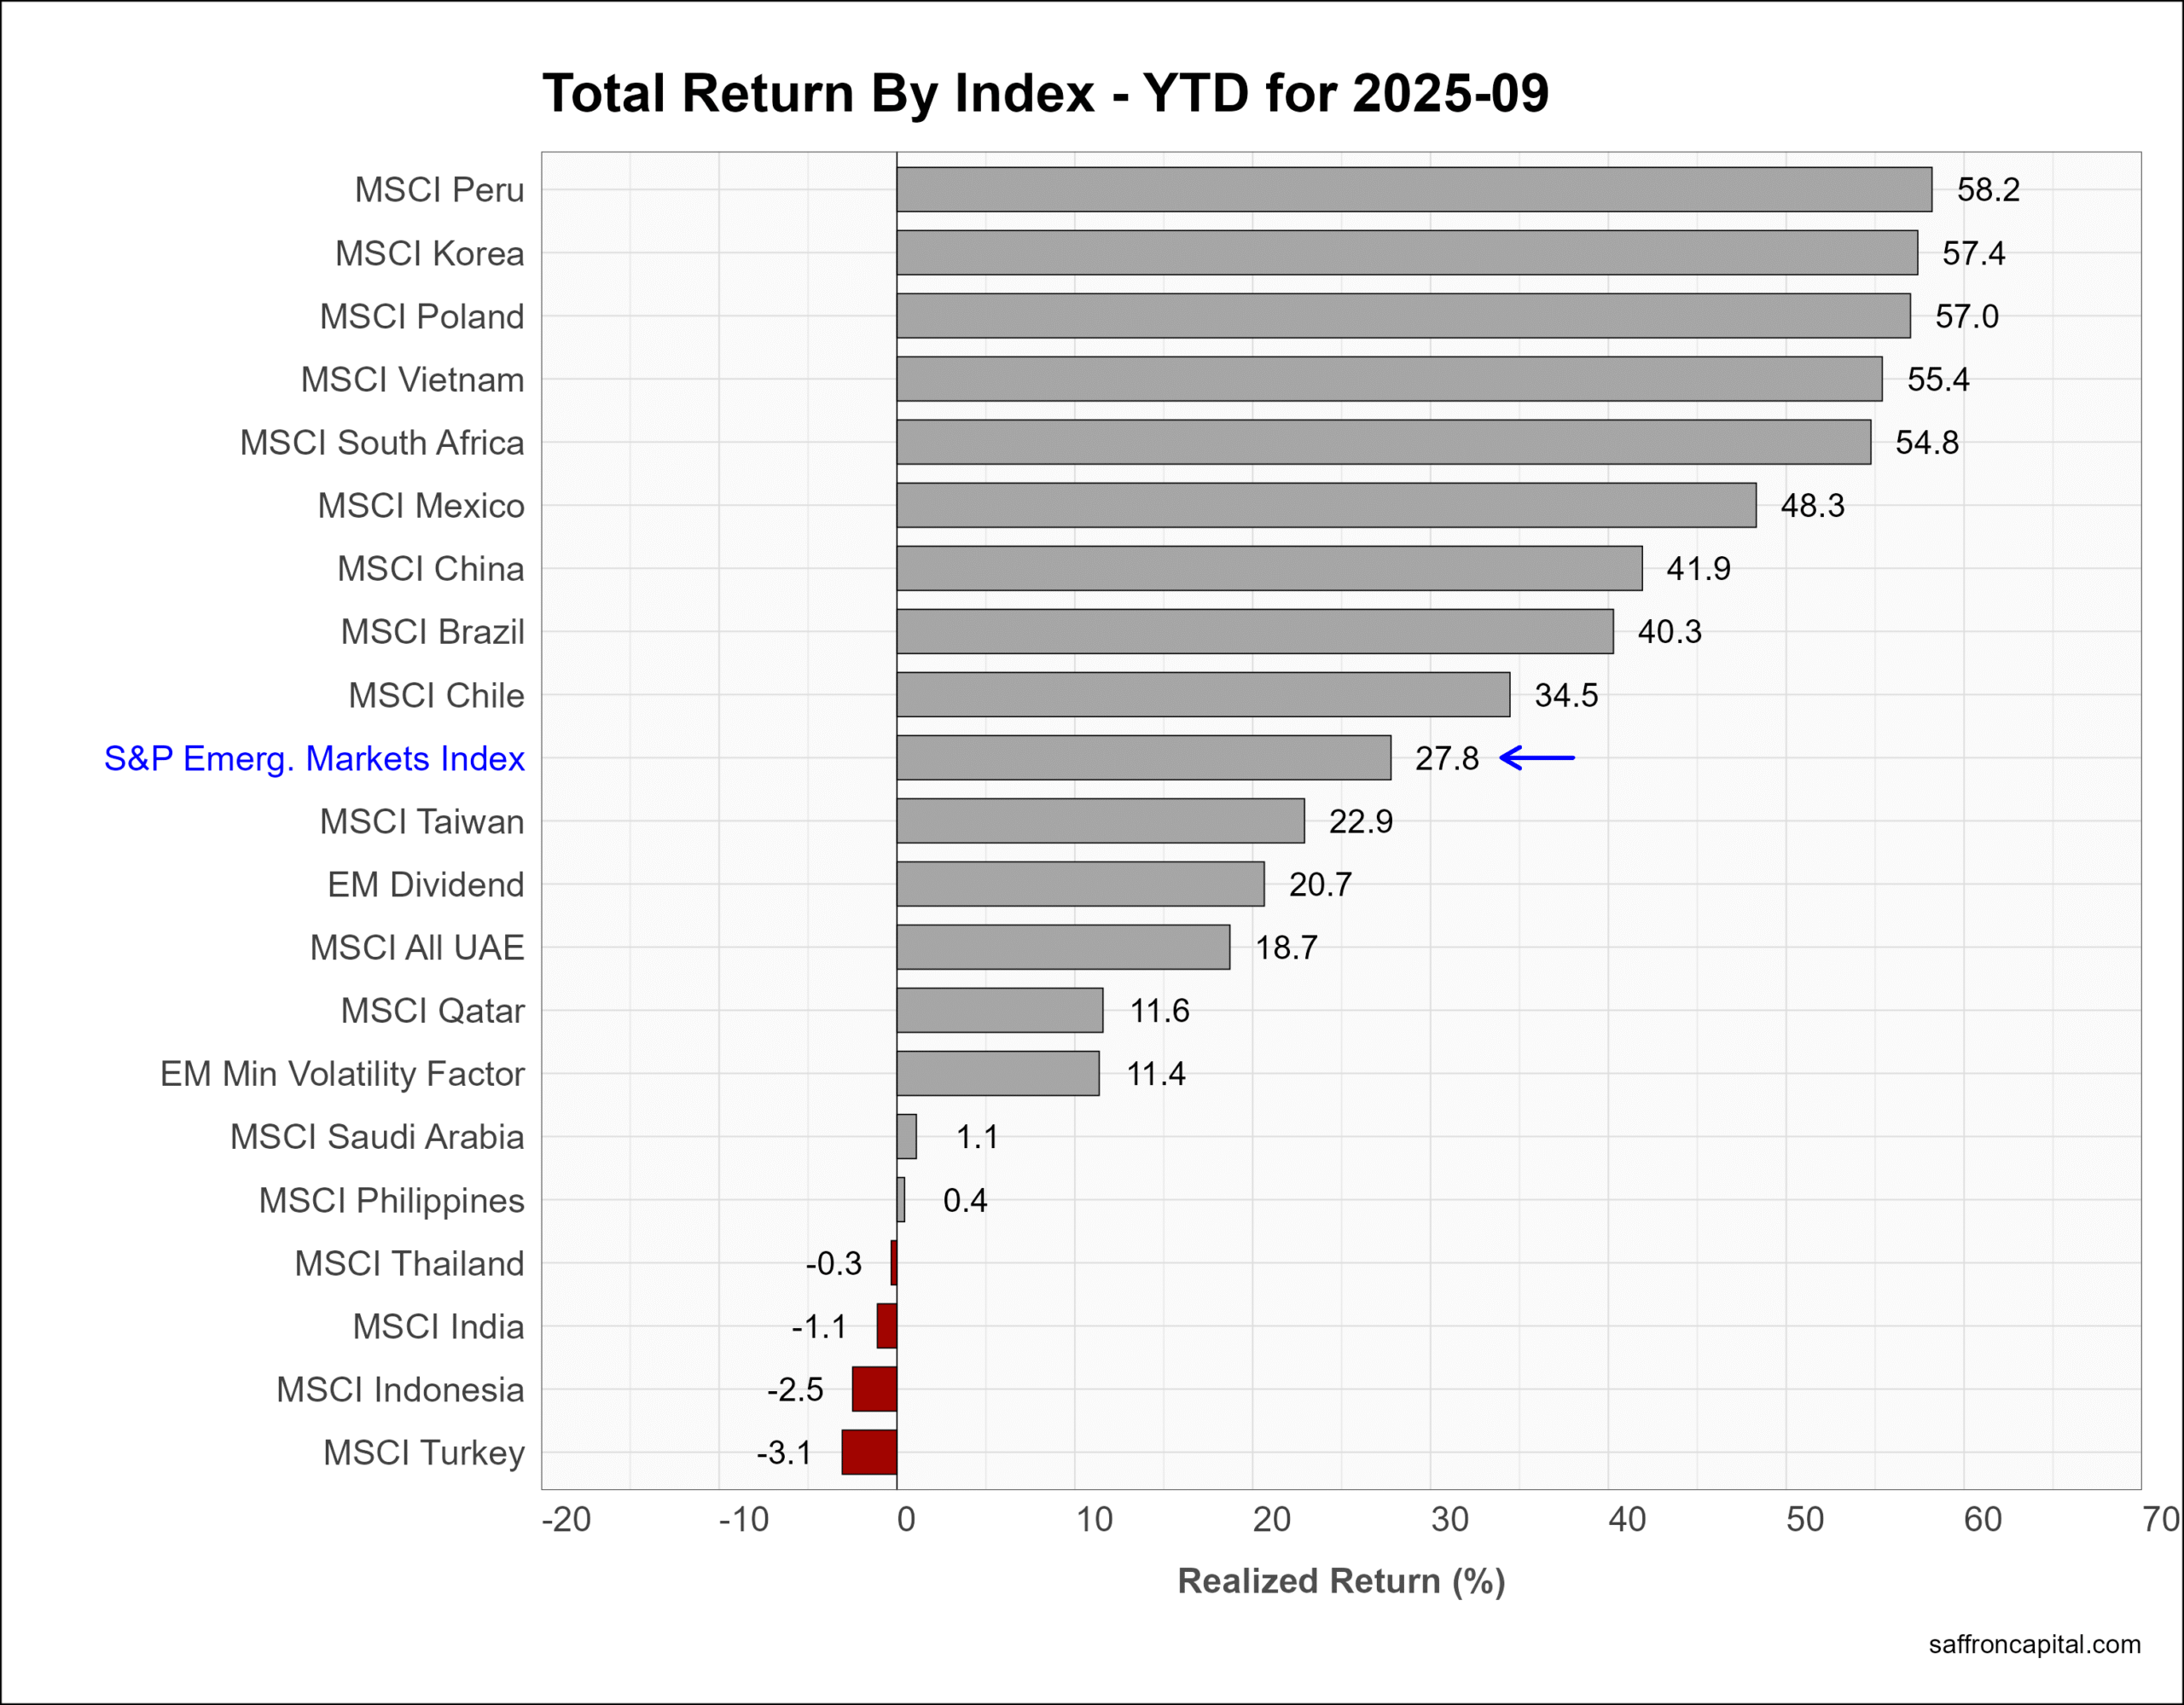
Emerging Market Equities
The S&P Emerging Markets Index (+6.2%) beat the S&P 500 index in September. Returns were led by Peru (+14.3%) with an export mix based on gold, copper, and other minerals. South Africa (+11.1%) also benefited for favorable terms of trade and the surge in metals prices. Finally. Korea (+10.9%) benefited from tech strength in semiconductors and high-yielding financial shares. Year-to-date, top markets include (Peru (+58.2%), Korea (+57.4%), and Poland (+57.0%).
Click to enlarge
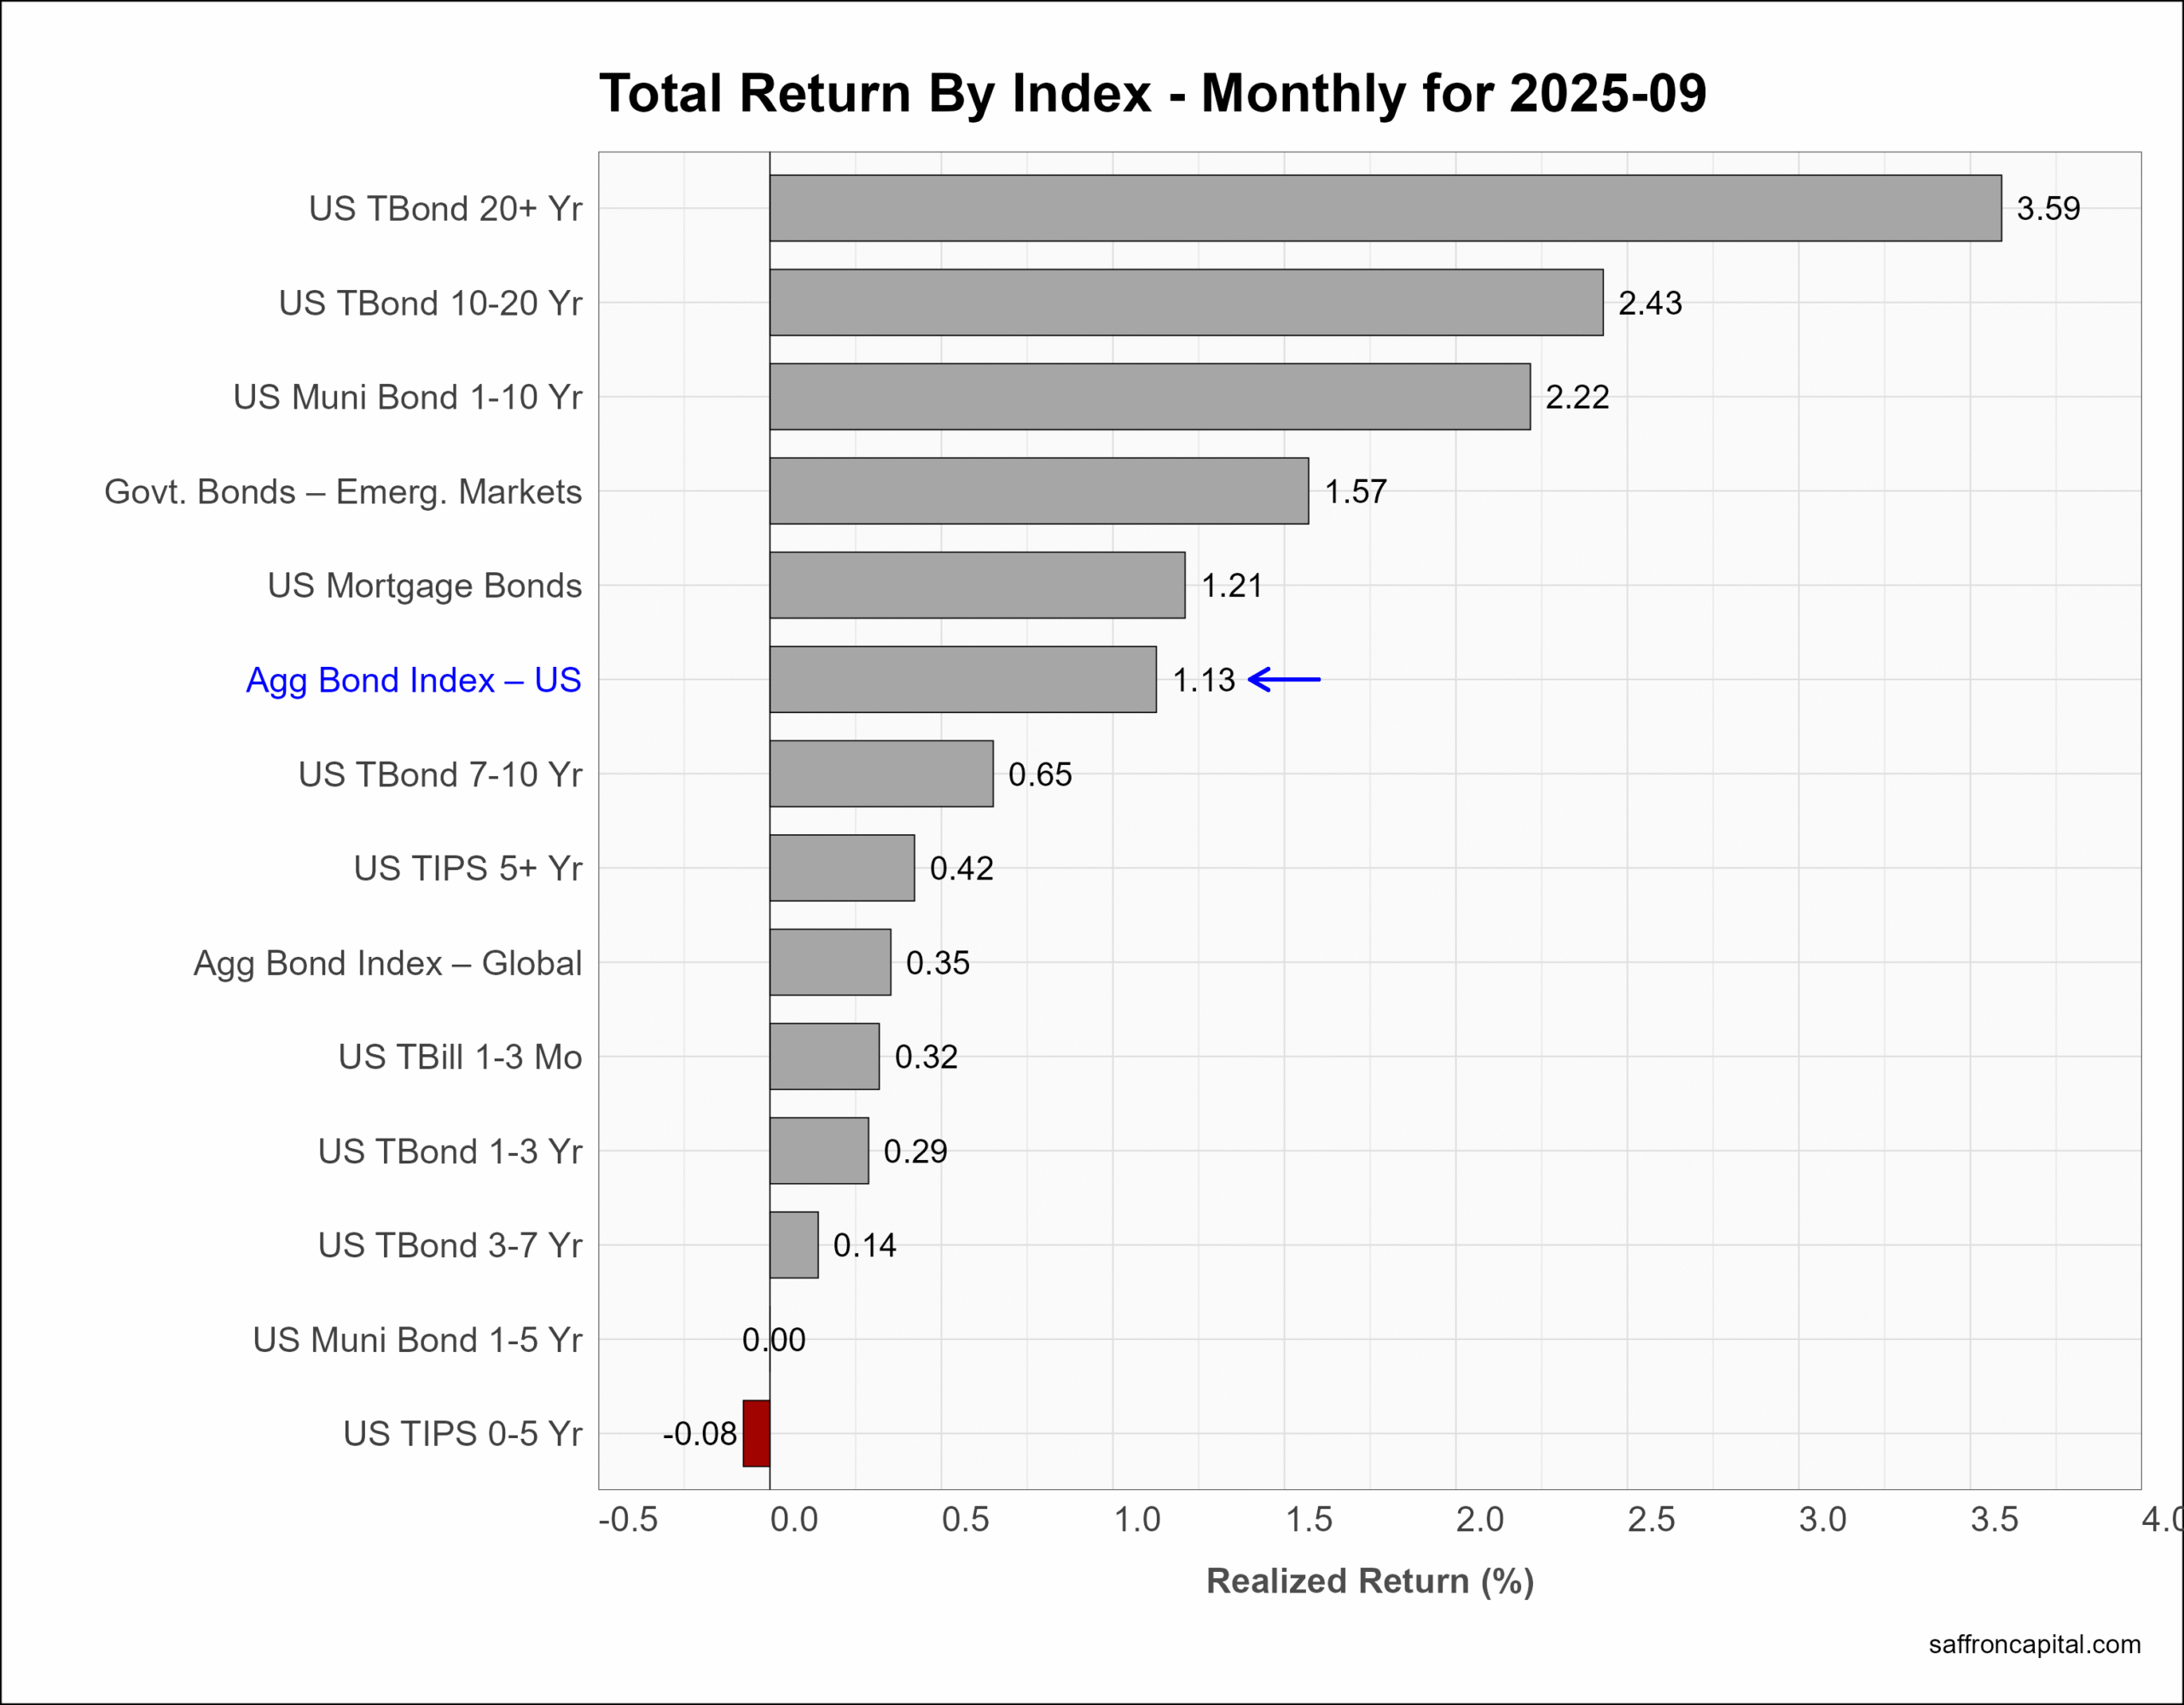
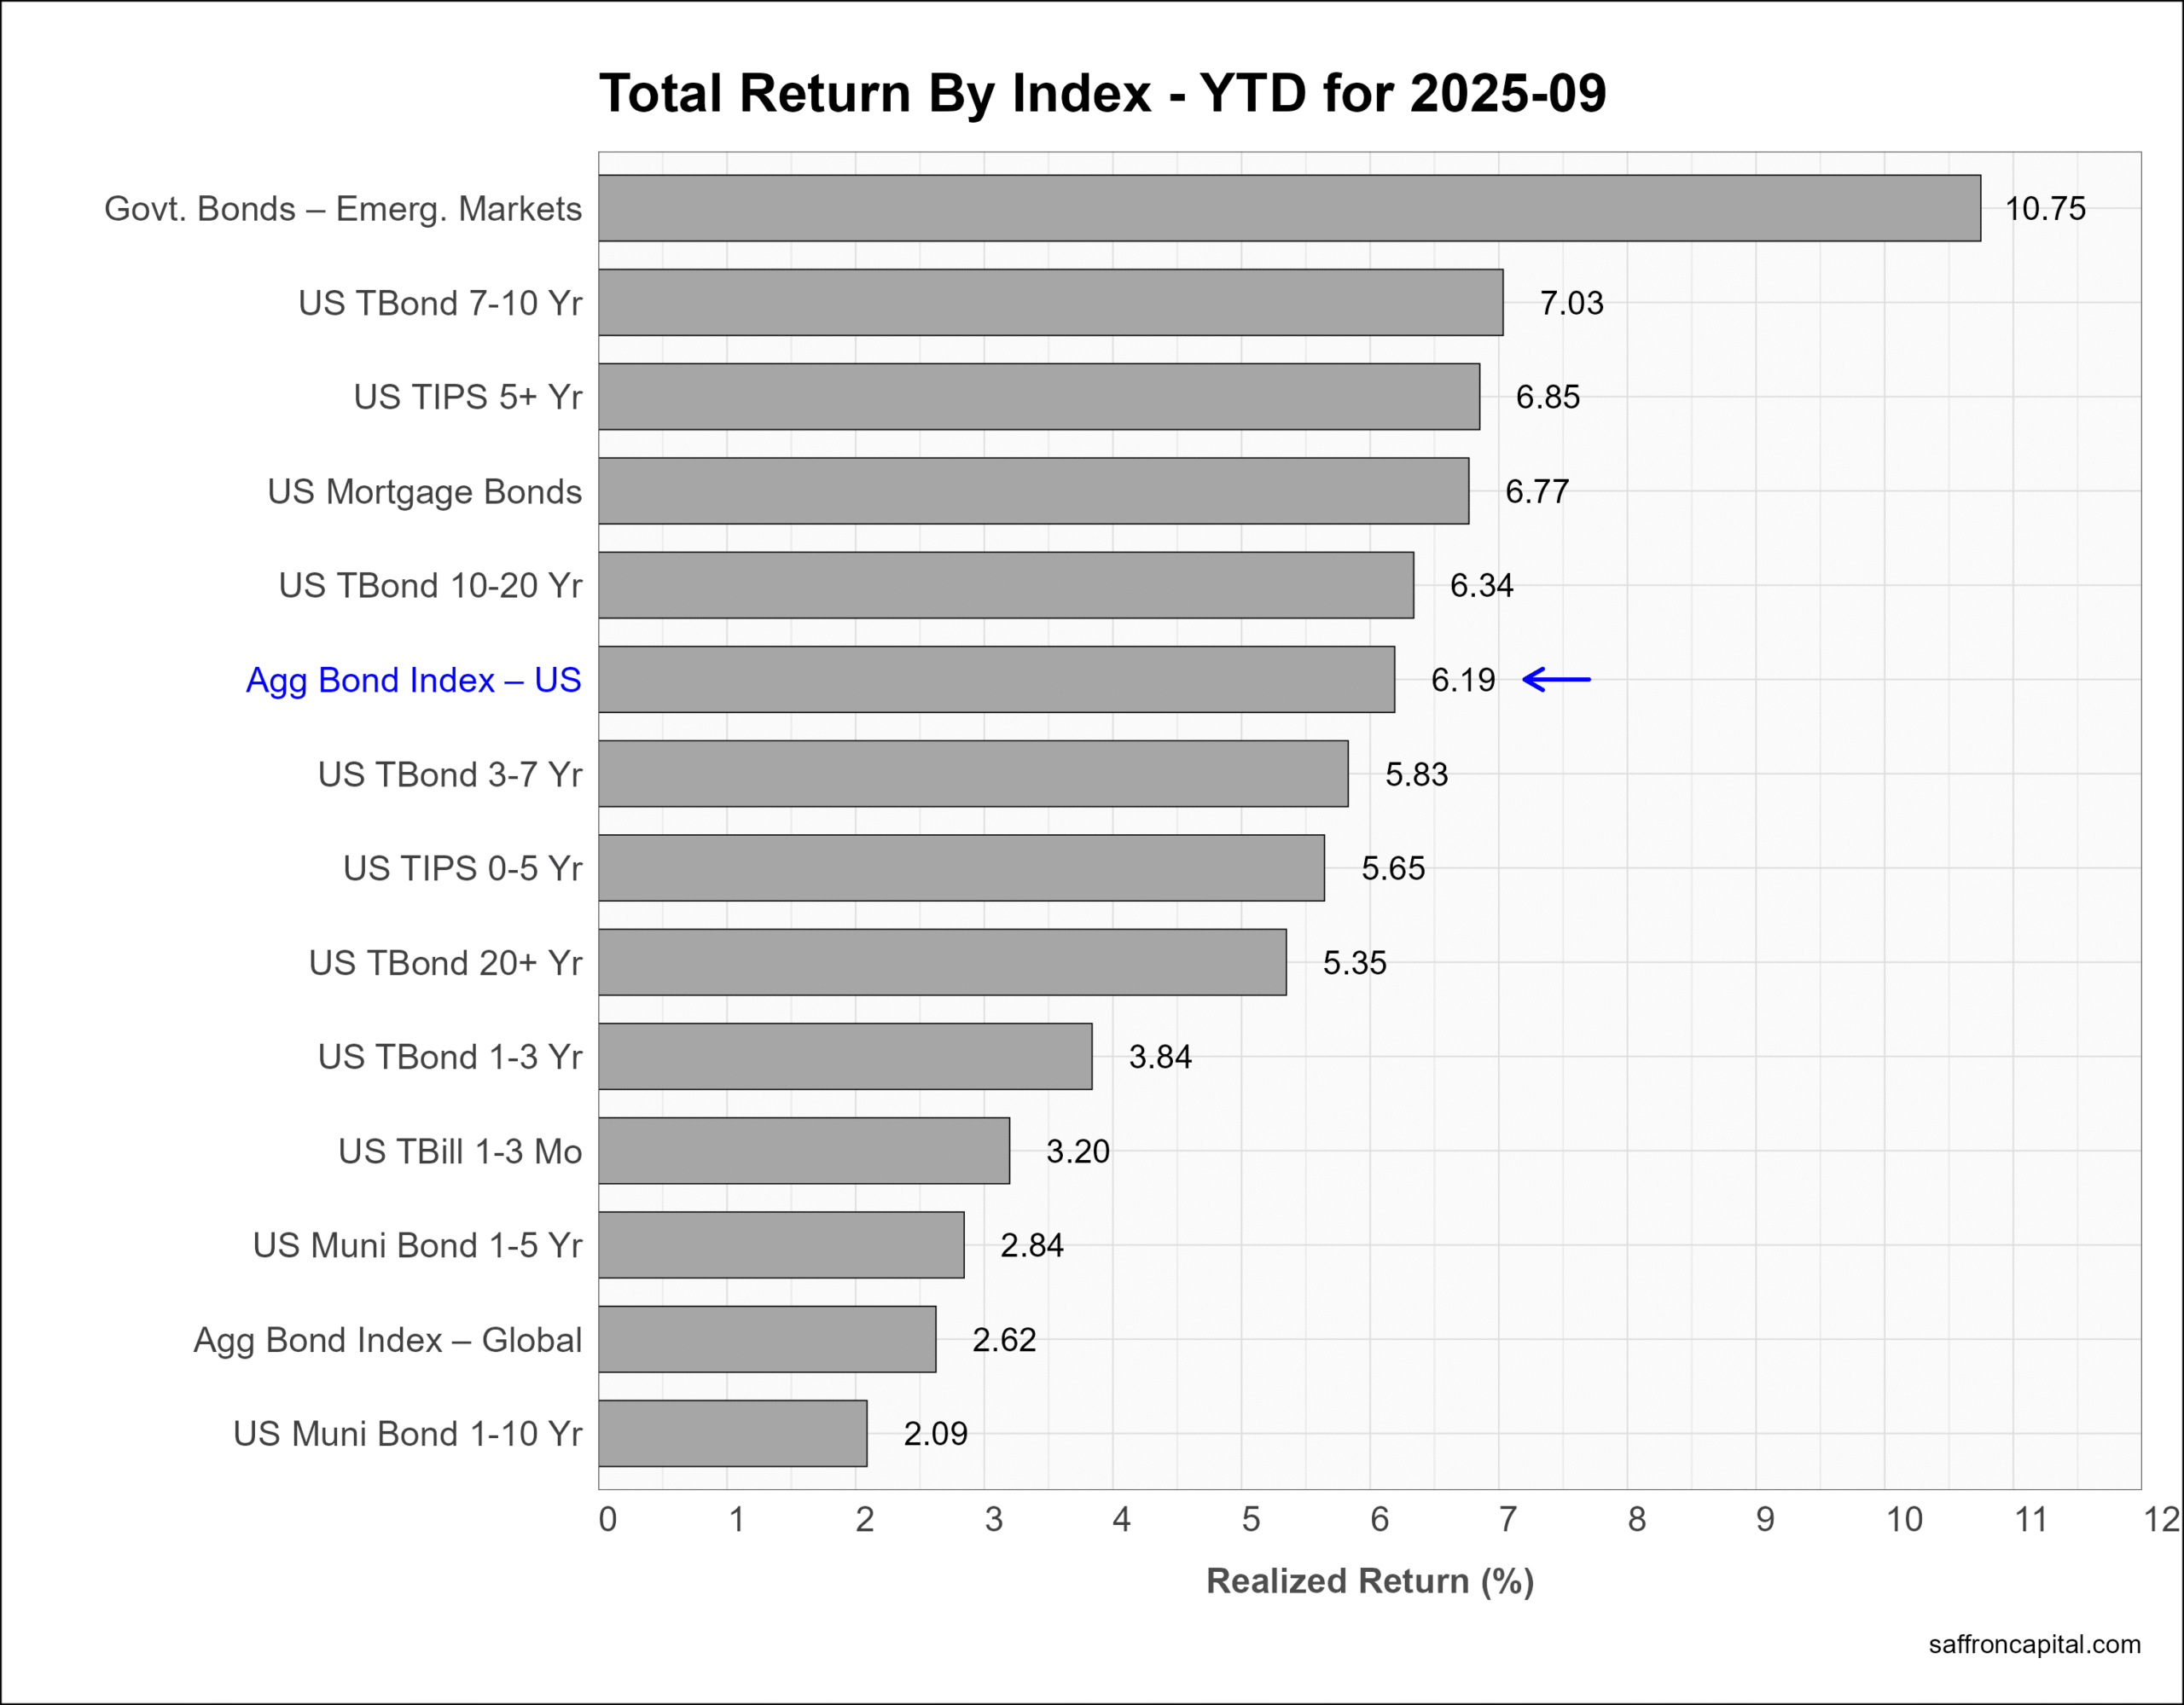
Government Bonds
During September, the yield on the 10-year Treasury Note ranged between 4.31% and 4.00%, before settling near the lows at 4.1%. As a result, the US Aggregate Bond Index (+1.13%) saw gains in September. Long duration bonds (+3.5%). Year-to-date, the US Aggregate Bond Index (+6.19%) is lagging behind Emerging Market Government Bods (+10.75%), 7- to 10-year Treasuries (+7.03%), and TIPS (+6.86%).
Click to enlarge
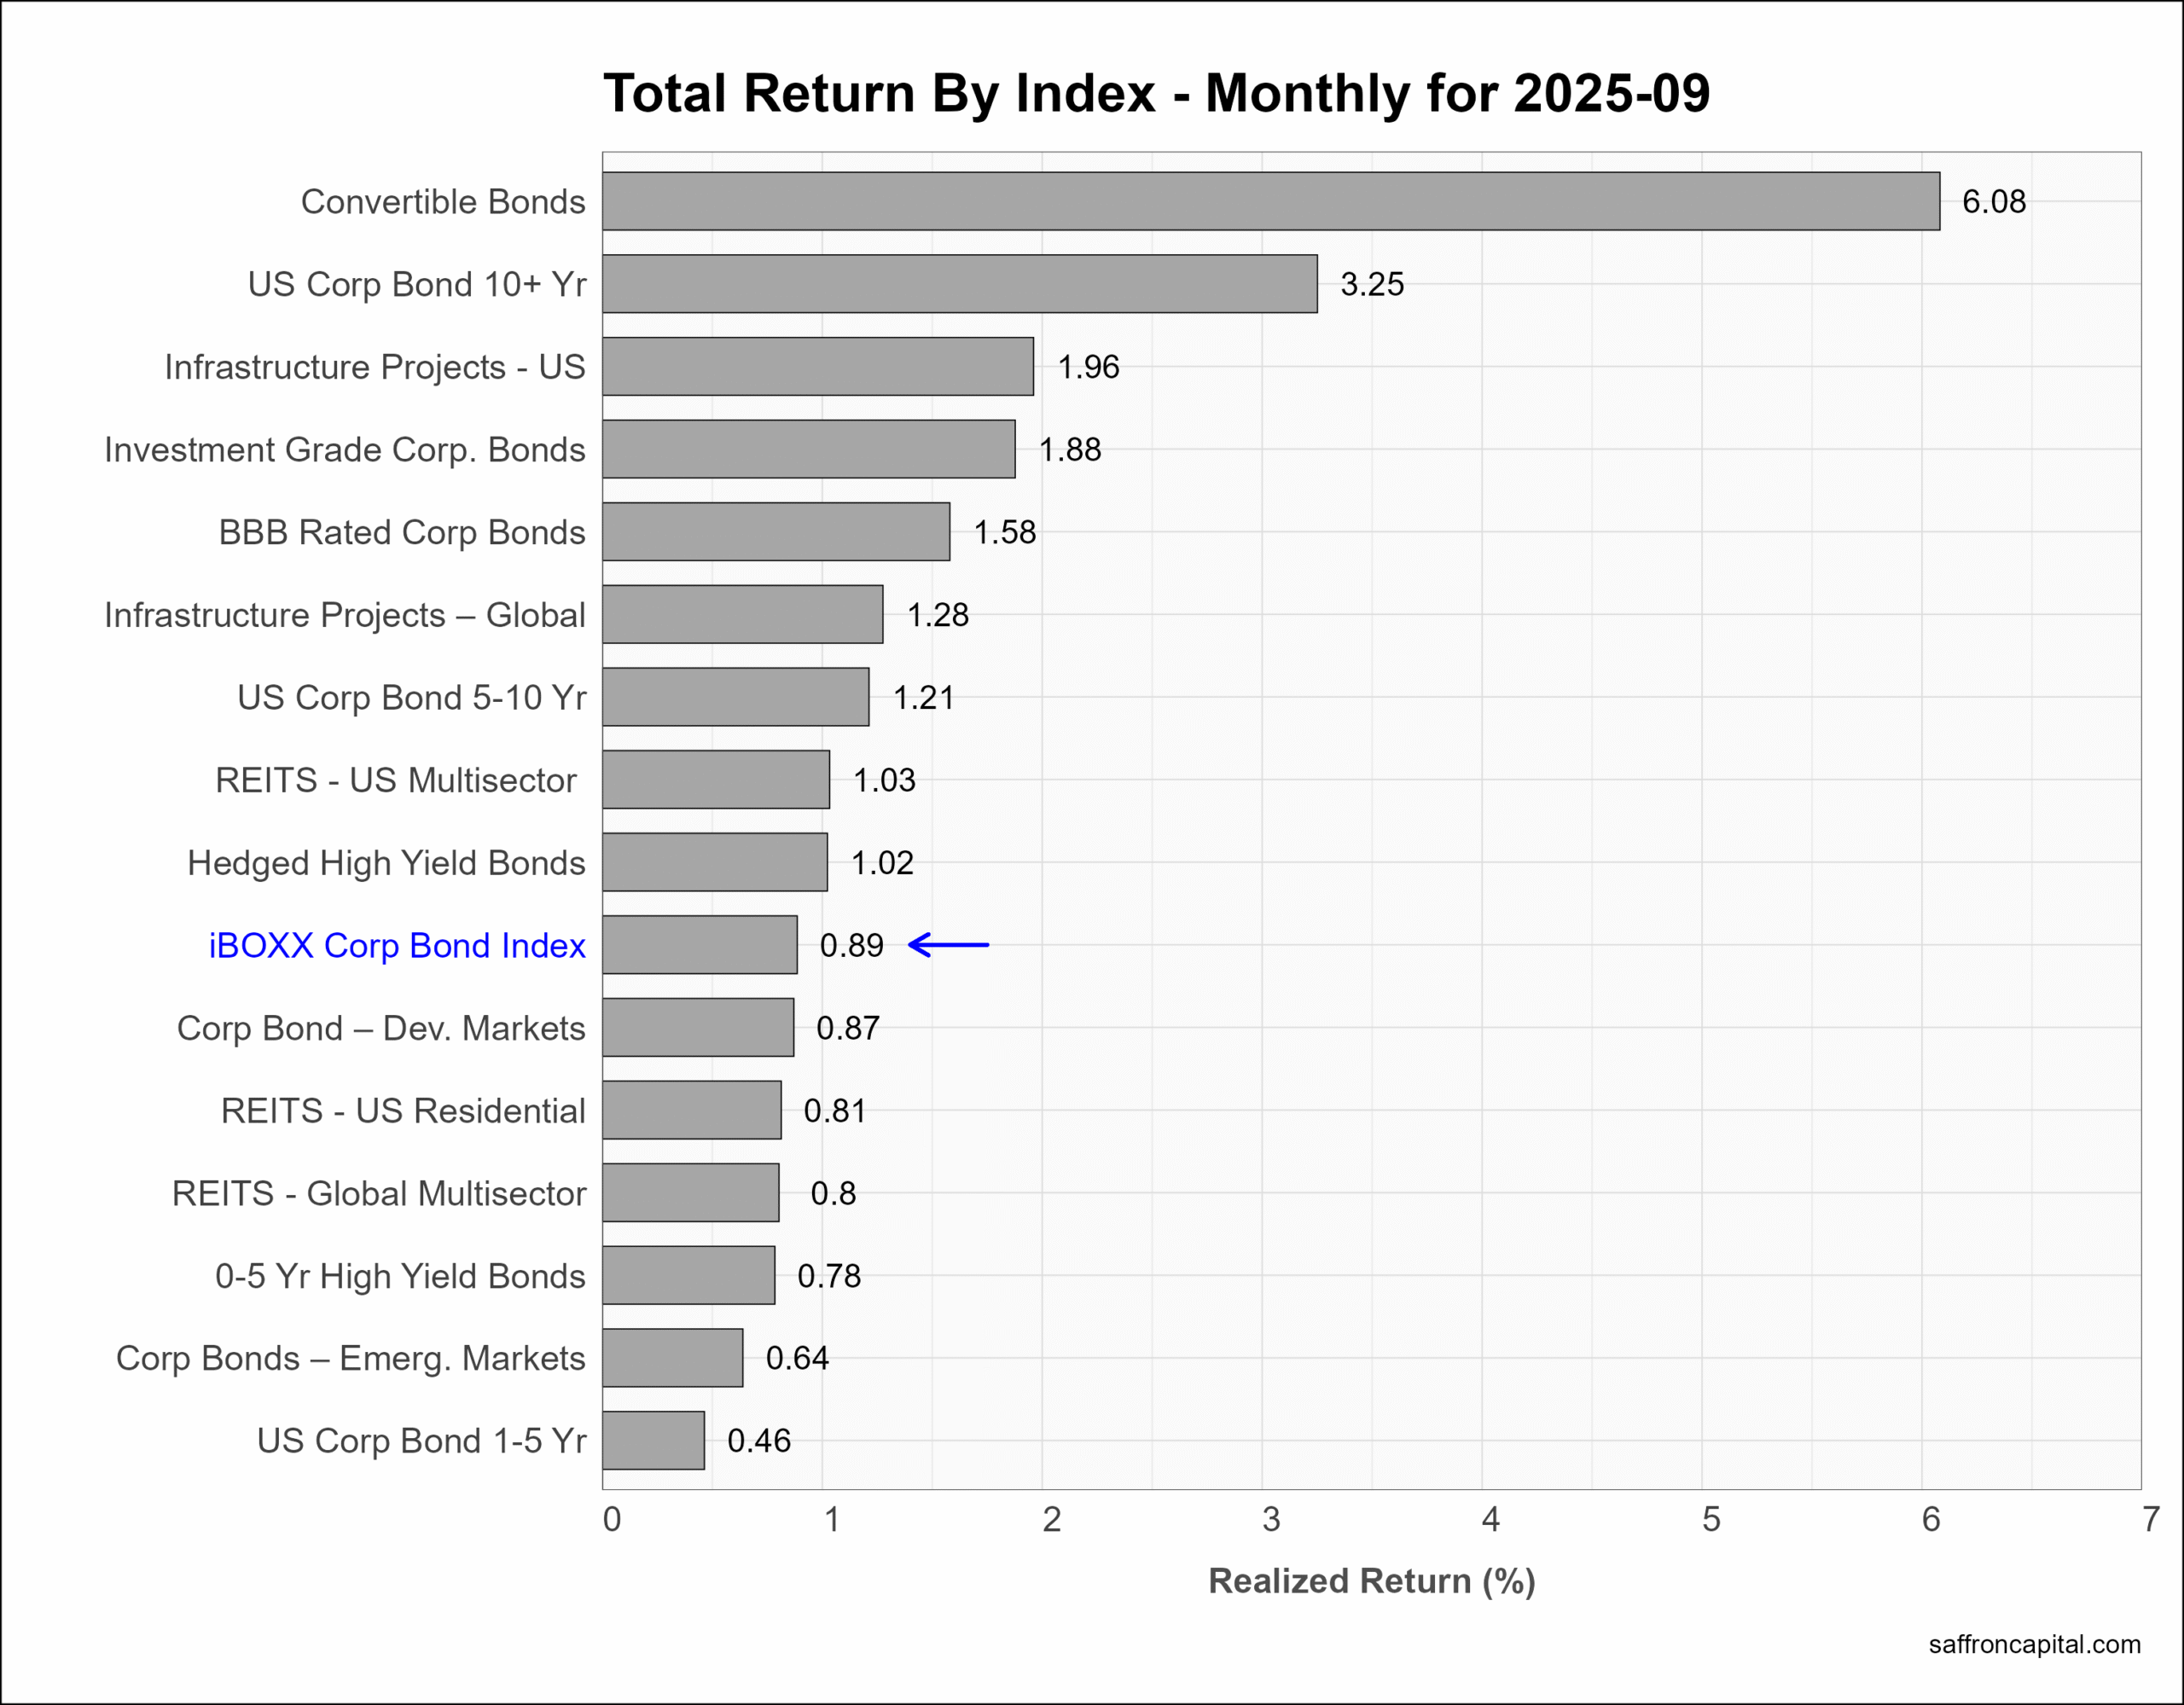
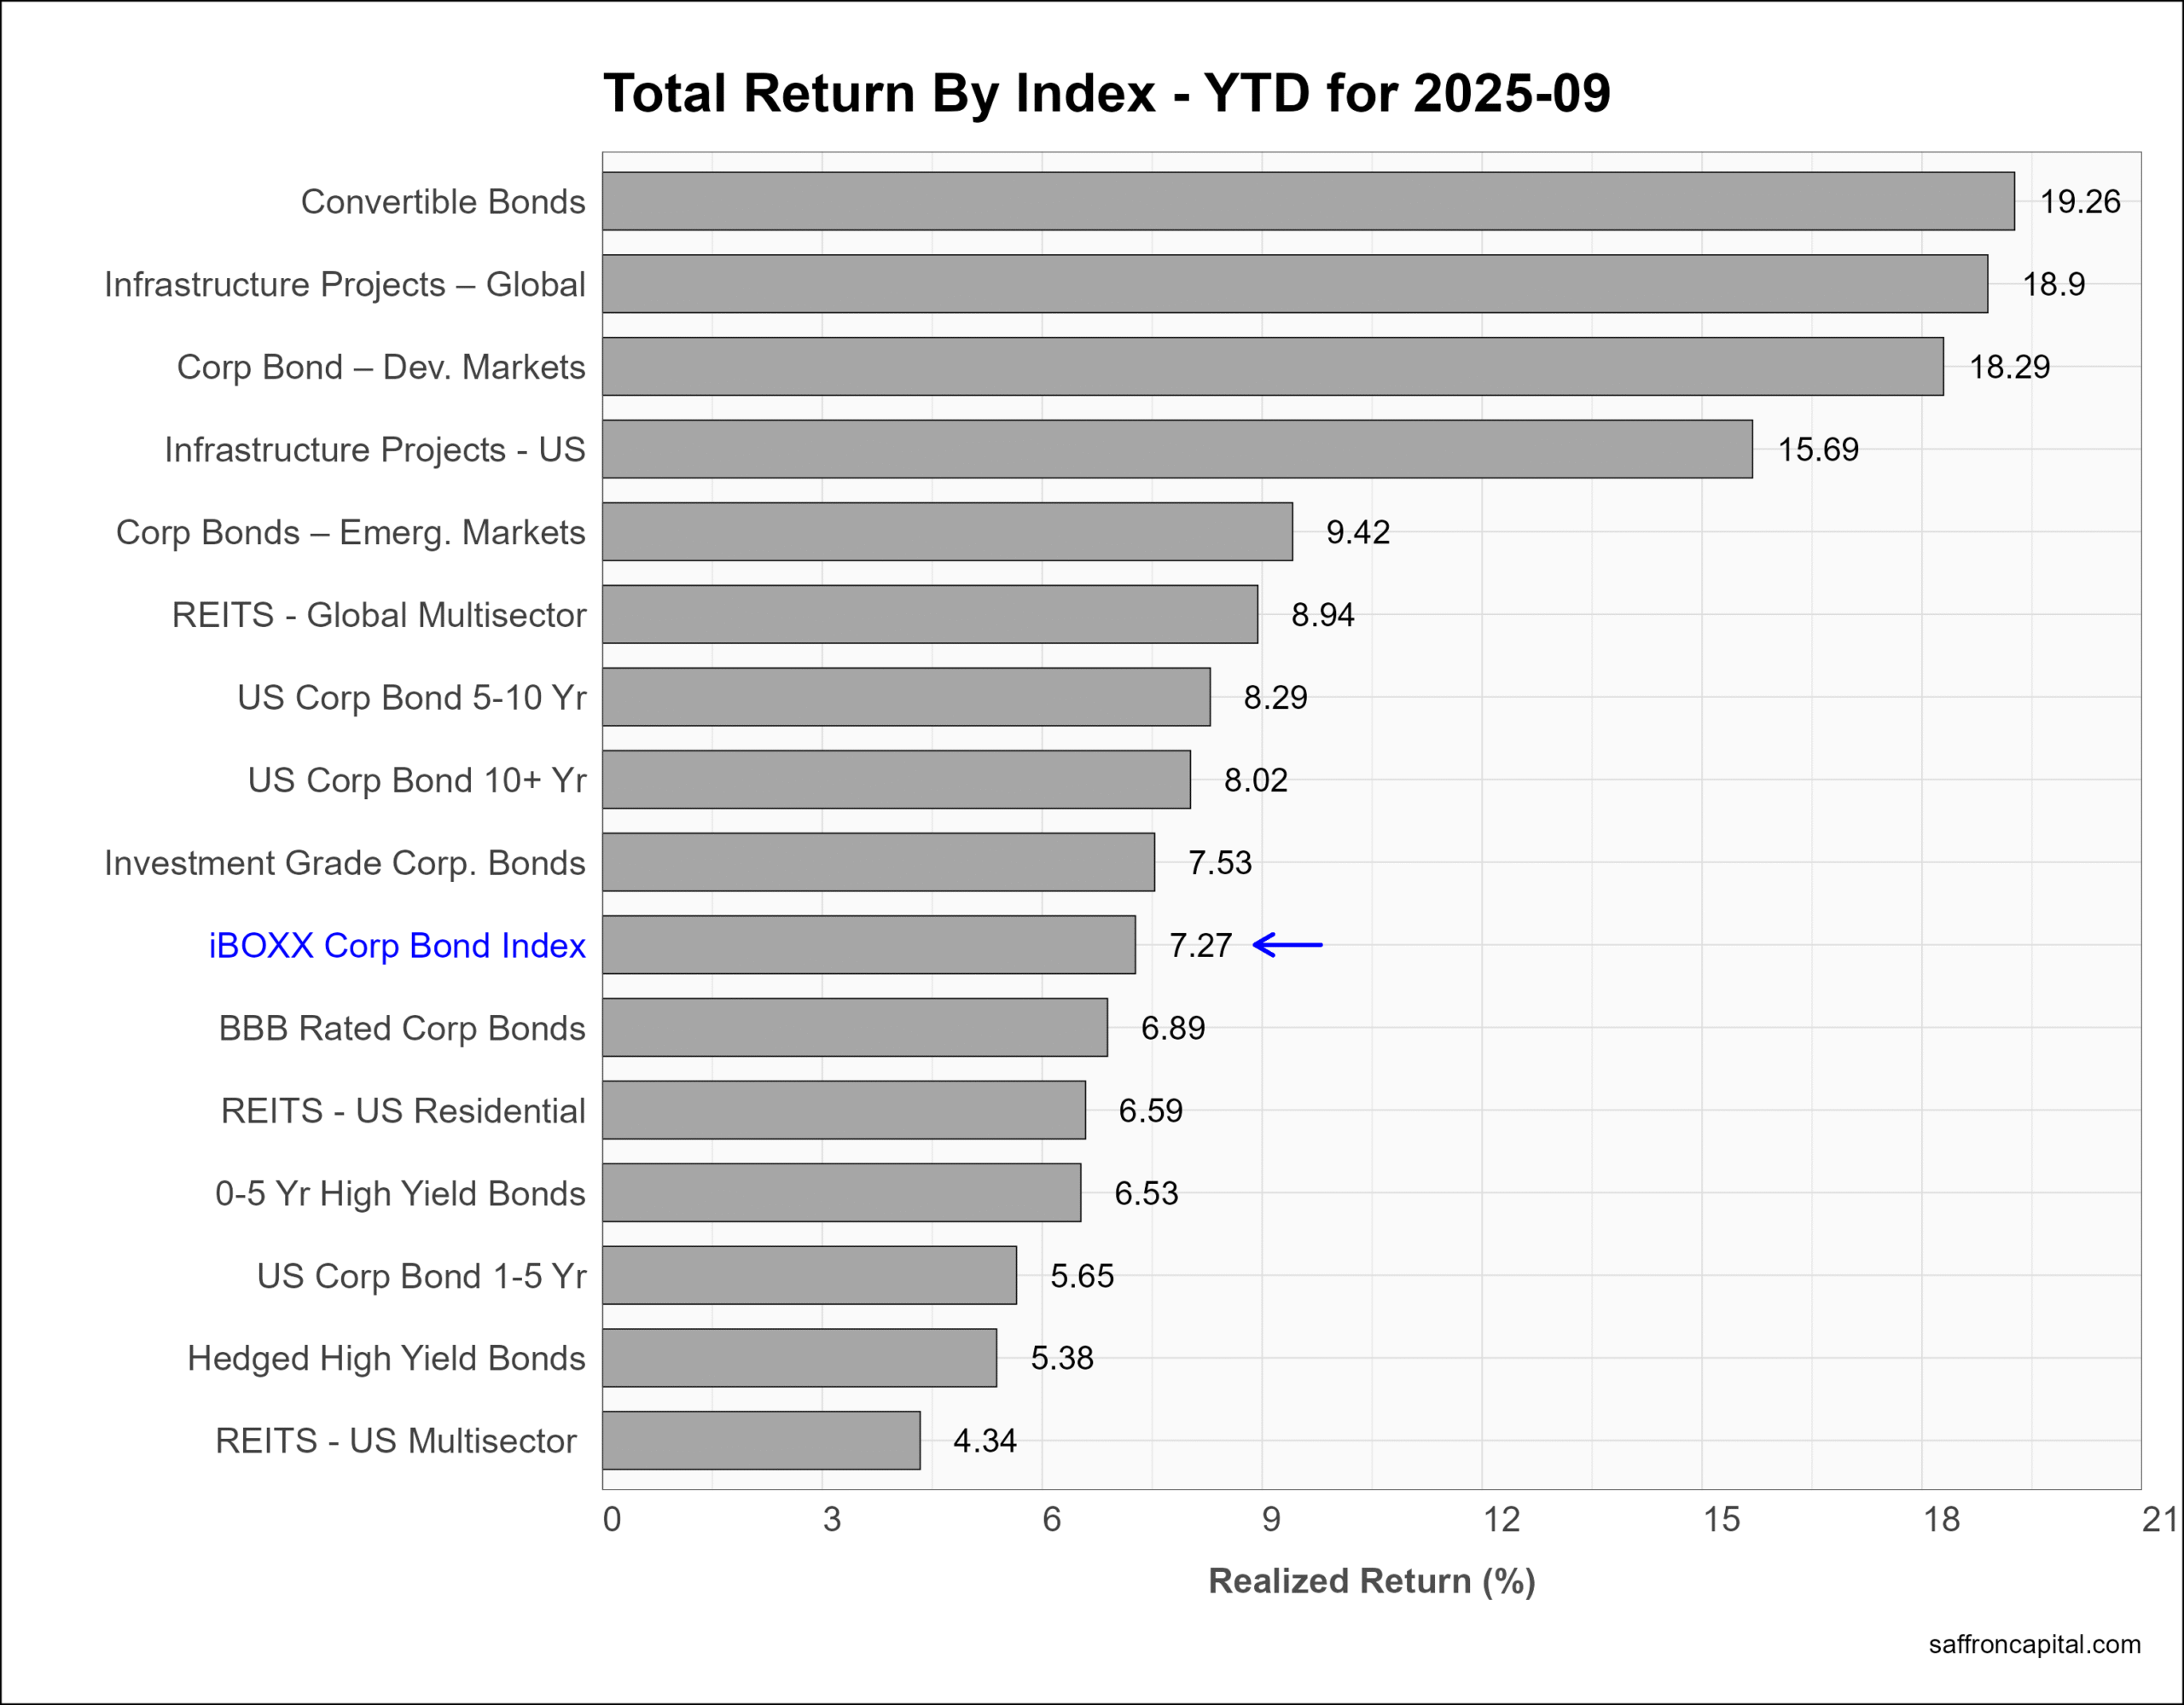
Corporate & Infrastructure Bonds
The benchmark iBoxx Corporate Bond Index (+0.89%) had modest returns in September when compared to Convertible Bonds (+6.06%), long duration IG Bonds (3.25%), and US Infrastructure projects (+1.56%). The top performing returns since January include Convertible Bonds (+19.26%), Global Infrastructure Projects (+18.90%), and international Developed market IG bonds (+18.29%).
Click to enlarge
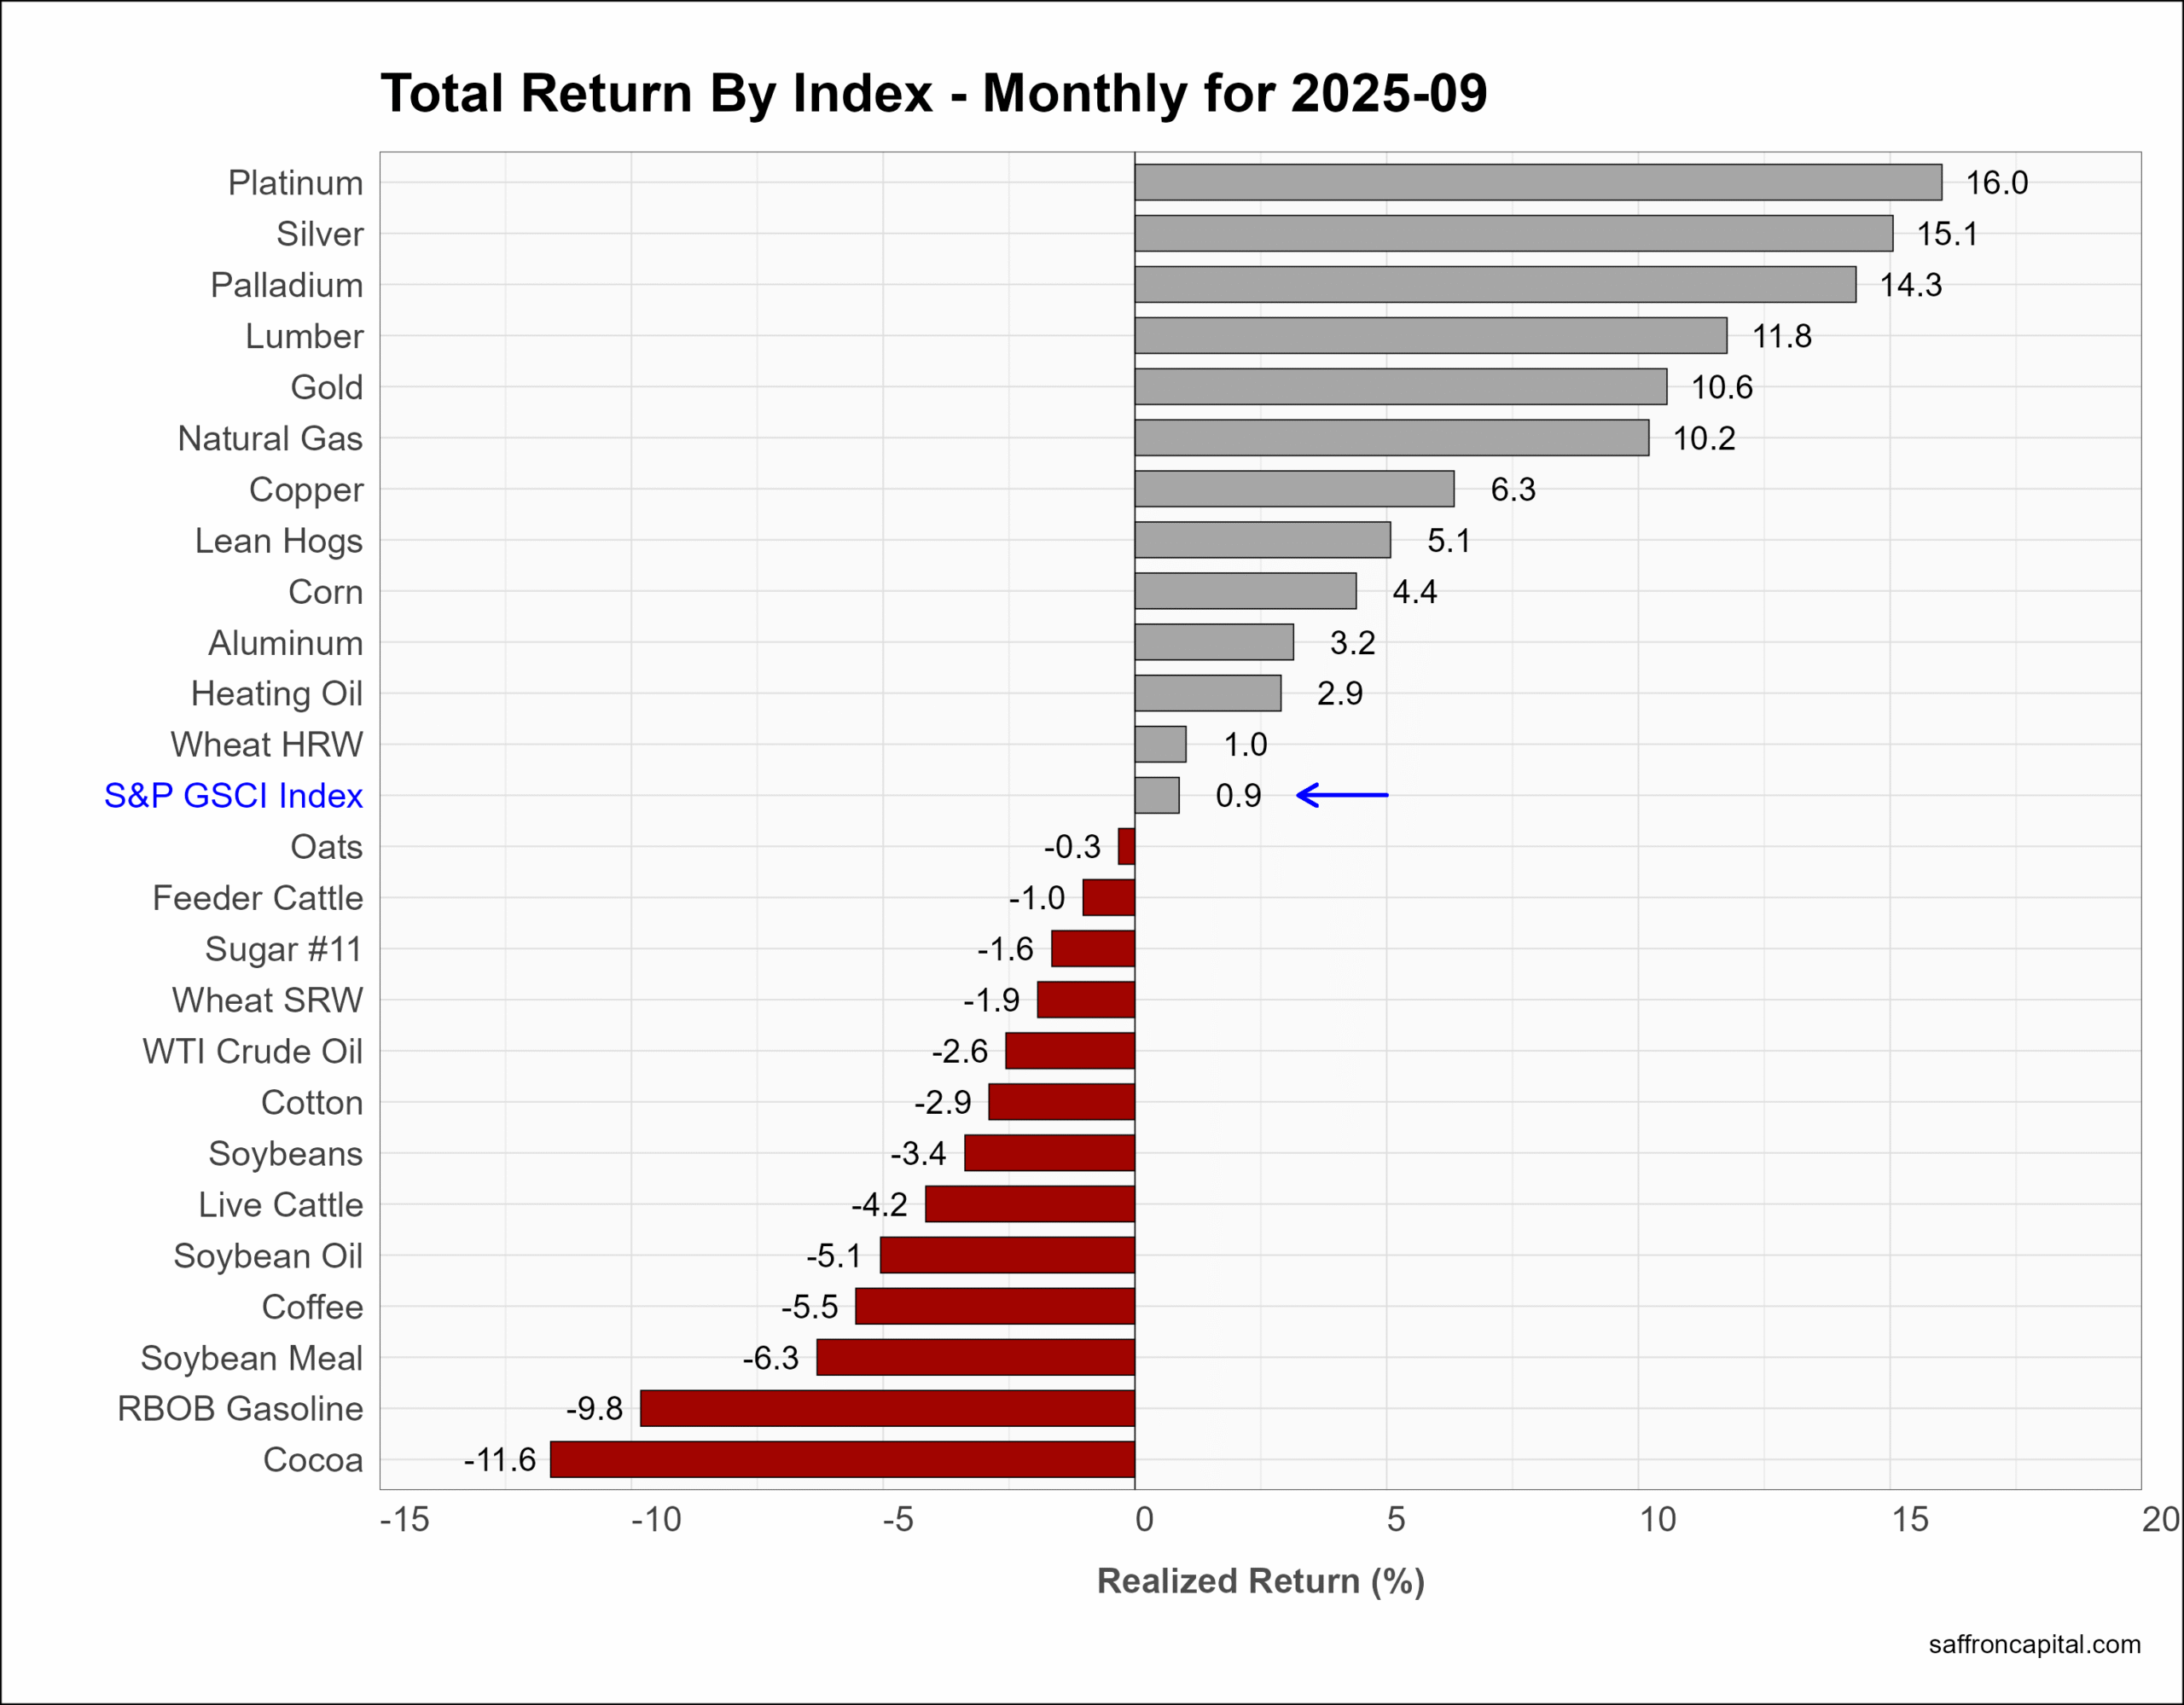
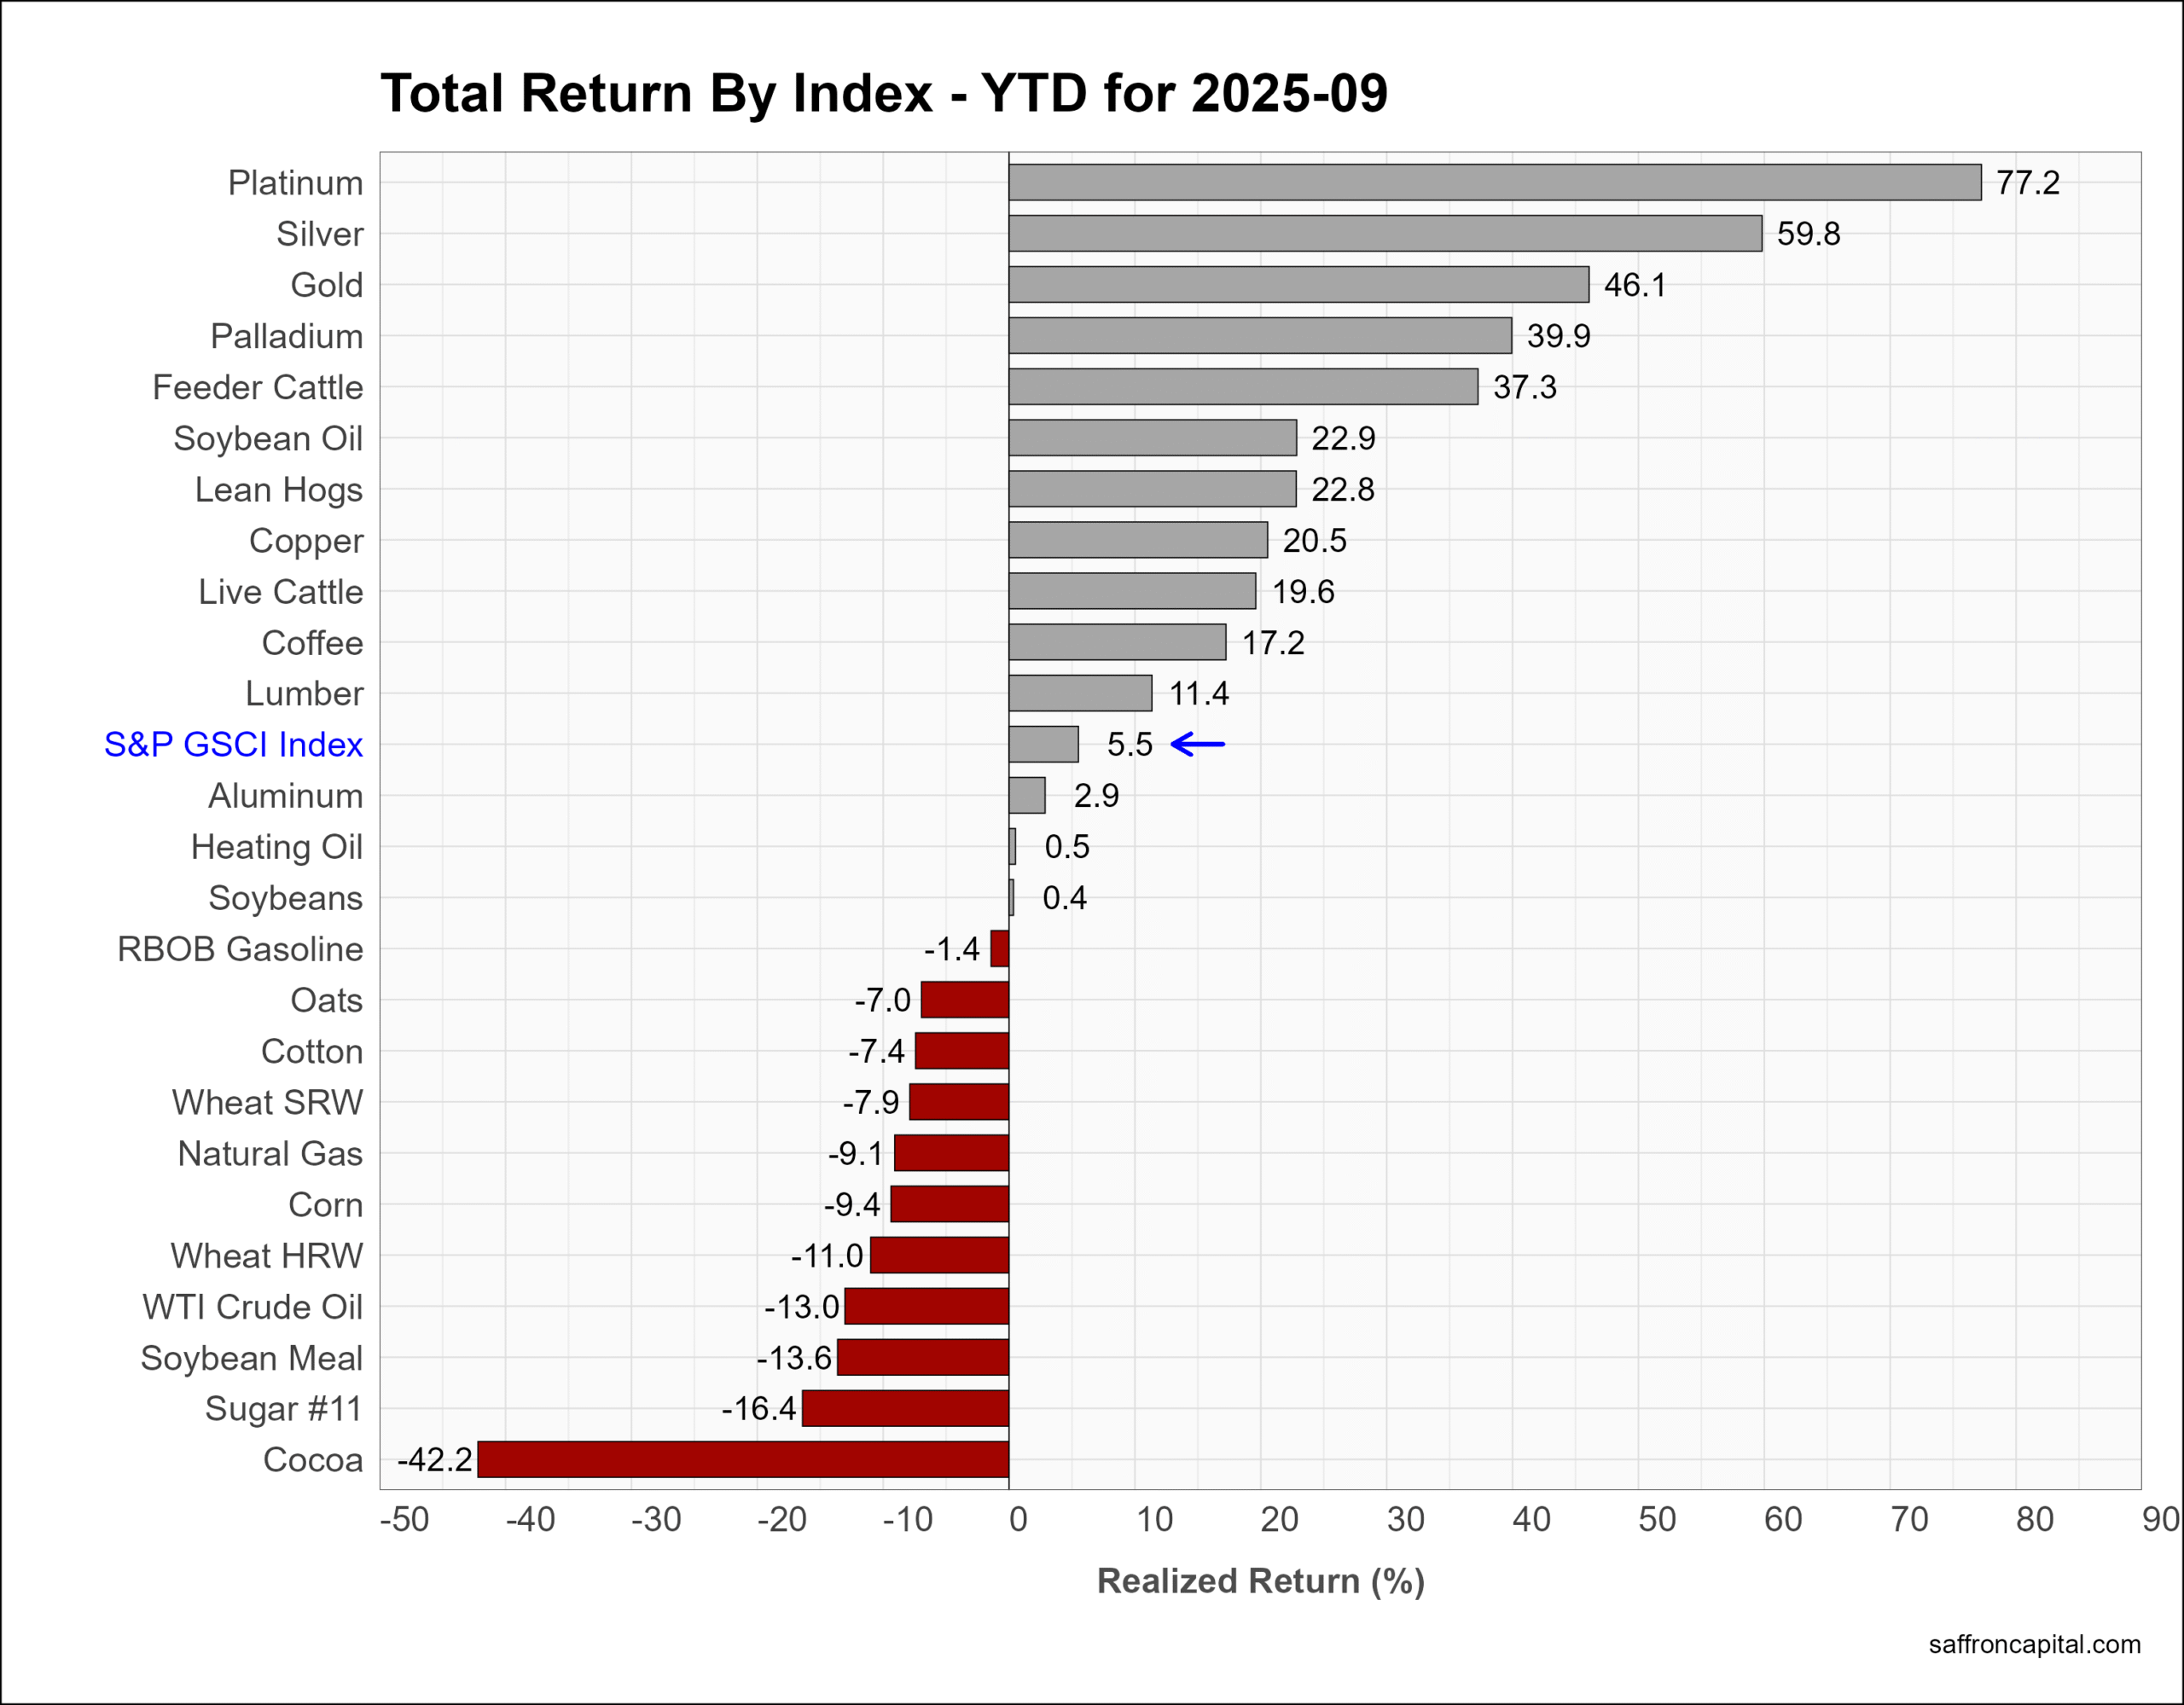
Commodities
Commodity returns, as measured by the S&P GS Commodity Index (+09%), were modest in September and masked a wide range of results. Platinum (+16.0%) topped the list, along with Silver (+15.1%) and Palladium (+14.3%). Laggards included Soy Meal (-6.3%), Gasoline (-9.8%), and Cocoa (-11.6%). For 2025, the commodity index (+5.5%) lags behind US stock and bond returns. However, top performers in the precious metals group include Platinum (+77.2%), Silver (+59.8%), and Gold (+46.1%).
Click to enlarge
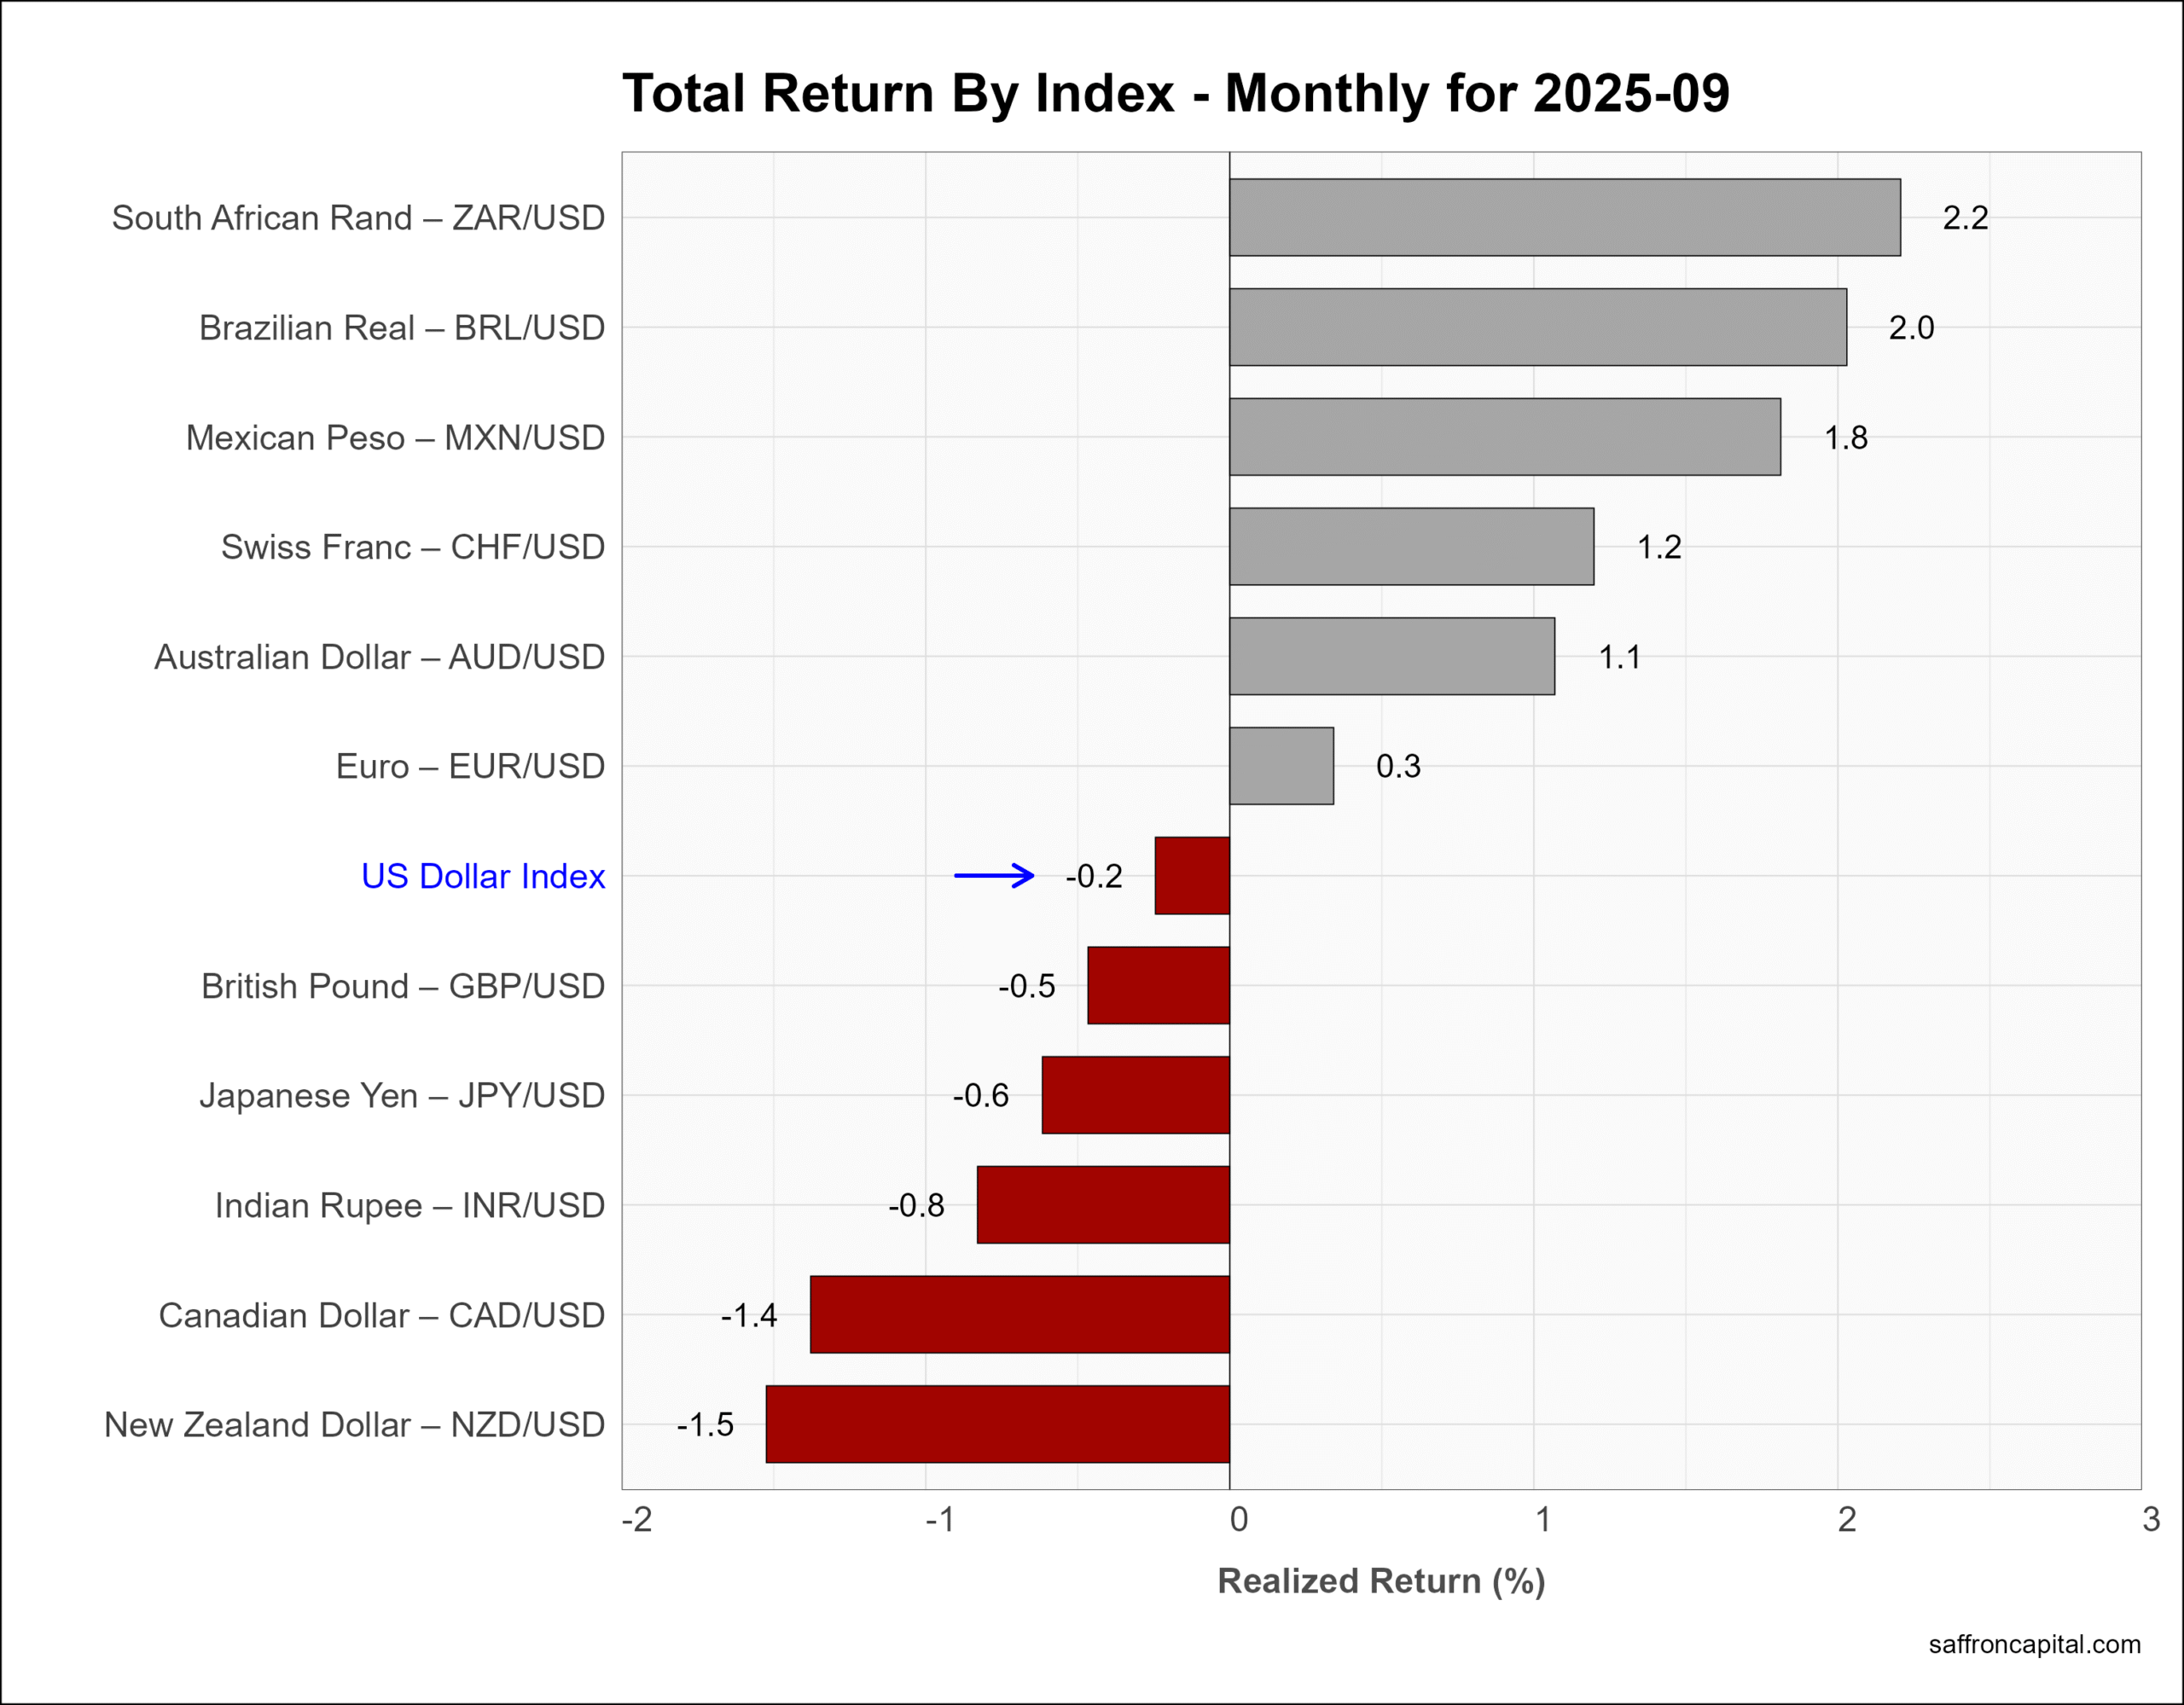
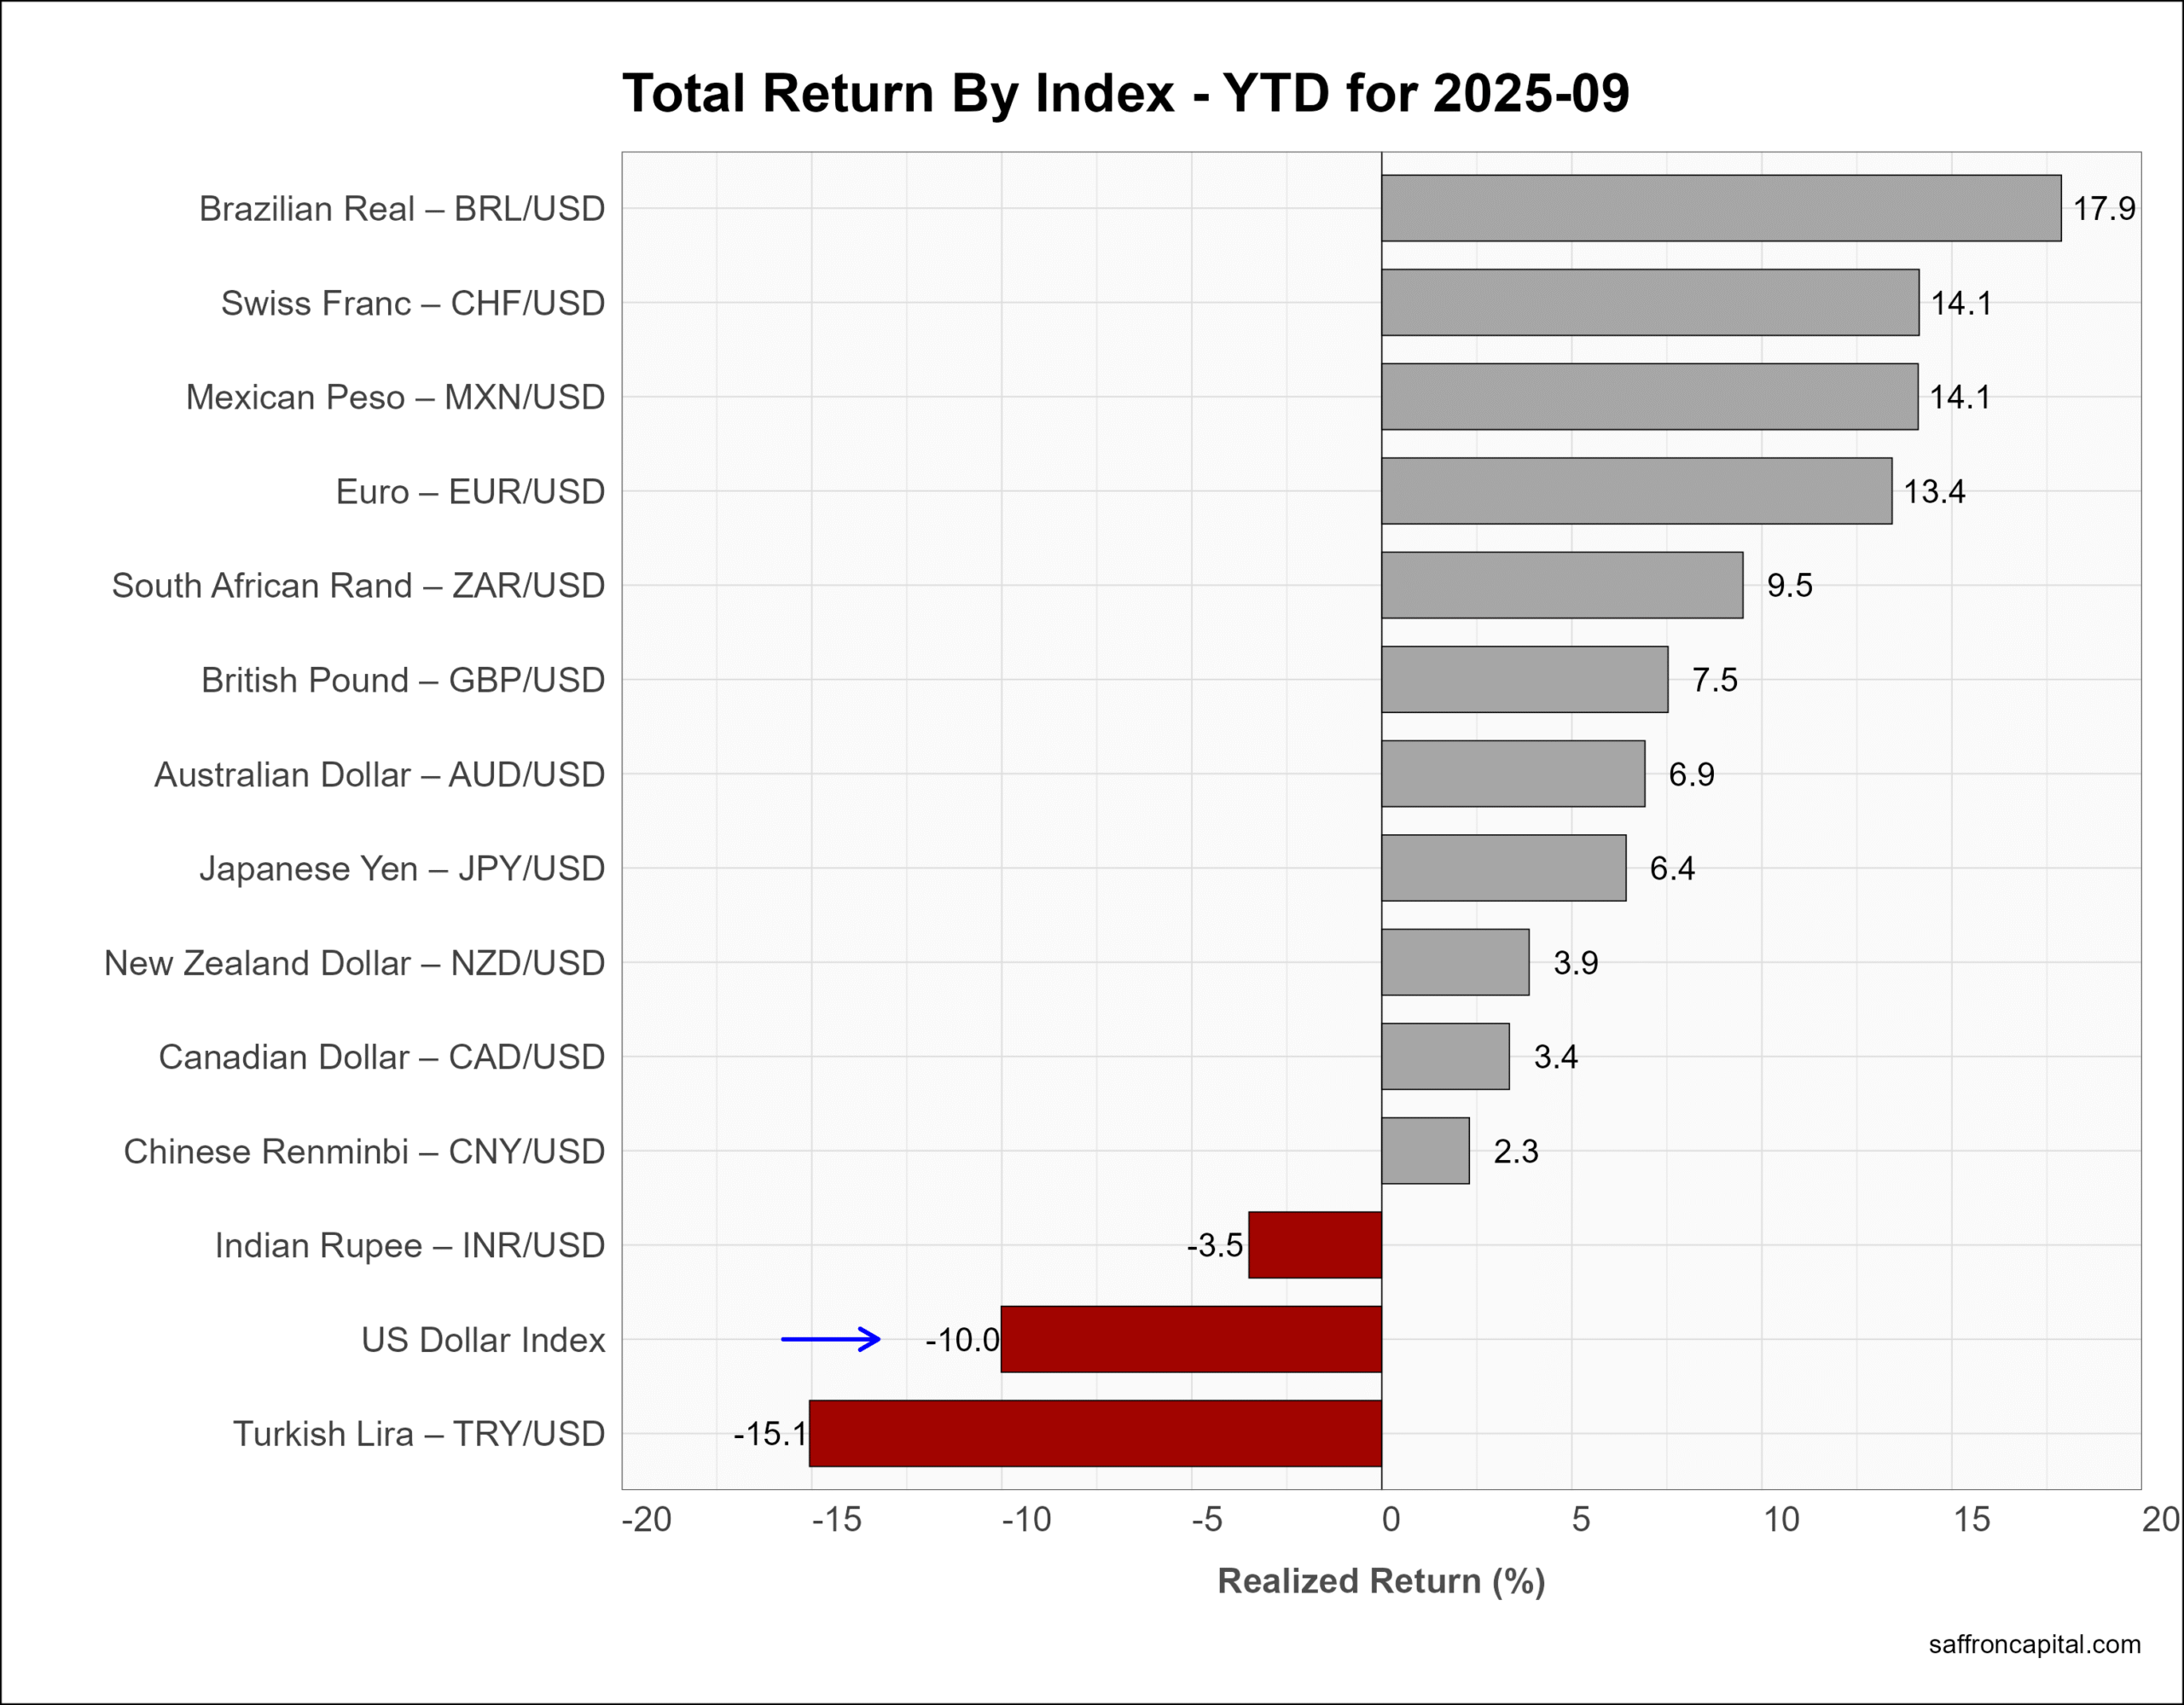
Currencies
The U.S. Dollar index (-0.2%) fell again in September and is down 10% since the start of the year.
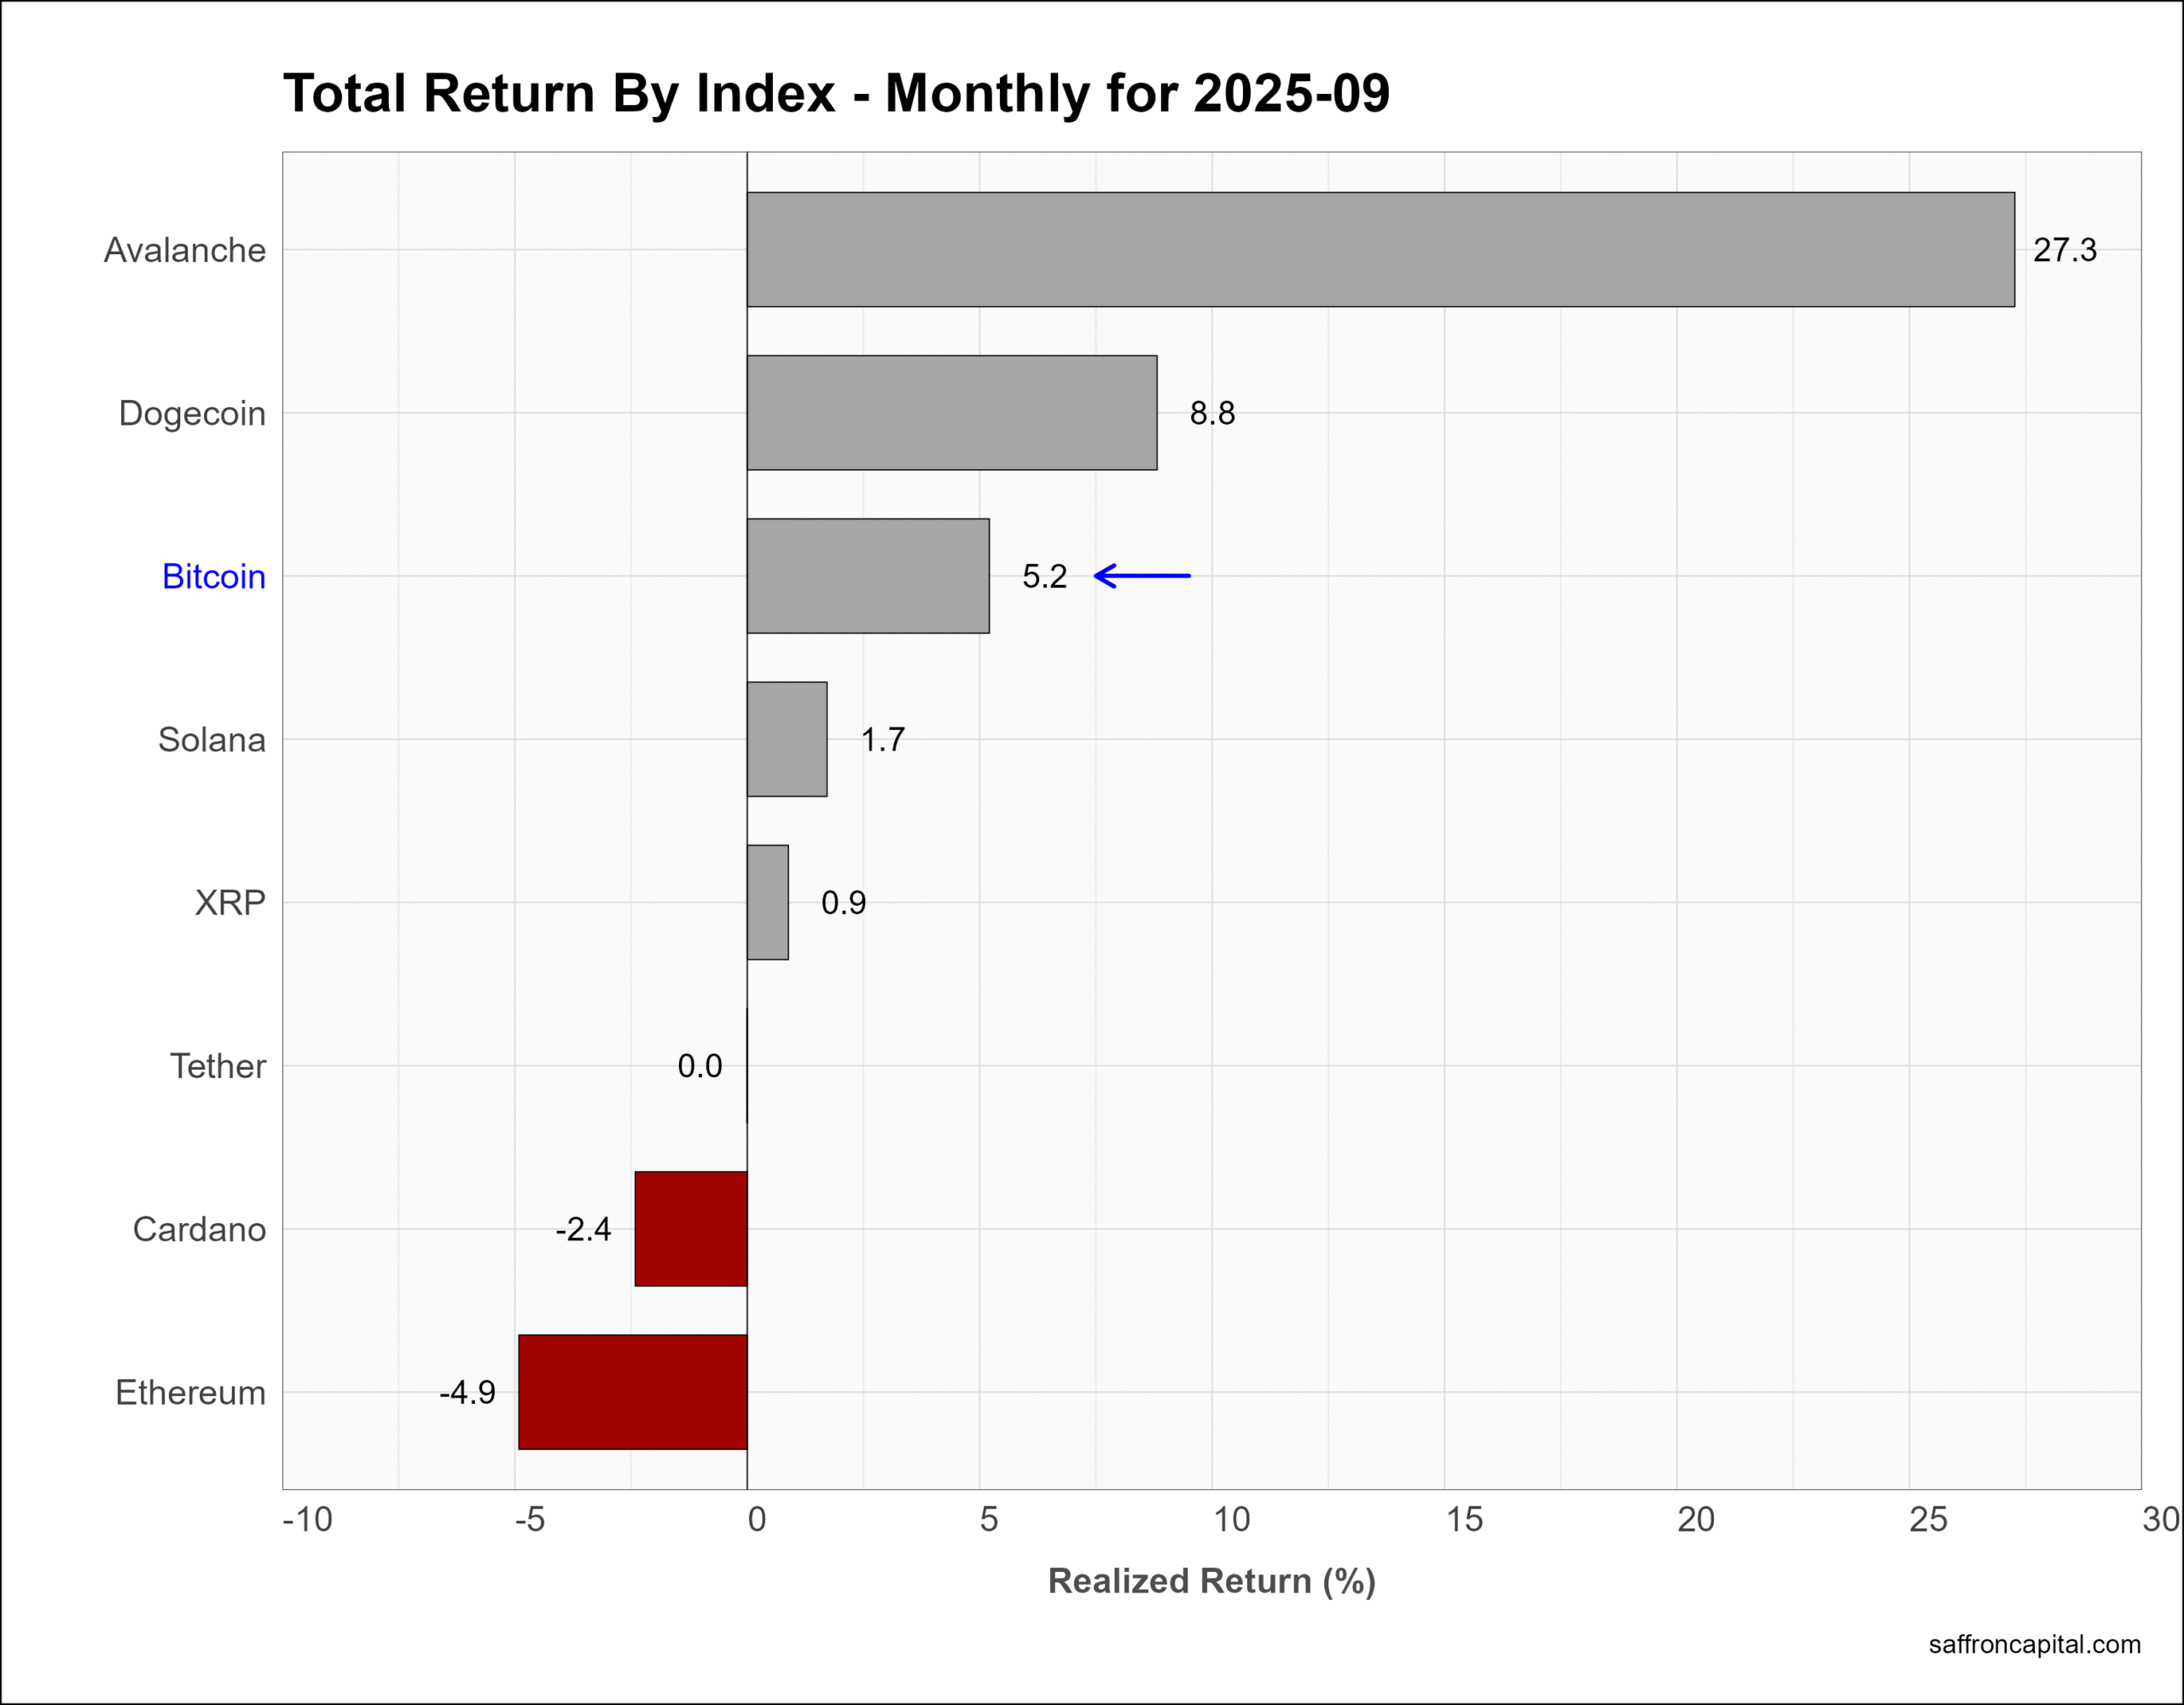
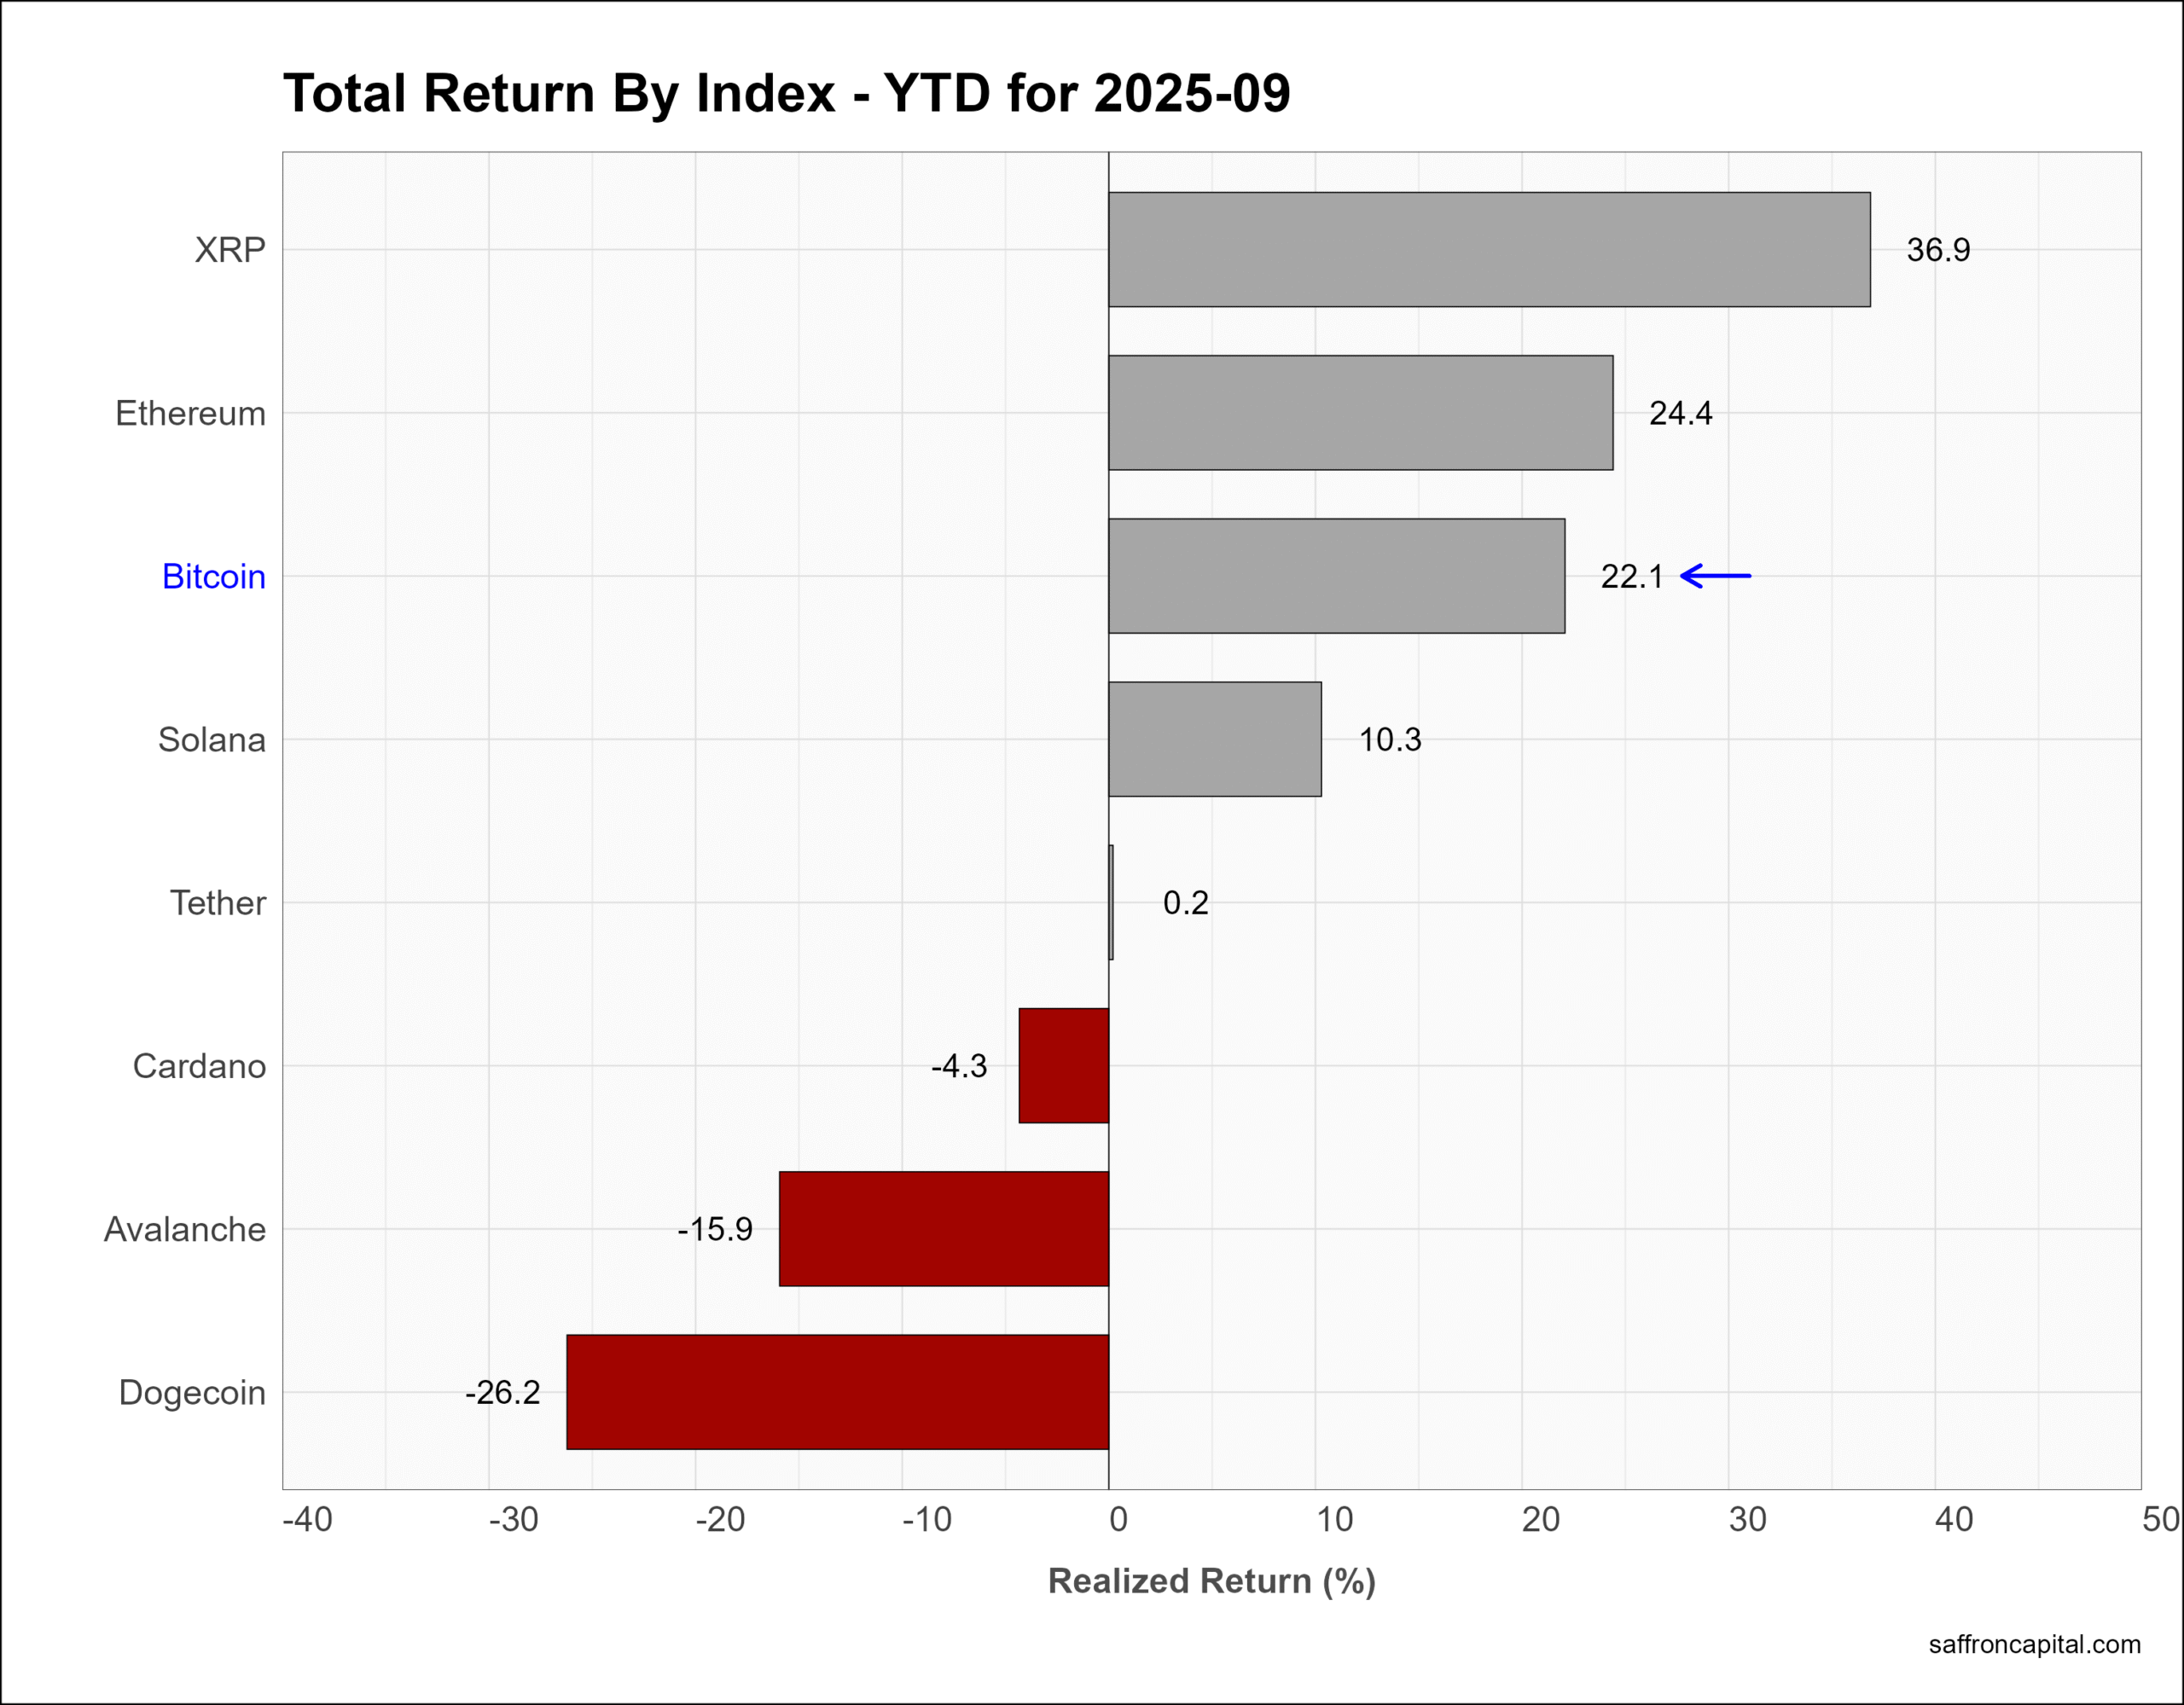
Cryptocurrencies
Benchmark Bitcoin (+5.2%) was up in September with Avalanche (+27.3%) and Dogecoin (+8.8%) having strong returns. Over the last three quarters, Bitcoin (+22.1%) is solidly outperforming US stocks but is still trailing Gold.
Click to enlarge
Have questions or concerns about the performance of your portfolio? Could you benefit from a capital preservation strategy or a custom portfolio formulation that better aligns to your return goals and risk appetite? Whatever your needs, we are here to listen and to help. Contact us here.
Saffron Capital LLC is a registered investment advisor that is employee-owned and Minnesota-based.


