January returns for equities were modest: the S&P 500 (+1.4%) and the NASDAQ-100 (+1.2%) were both outpaced by the S&P 600 Small Cap Index (+5.7%). Markets were supported by solid corporate earnings and AI-led optimism, with a spike in Japanese yields shocked markets mid-month. More broadly outside the U.S., Developed Markets (+4.6%) and Emerging Markets (+7.9%) benefited from a falling US Dollar (-1.2%) and shifting investor preferences. The GSCI Commodity Index (+10.5%) also benefited from spikes in Heating Oil (+29.0%), Silver (+11.6%), Gold (+9.0%), and Copper (+4.7%). Bitcoin (-3.9%) and other digital assets saw negative returns in January.
The following analysis is a visual summary of monthly and annual returns by asset group. The aim is to help investors to benchmark portfolio returns and to see key trends across markets and model portfolios.
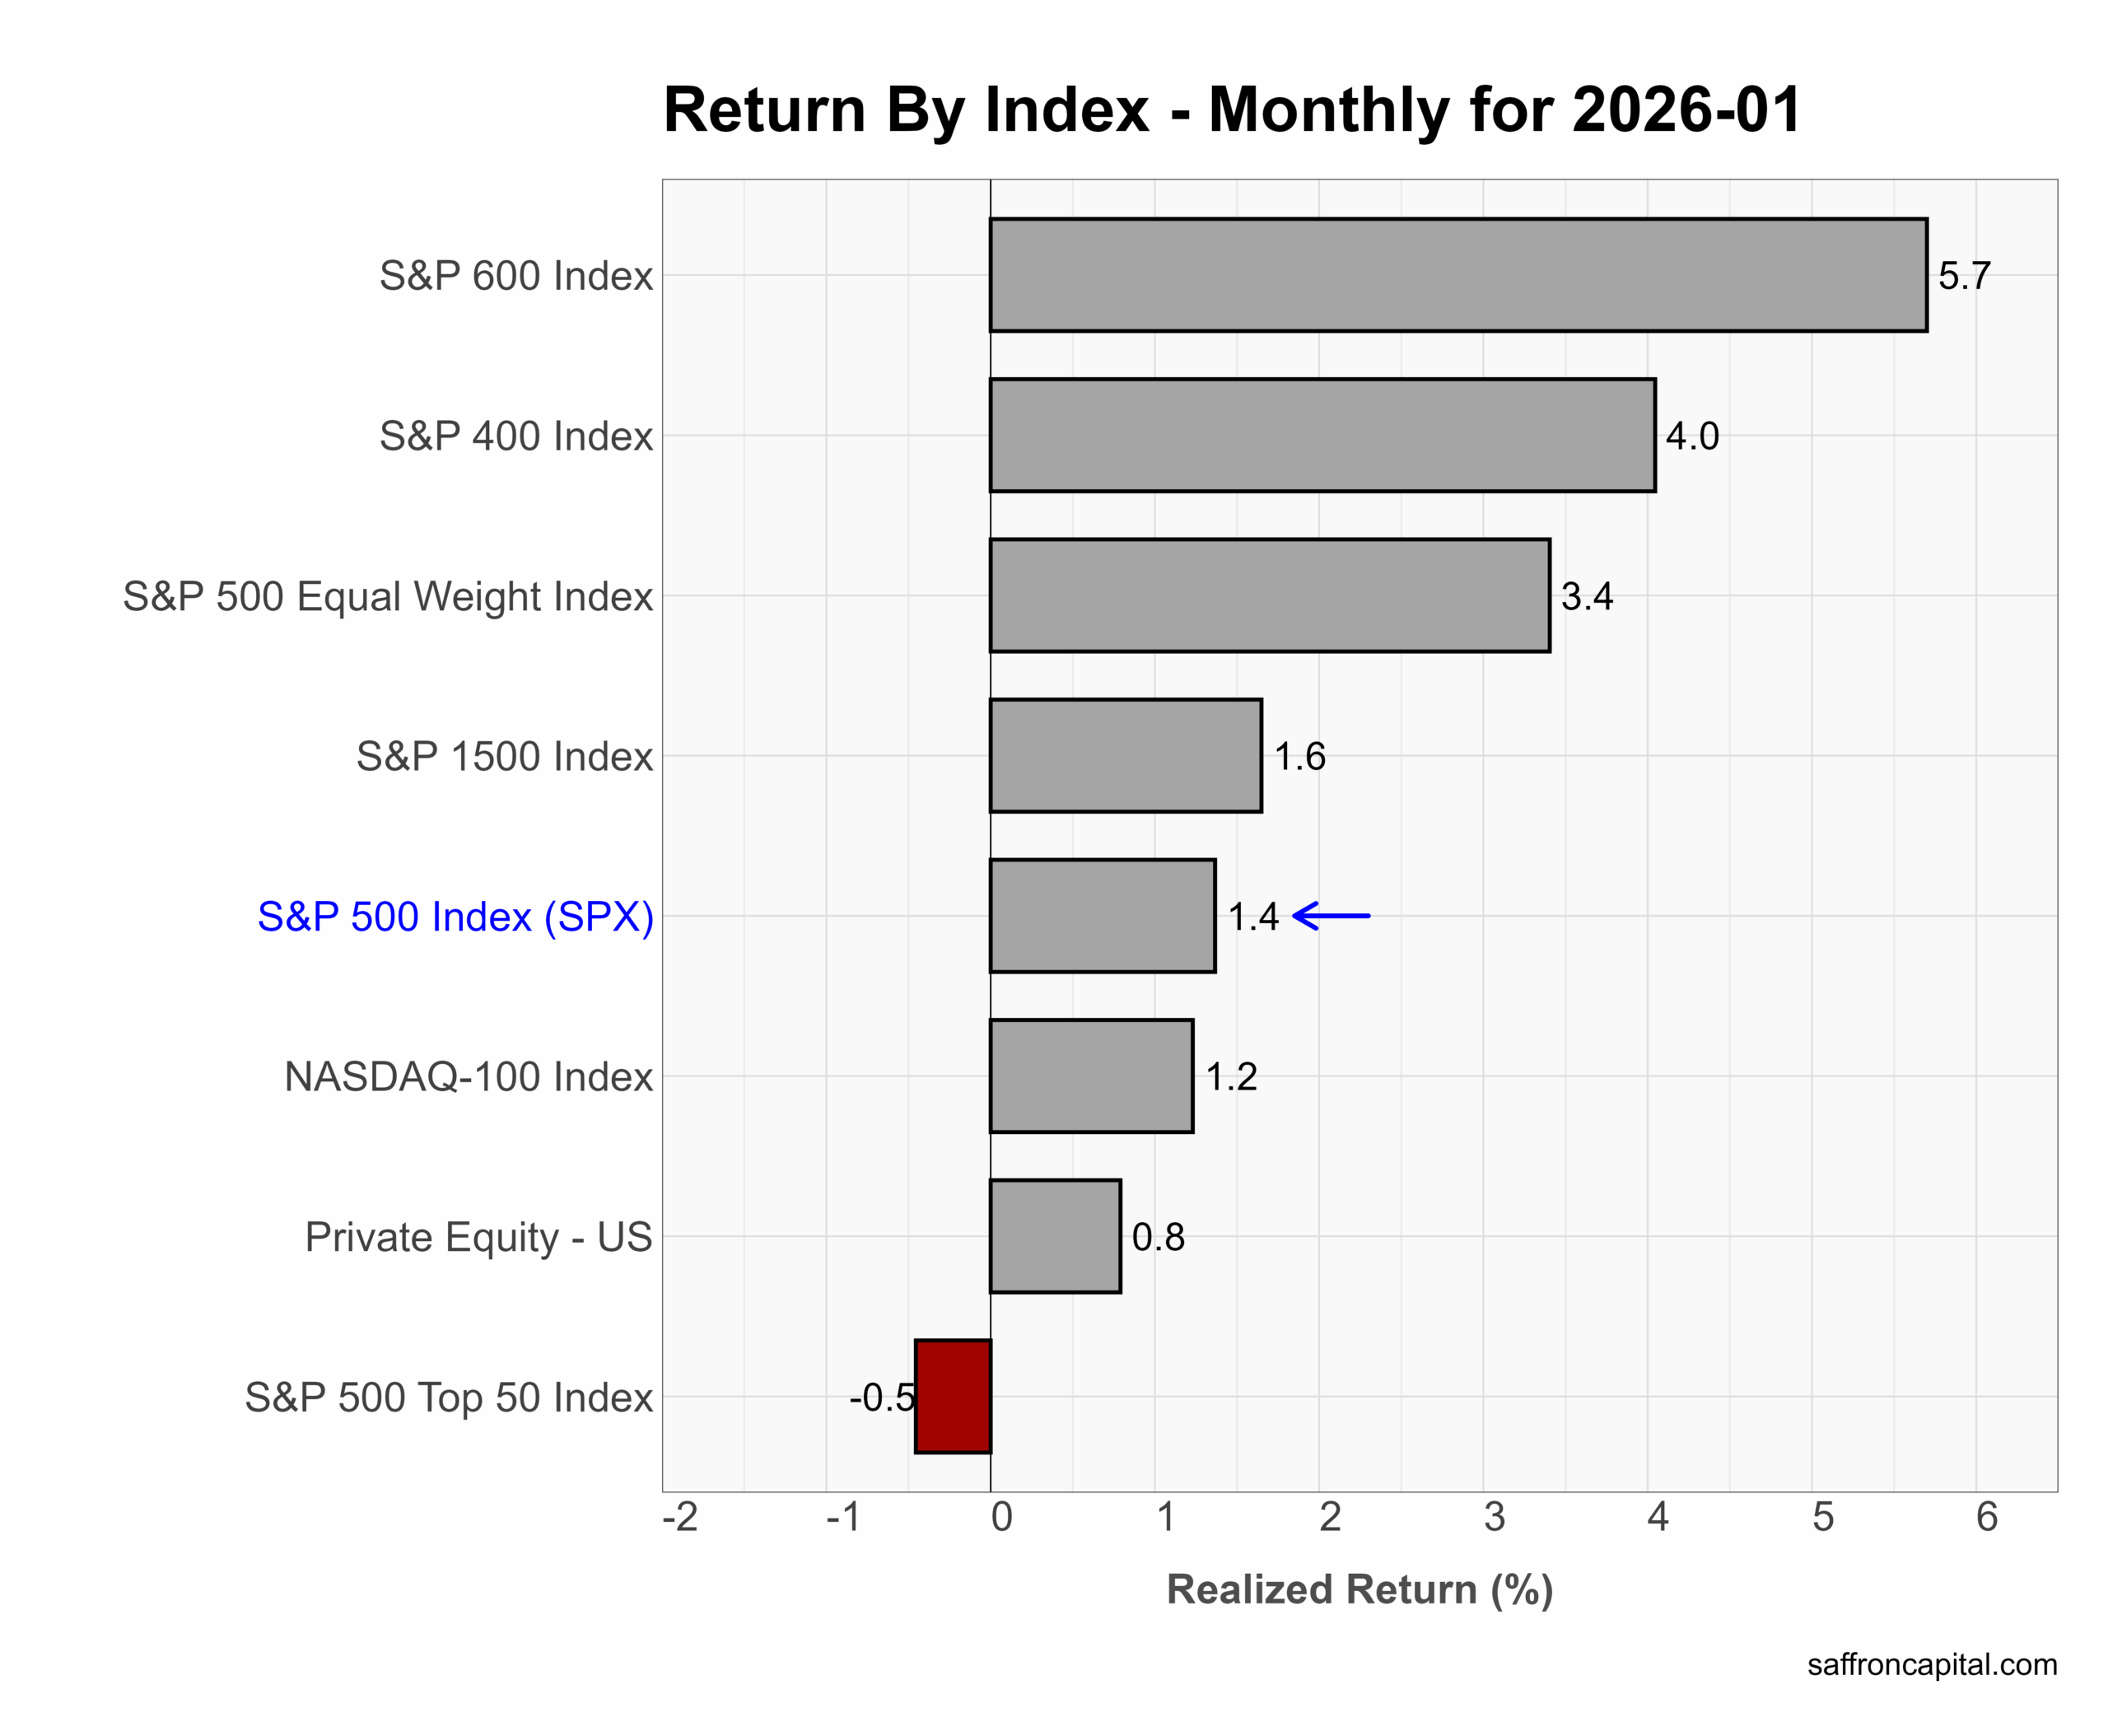
Core US Indices
U.S. equities delivered broad-based January returns, led by a clear rotation into small- and mid-cap stocks. The S&P 600 Small Cap Index surged +5.7% and the S&P 400 Mid Cap Index gained +4.0%, materially outperforming large-cap benchmarks. The S&P 500 Equal Weight Index rose +3.4%, more than doubling the return of the cap-weighted S&P 500 Index (+1.4%), highlighting improving market breadth. By contrast, mega-cap leadership faded, with the NASDAQ-100 up just +1.2% and the S&P 500 Top 50 Index declining −0.5%. Rotation reflected resilient U.S. growth data, easing recession risk, and attractive relative valuations in cyclicals and domestically oriented companie.
Click to enlarge
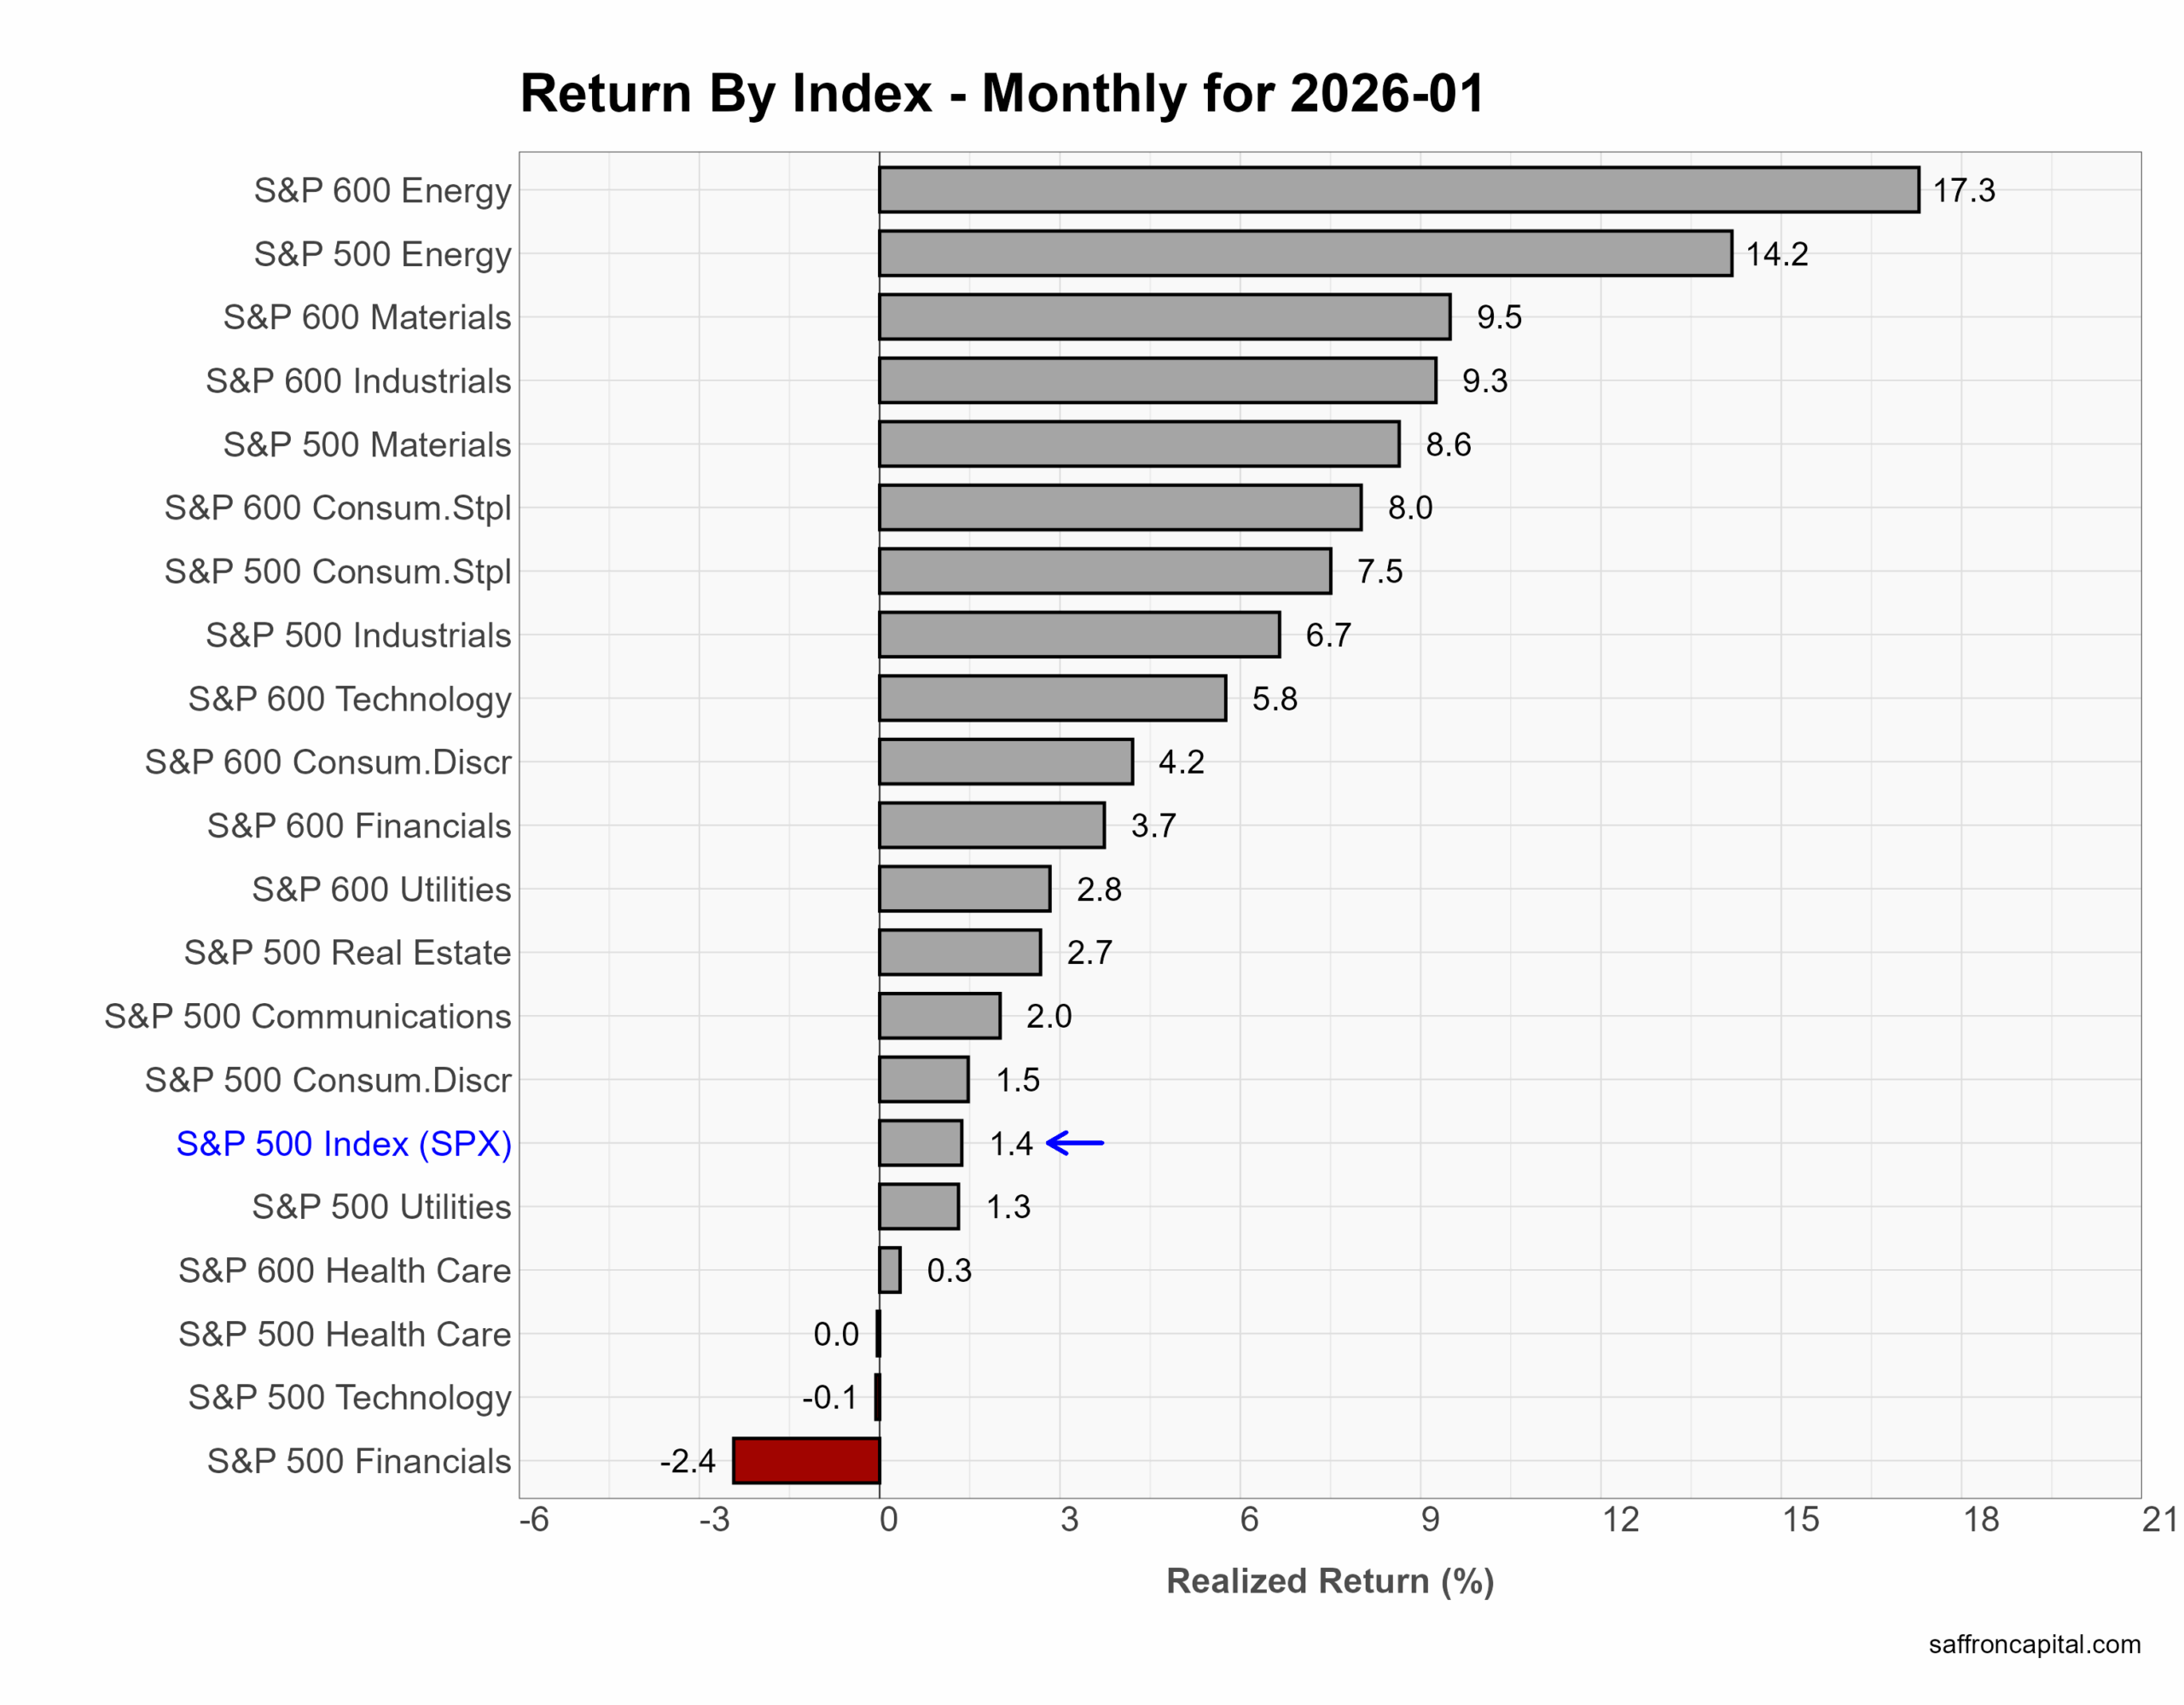
US Sector Indices
January returns by sector were led by Energy and Materials, with small-cap Energy (+17.3%) and large-cap Energy (+14.2%) posting outsized gains amid higher oil prices, tighter global supply conditions, and renewed geopolitical risk premia. Materials also performed across market caps, supported by infrastructure spending, industrial metals demand, and improving global manufacturing sentiment. Industrials and Consumer Staples delivered solid gains, reflecting resilient domestic growth and steady demand. Technology lagged broader cyclicals, particularly in large caps, as investors rotated toward more economically sensitive sectors and away from crowded growth trades. Financials underperformed in January as yield-curve dynamics and margin pressures weighed on bank earnings outlooks. Health Care was largely flat, reflecting limited earnings catalysts and ongoing policy uncertainty.
Click to enlarge
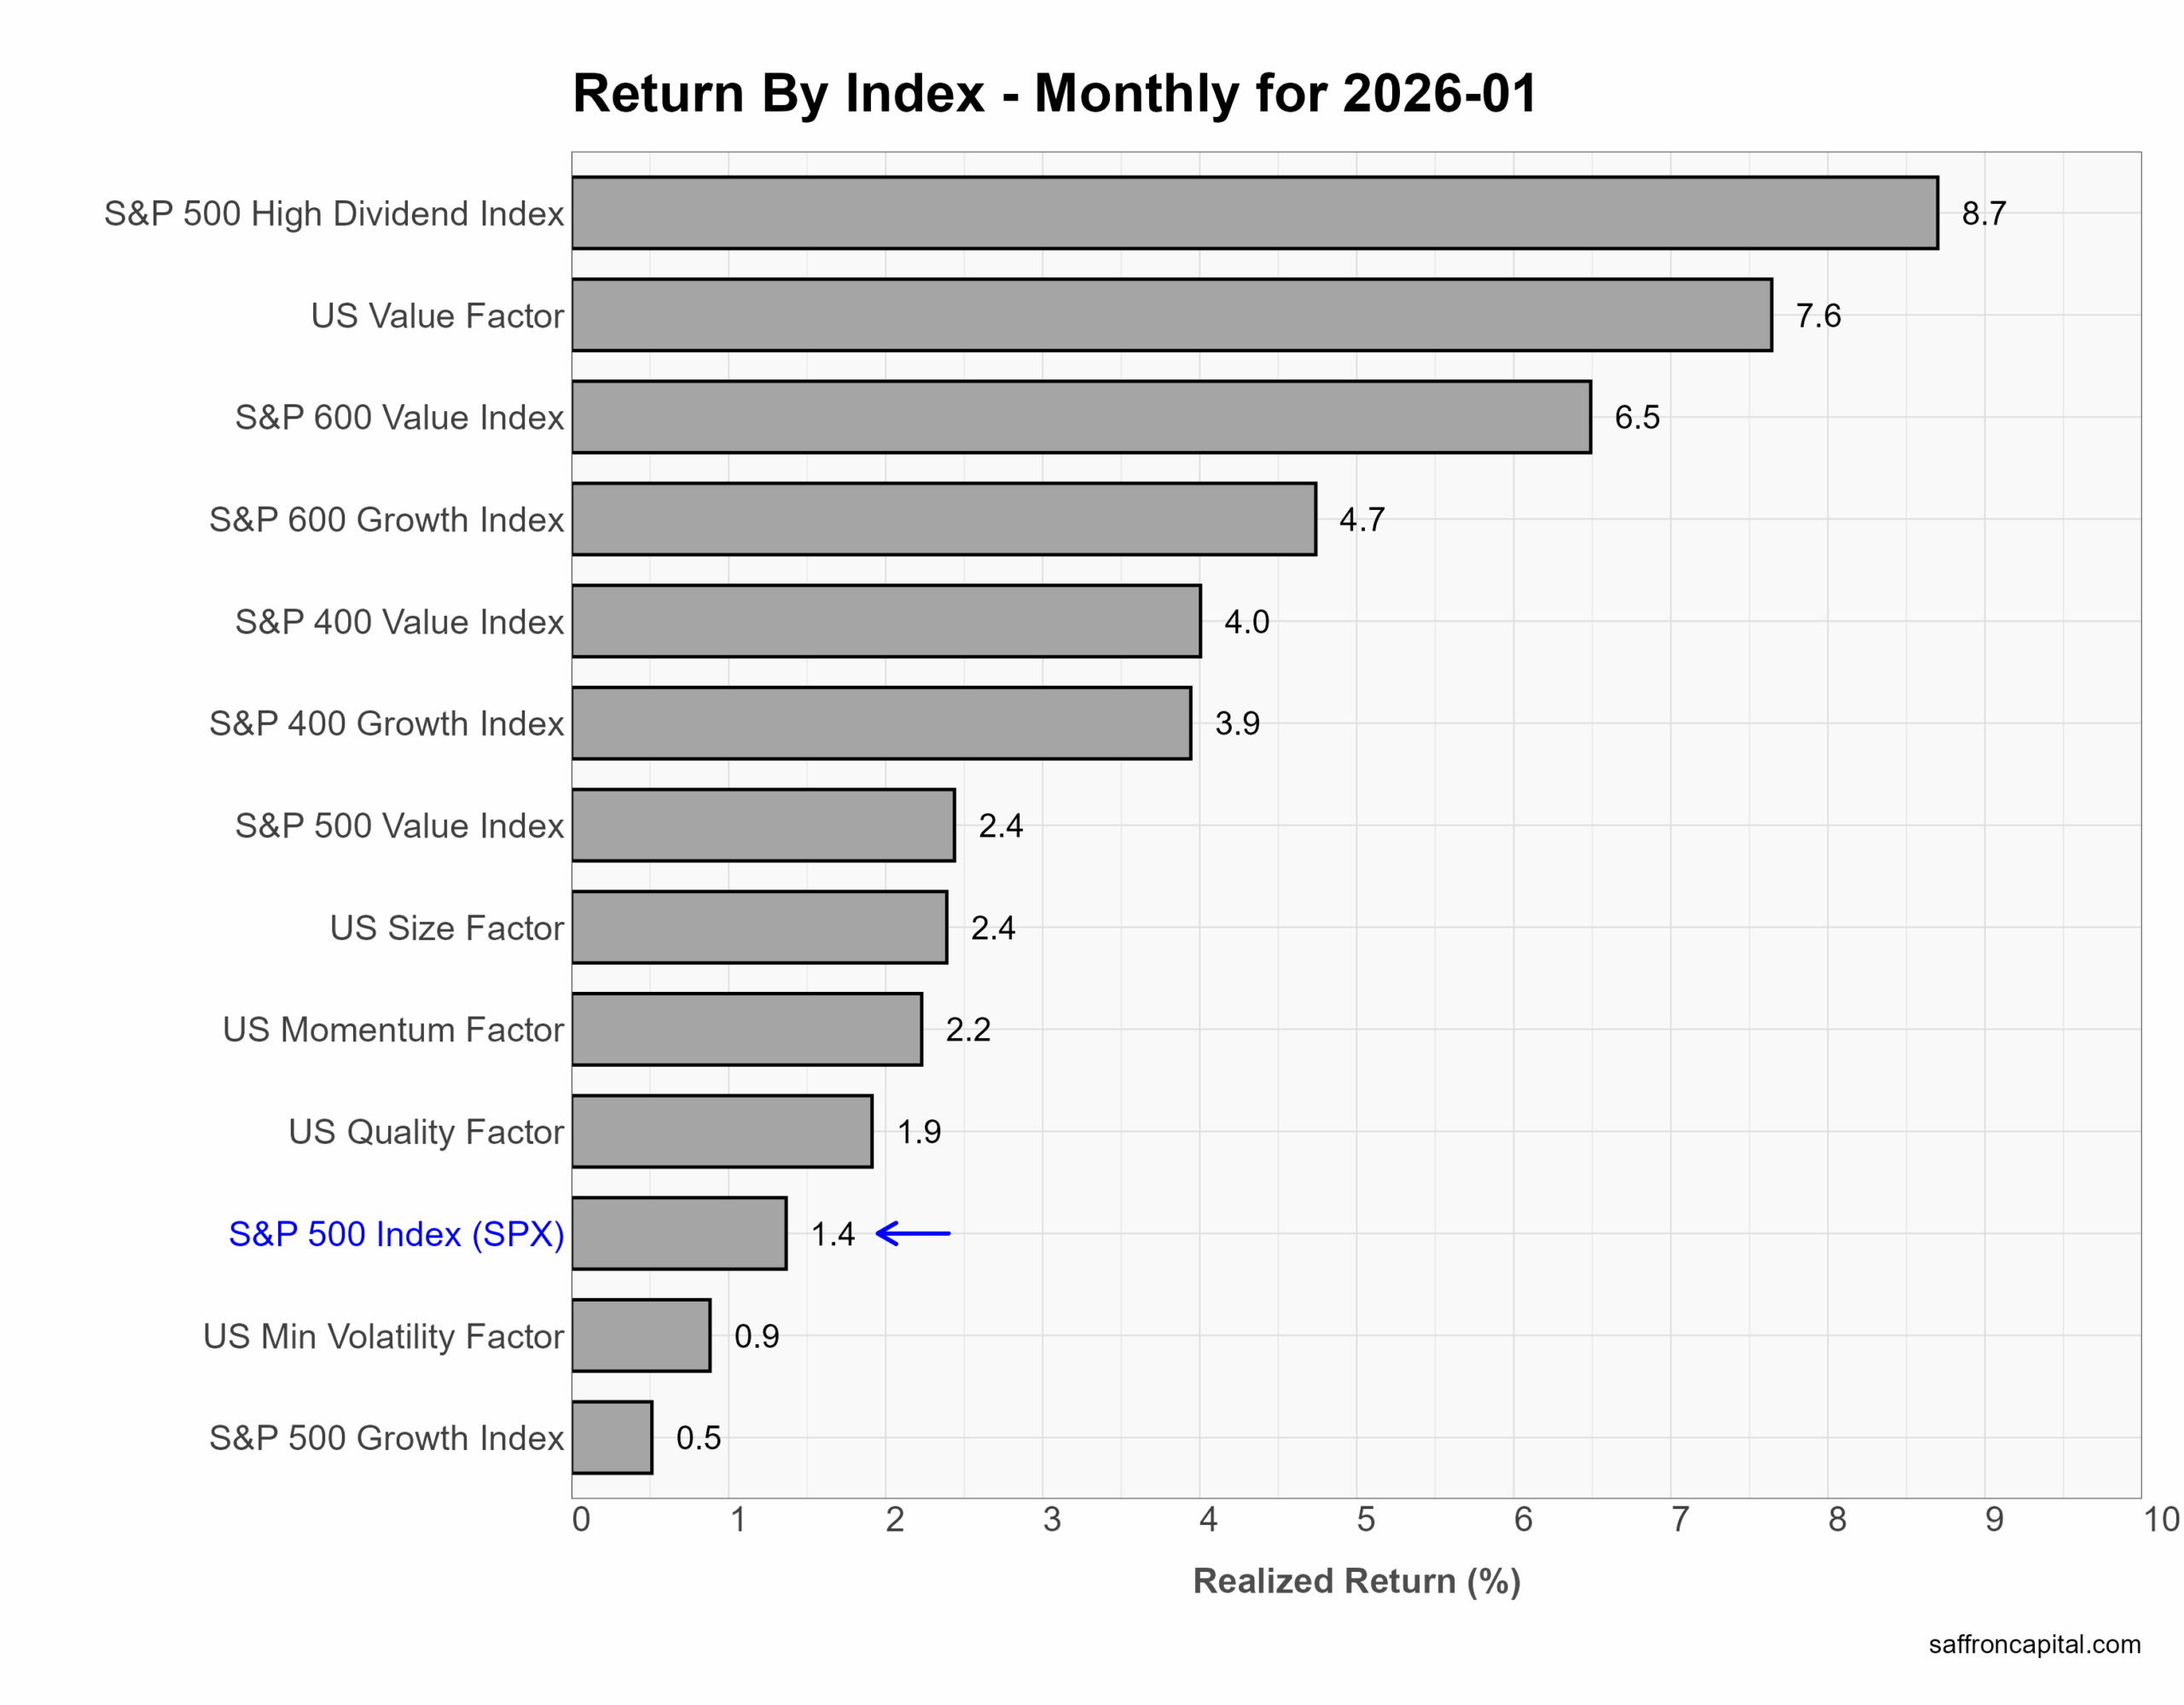
US Factor Indices
Factor portfolios are designed to isolate the specific drivers of equity returns, such as valuation, income, momentum, quality, and volatility. These model portfolios help investors understand what types of company characteristics are being rewarded in a given market environment. January returns show that ZHigh Dividends (+8.7%) and the Value factor (+7.6%) significantly outperformed the S&P 500 index. Returns reflected rising cash-flow sensitivity, rewarding lower value companies with stable earnings expectations, and supporting investor demand for income amid macro uncertainty. The US Momentum (+2.2%) and Quality (+1.9%) factors posted modest gains, while Growth (+0.5%) lagged, as elevated valuations limited upside. Overall, factor performance in January signaled a market favoring cash generation, valuation discipline, and defensive income characteristics over pure growth exposure.
Click to enlarge
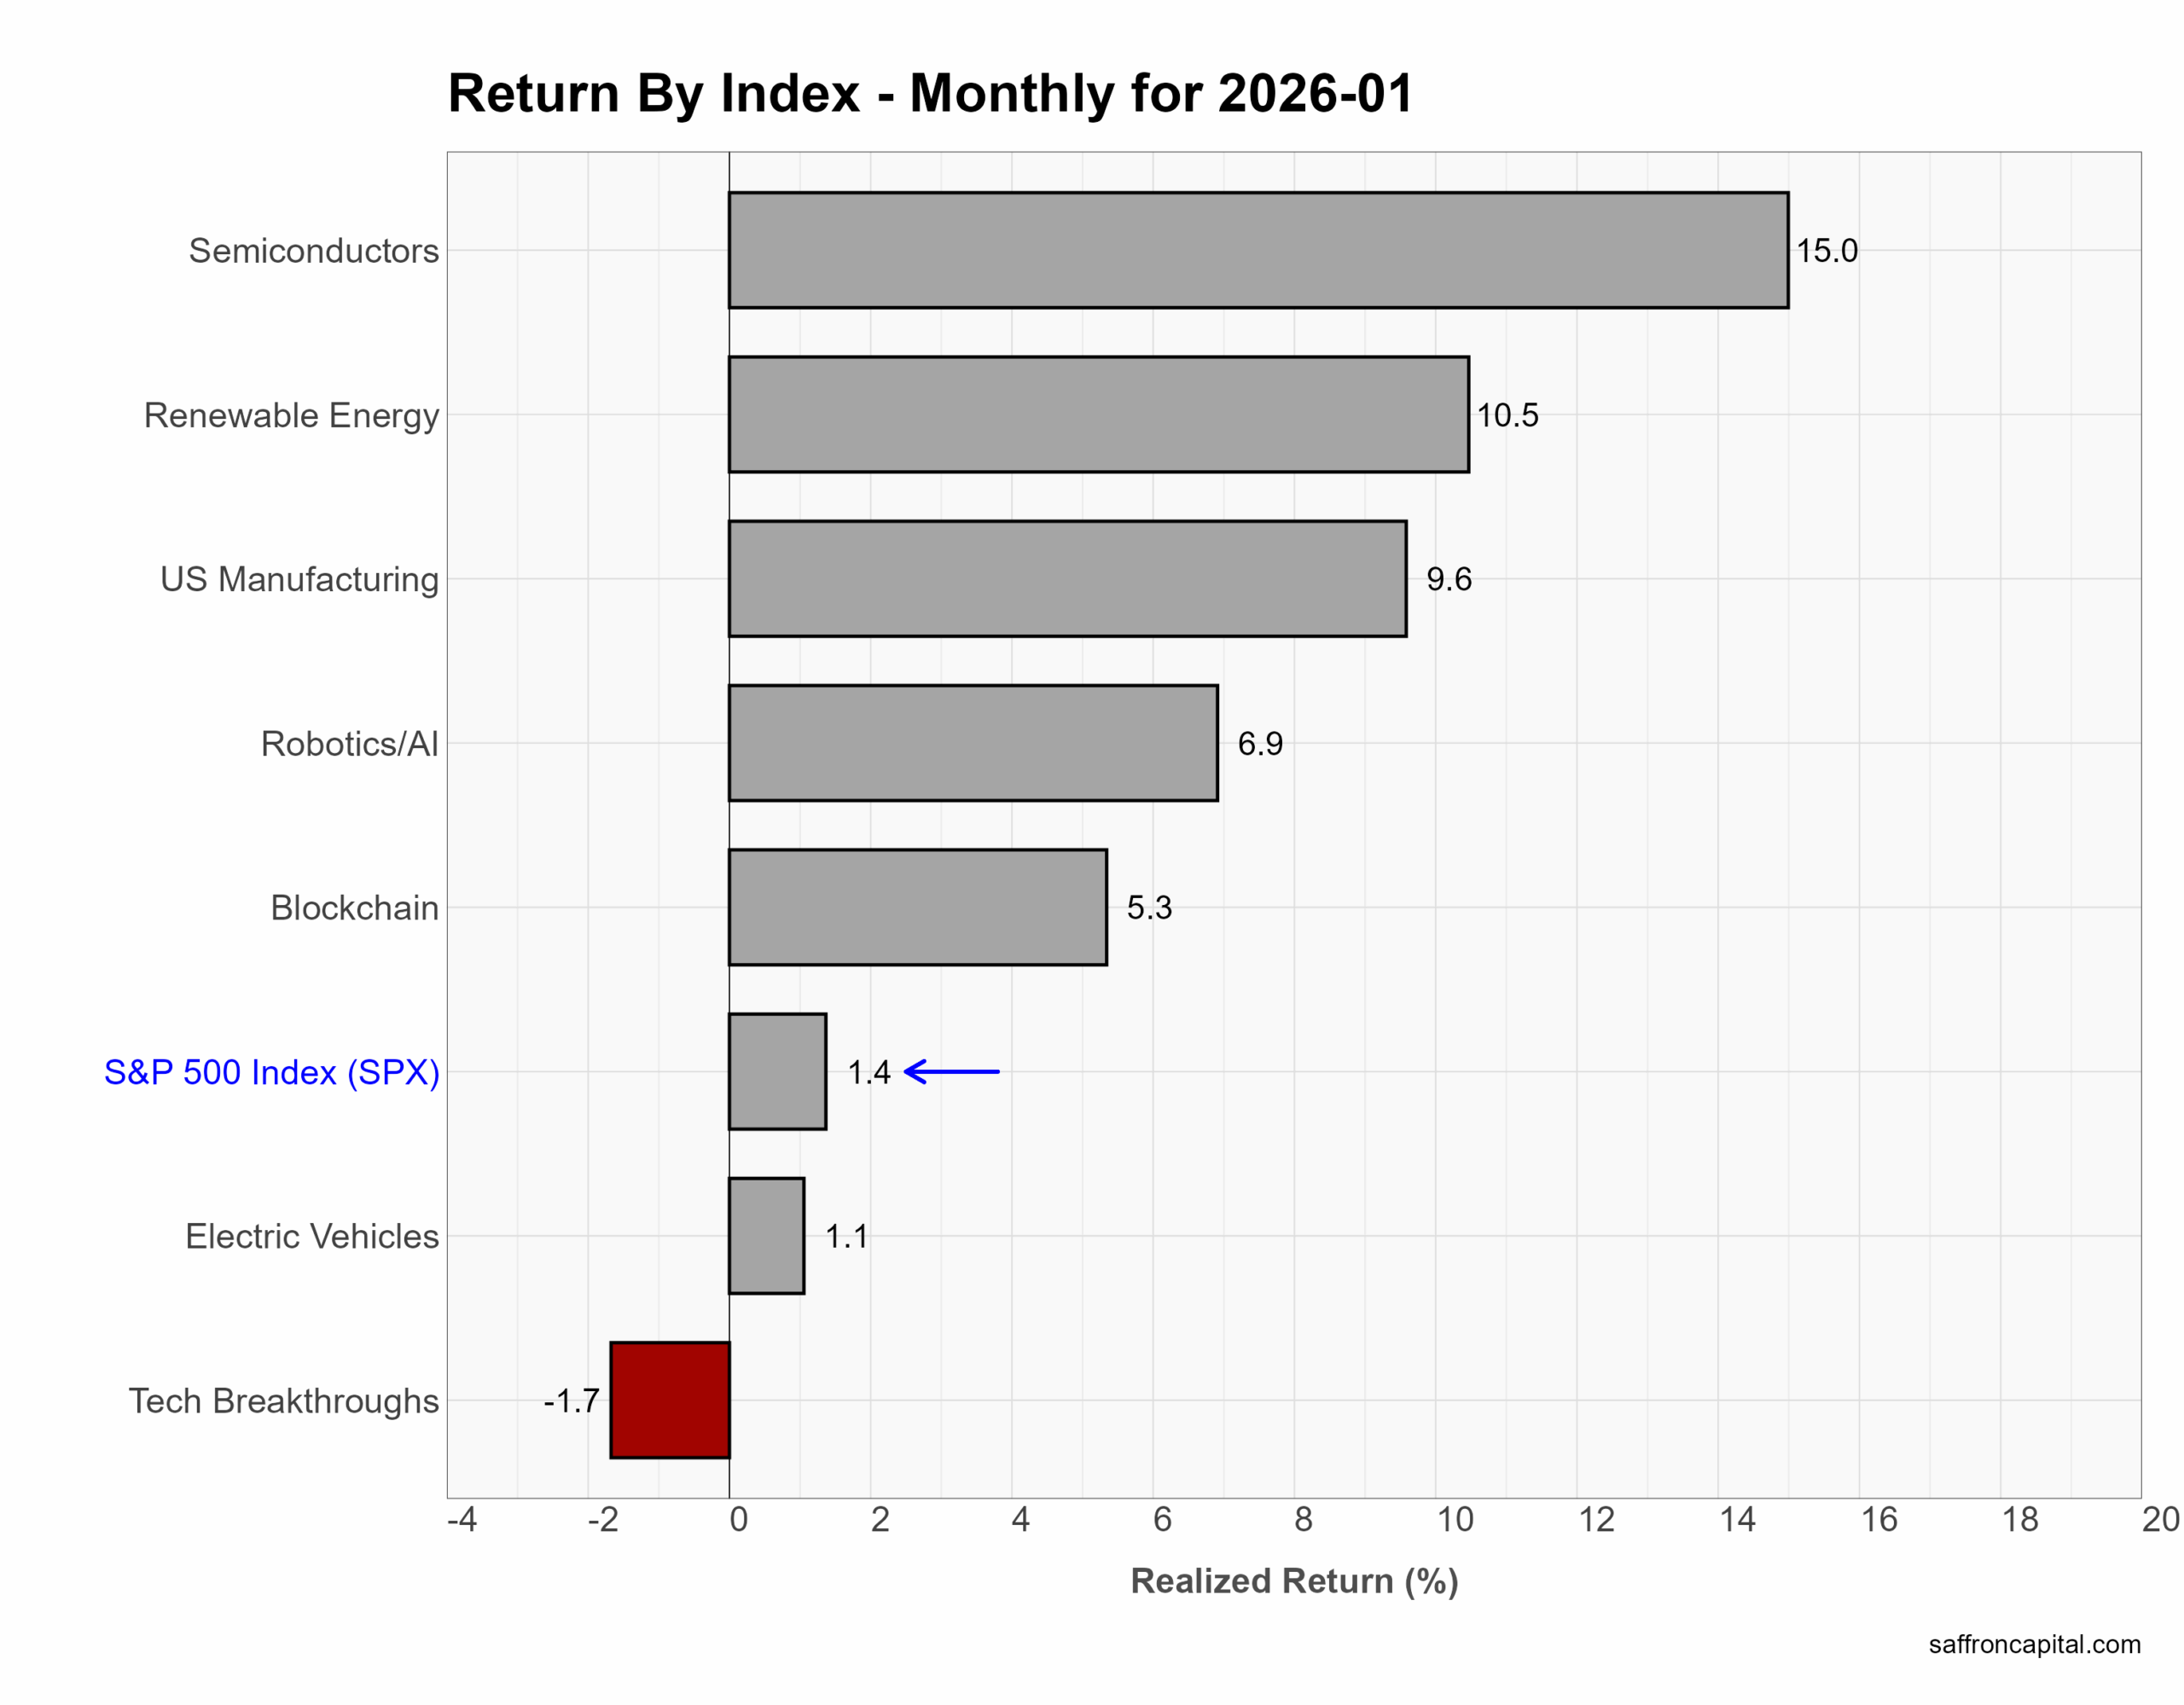
US Thematic Portfolios
US thematic portfolios delivered strong gains in January, led by Semiconductors (+15.0%), Renewable Energy (+10.5%), and US Manufacturing (+9.6%). Semiconductor performance reflected continued AI-driven capital spending, improving memory pricing, and resilient demand for advanced logic chips. Renewable Energy rebounded as investors priced in supportive policy signals, easing financing conditions, and accelerating grid and storage investment. US Manufacturing benefited from stabilizing global PMIs, reshoring momentum, and increased infrastructure-related orders. Robotics/AI (+6.9%) advanced alongside semiconductors, supported by enterprise automation and productivity investment. Blockchain shares (+5.3%) recovered as digital asset prices firmed and regulatory clarity improved. Electric Vehicles (+1.1%) lagged broader themes amid pricing pressure and margin concerns, while Tech Breakthroughs (-1.7%) underperformed as speculative growth cooled and investors favored nearer-term cash flow visibility.
Click to enlarge
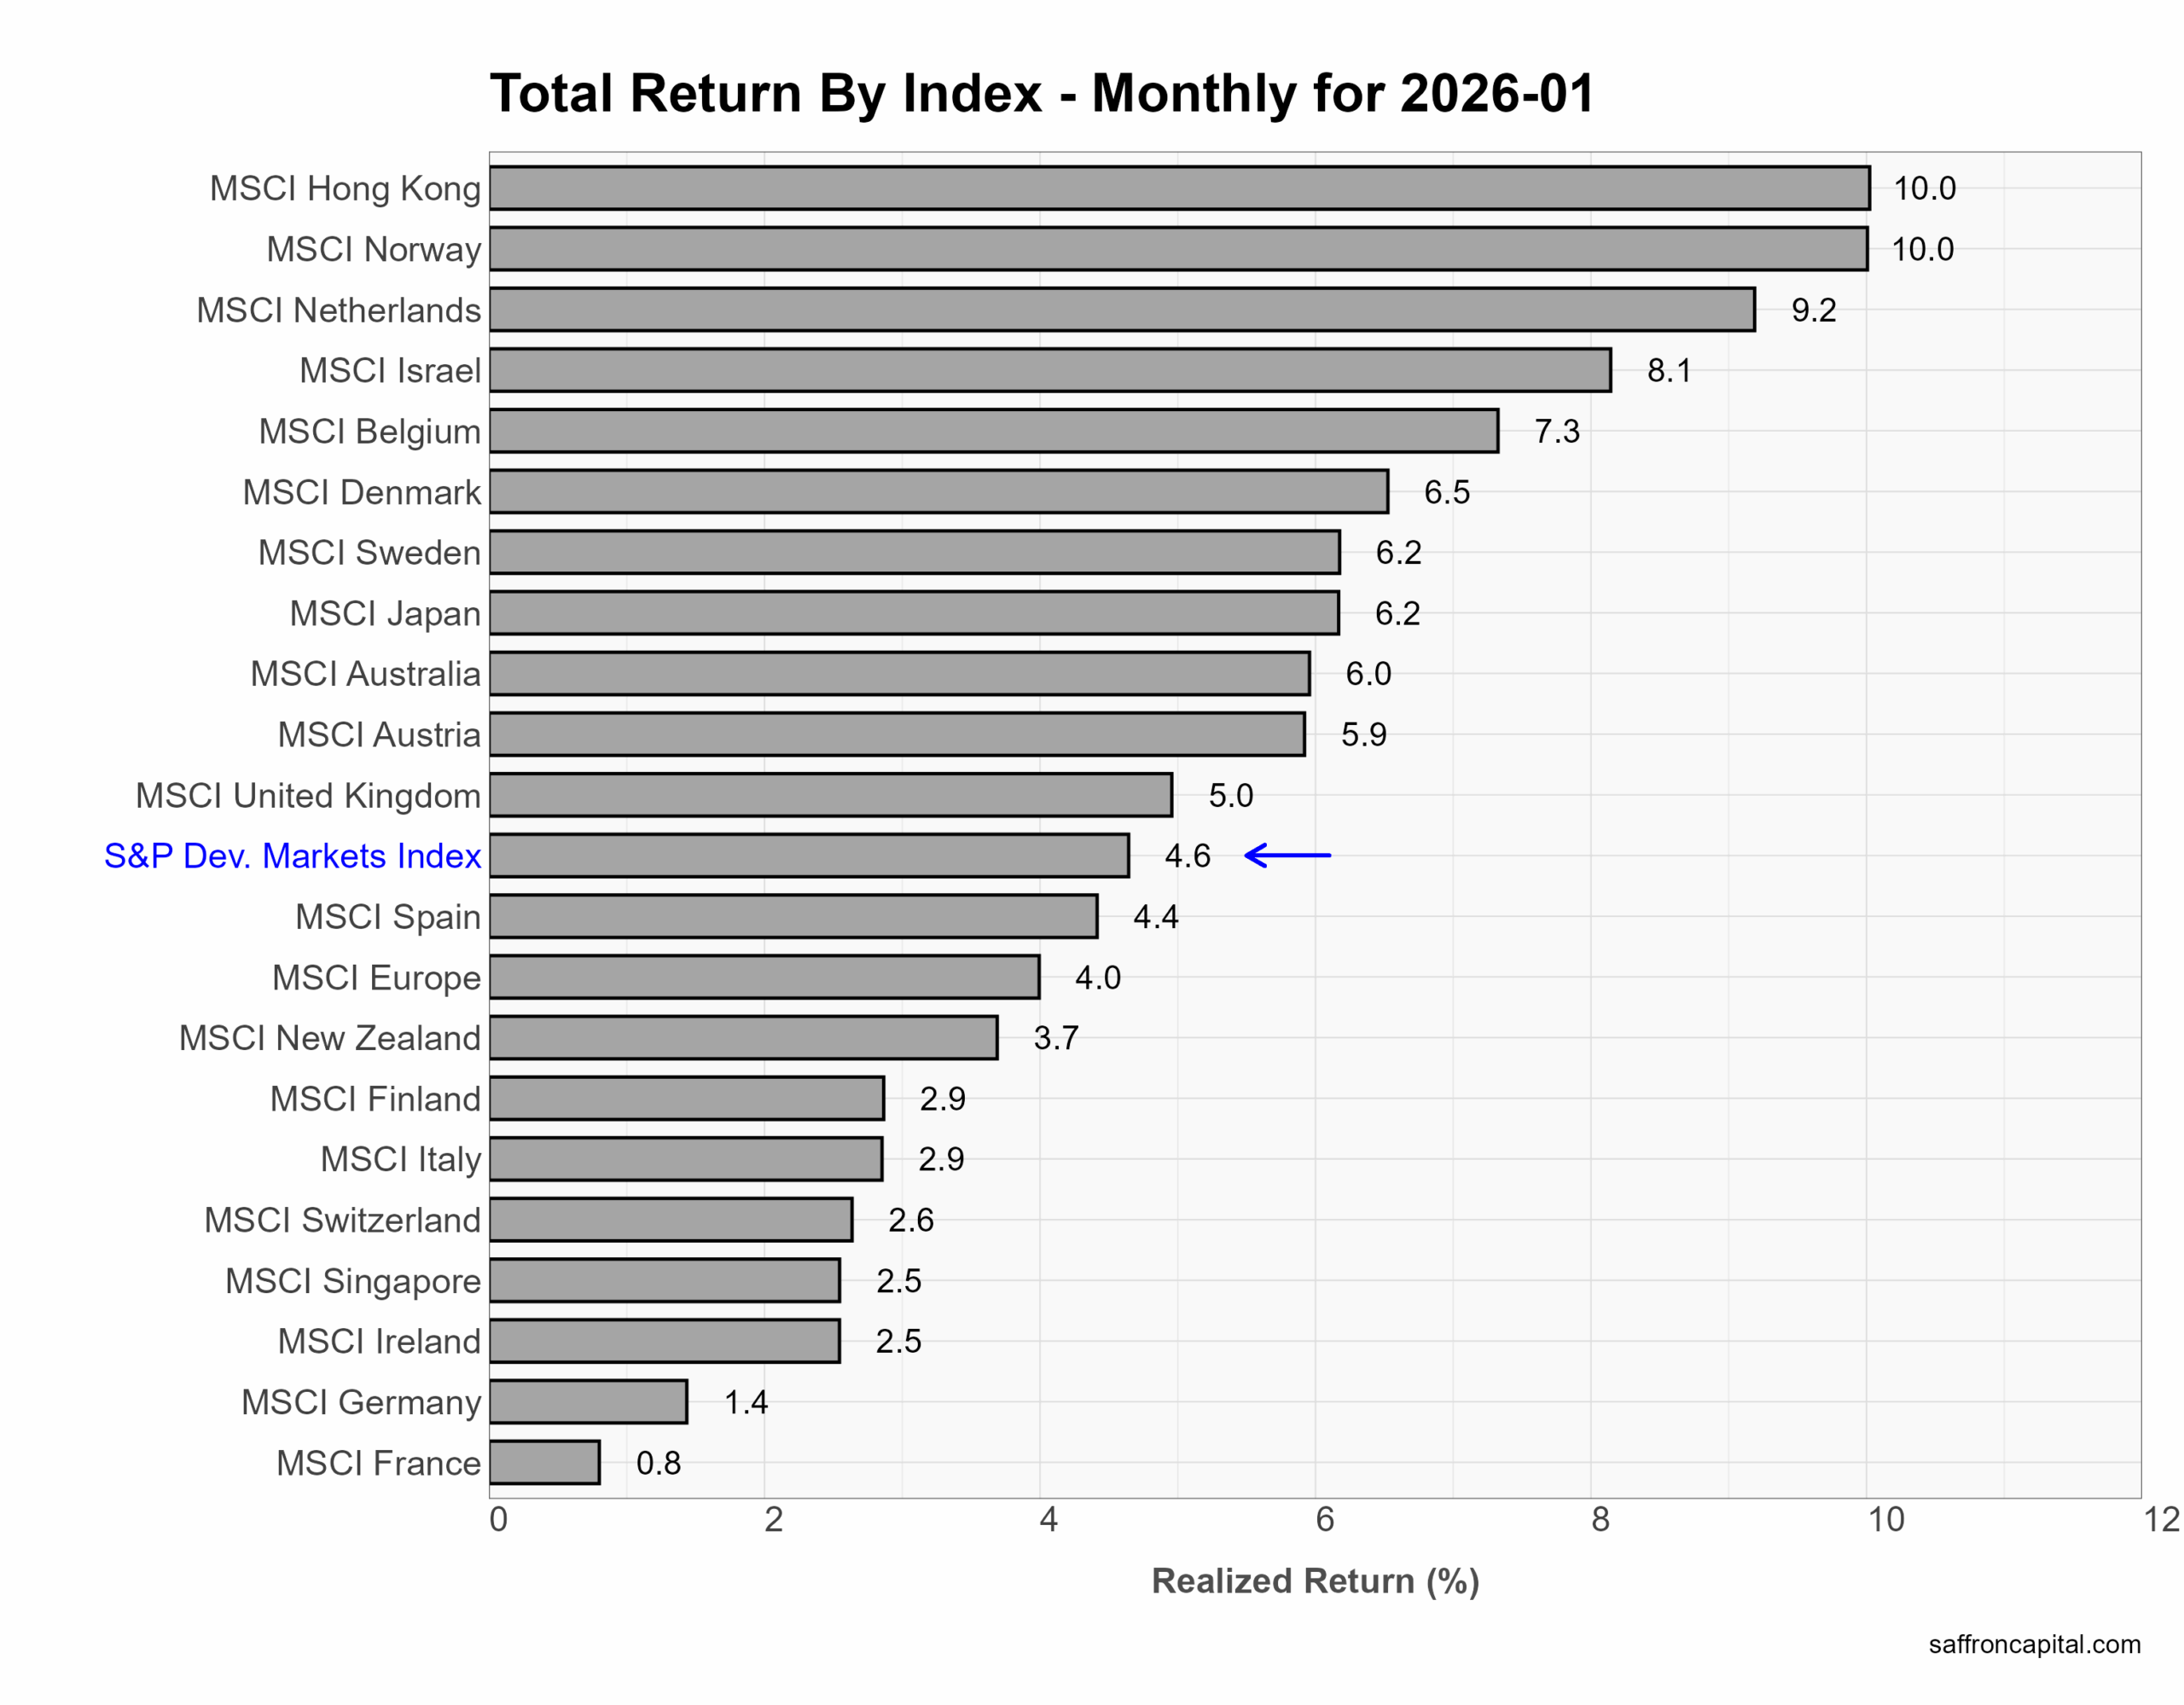
Developed Market Equities
Developed international equity markets extended their leadership with solid January returns, reinforcing a trend that began in early 2025. The S&P Developed Markets Index gained +4.6%, comfortably outpacing U.S. benchmarks. Performance was led by Hong Kong (+10.0%), Norway (+10.0%), the Netherlands (+9.2%), and Israel (+8.1%), with broad strength across Europe and Asia. Europe continued to outperform, supported by cyclical exposure, easing financial conditions, and attractive valuations relative to U.S. equities. Japan (+6.2%) and the U.K. (+5.0%) also delivered solid gains. Early 2026 results suggest international markets are once again capitalizing on global growth, sector diversification, and valuation tailwinds versus the more concentrated U.S. market.
Click to enlarge
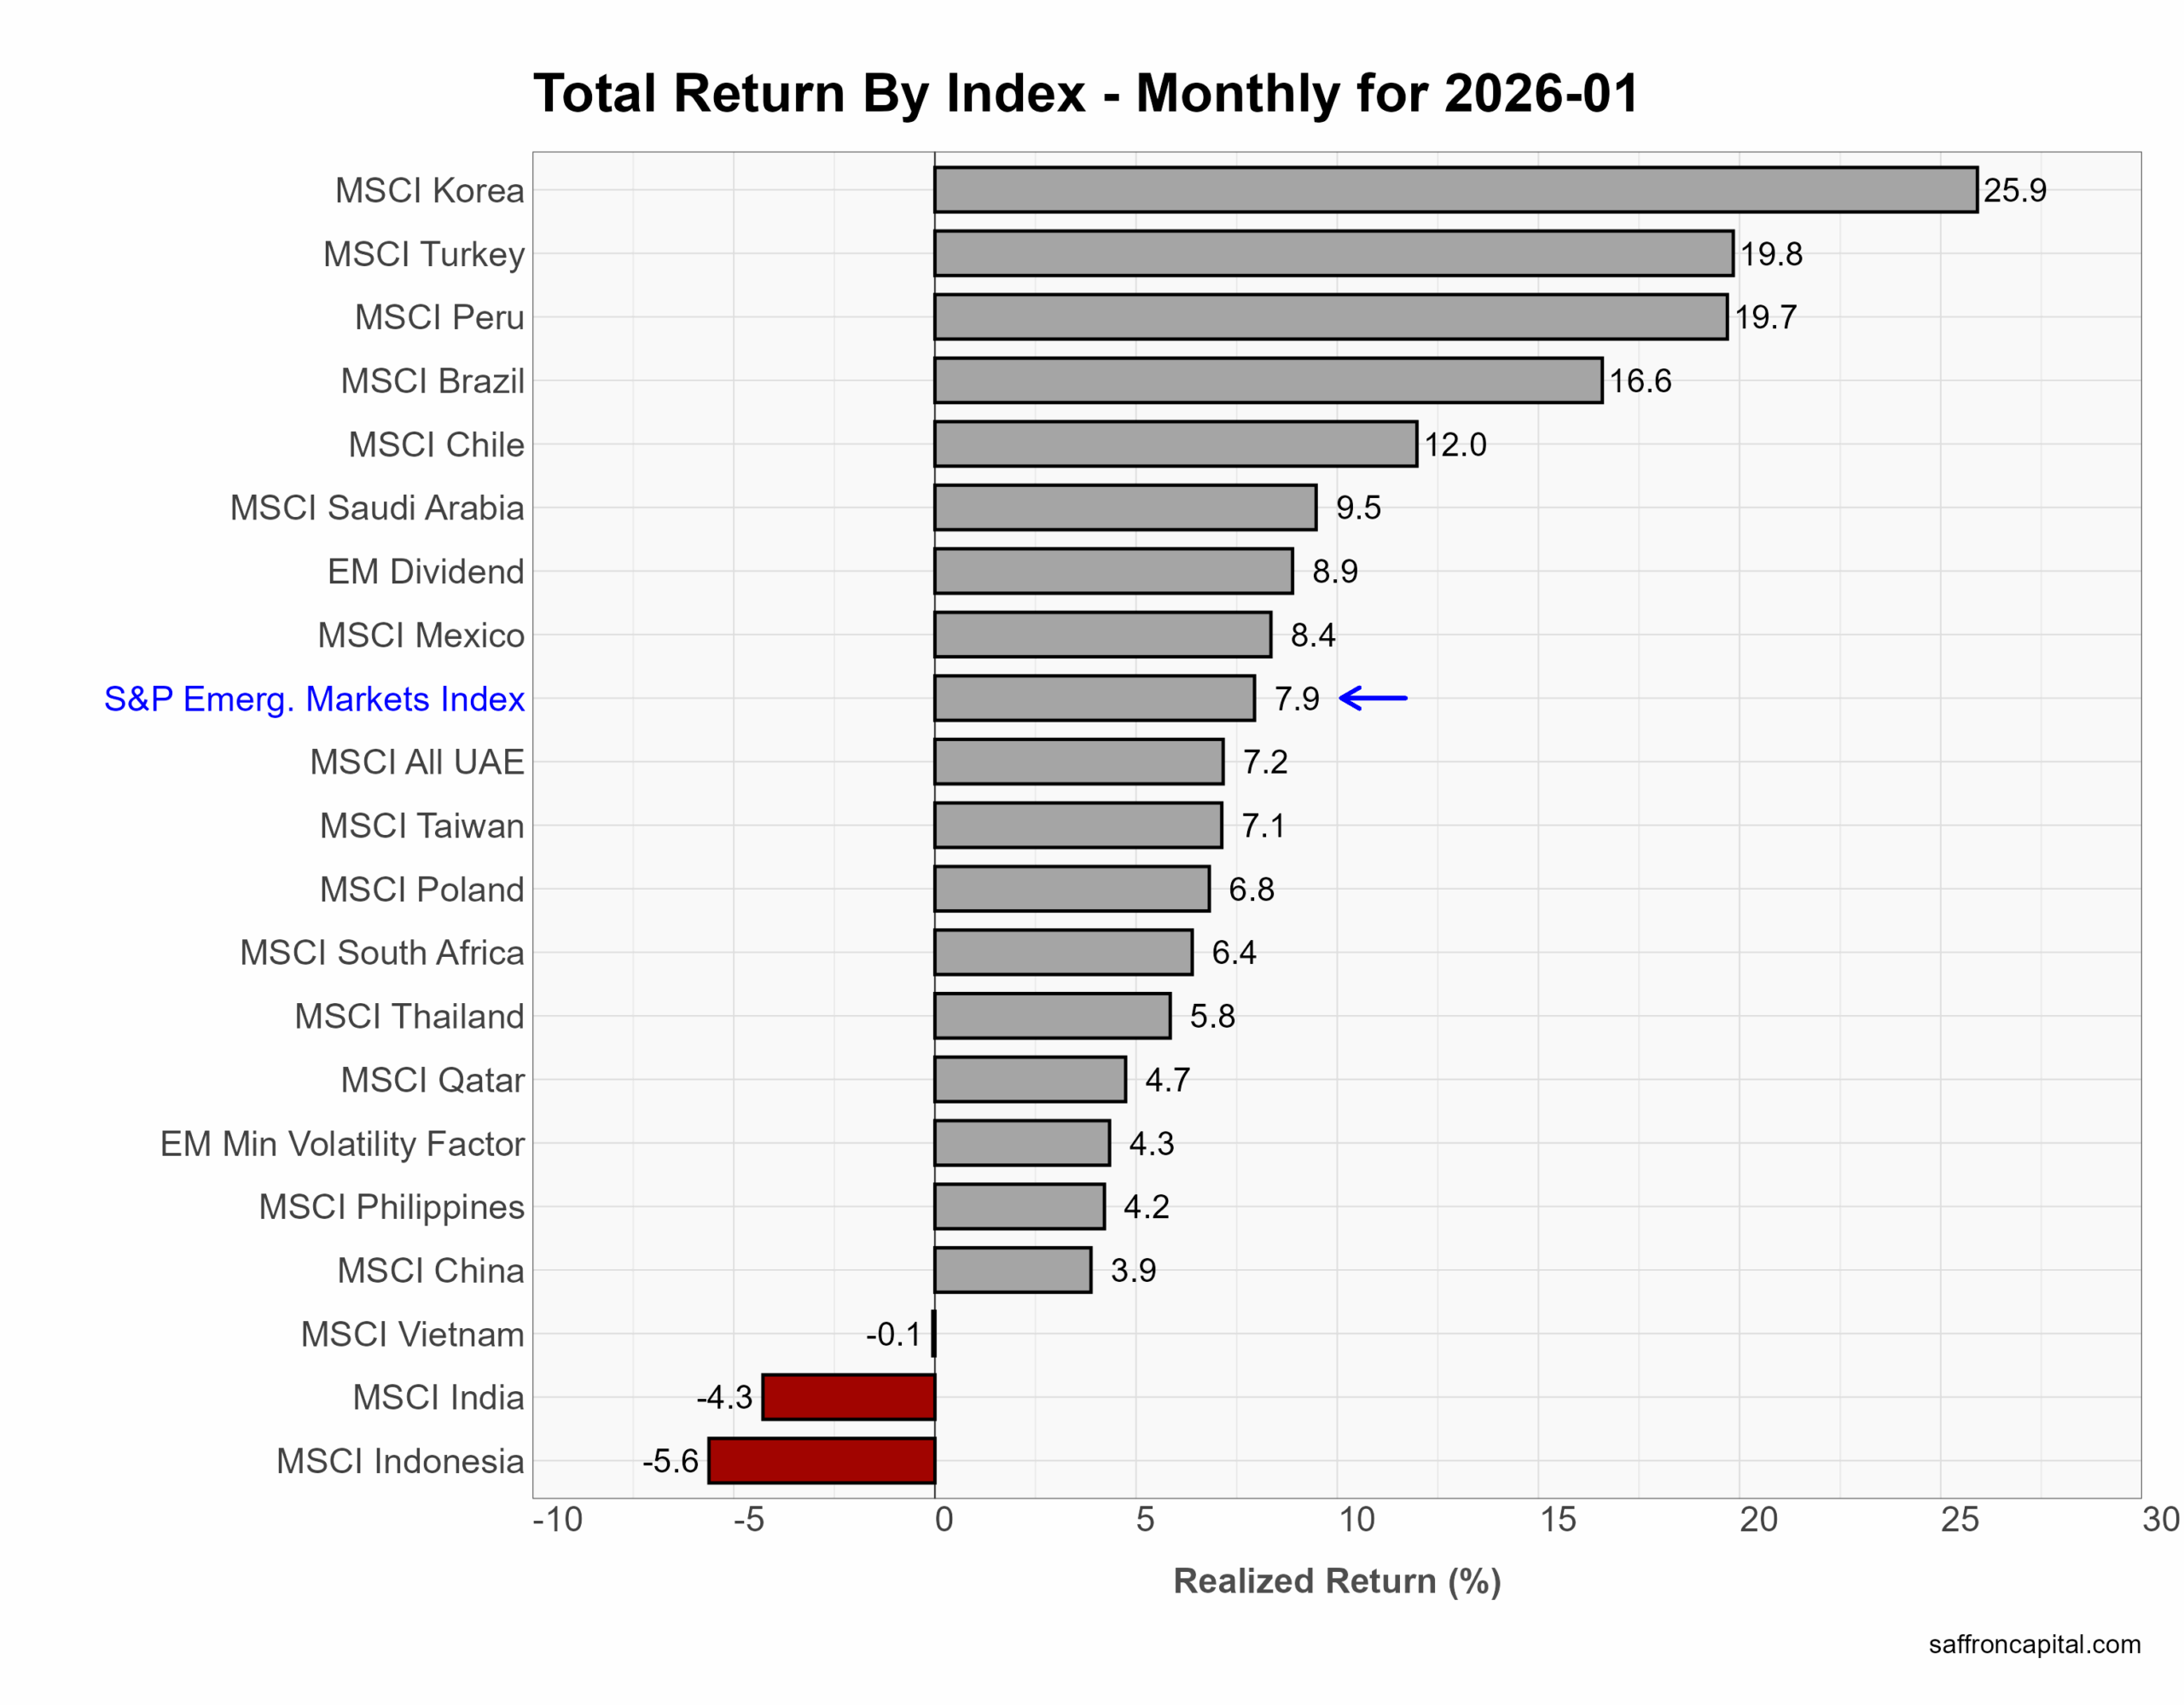
Emerging Market Equities
Emerging market equities start 2026 with solid gains, supported by improving global growth expectations and a more stable interest-rate backdrop. Hong Kong (+10.0%) and Norway (+10.0%) led the group, reflecting heavy index exposure to Financials, Energy, and Materials, which were among the strongest global sectors during the month. The Netherlands (+9.2%) and Israel (+8.1%) also performed well, supported by Technology, Industrials, and defense-related companies. Broad European markets delivered solid but more moderate gains, with Europe up +4.0% overall, while Germany (+1.4%) and France (+0.8%) lagged due to weaker performance in Industrials and Consumer sectors. The S&P Developed Markets Index rose +4.6%, significantly outperforming the S&P 500 (+1.4%). Early 2026 continues the 2025 pattern of stronger returns outside the U.S., driven by sector mix and broader market participation rather than U.S. mega-cap concentration.
Click to enlarge
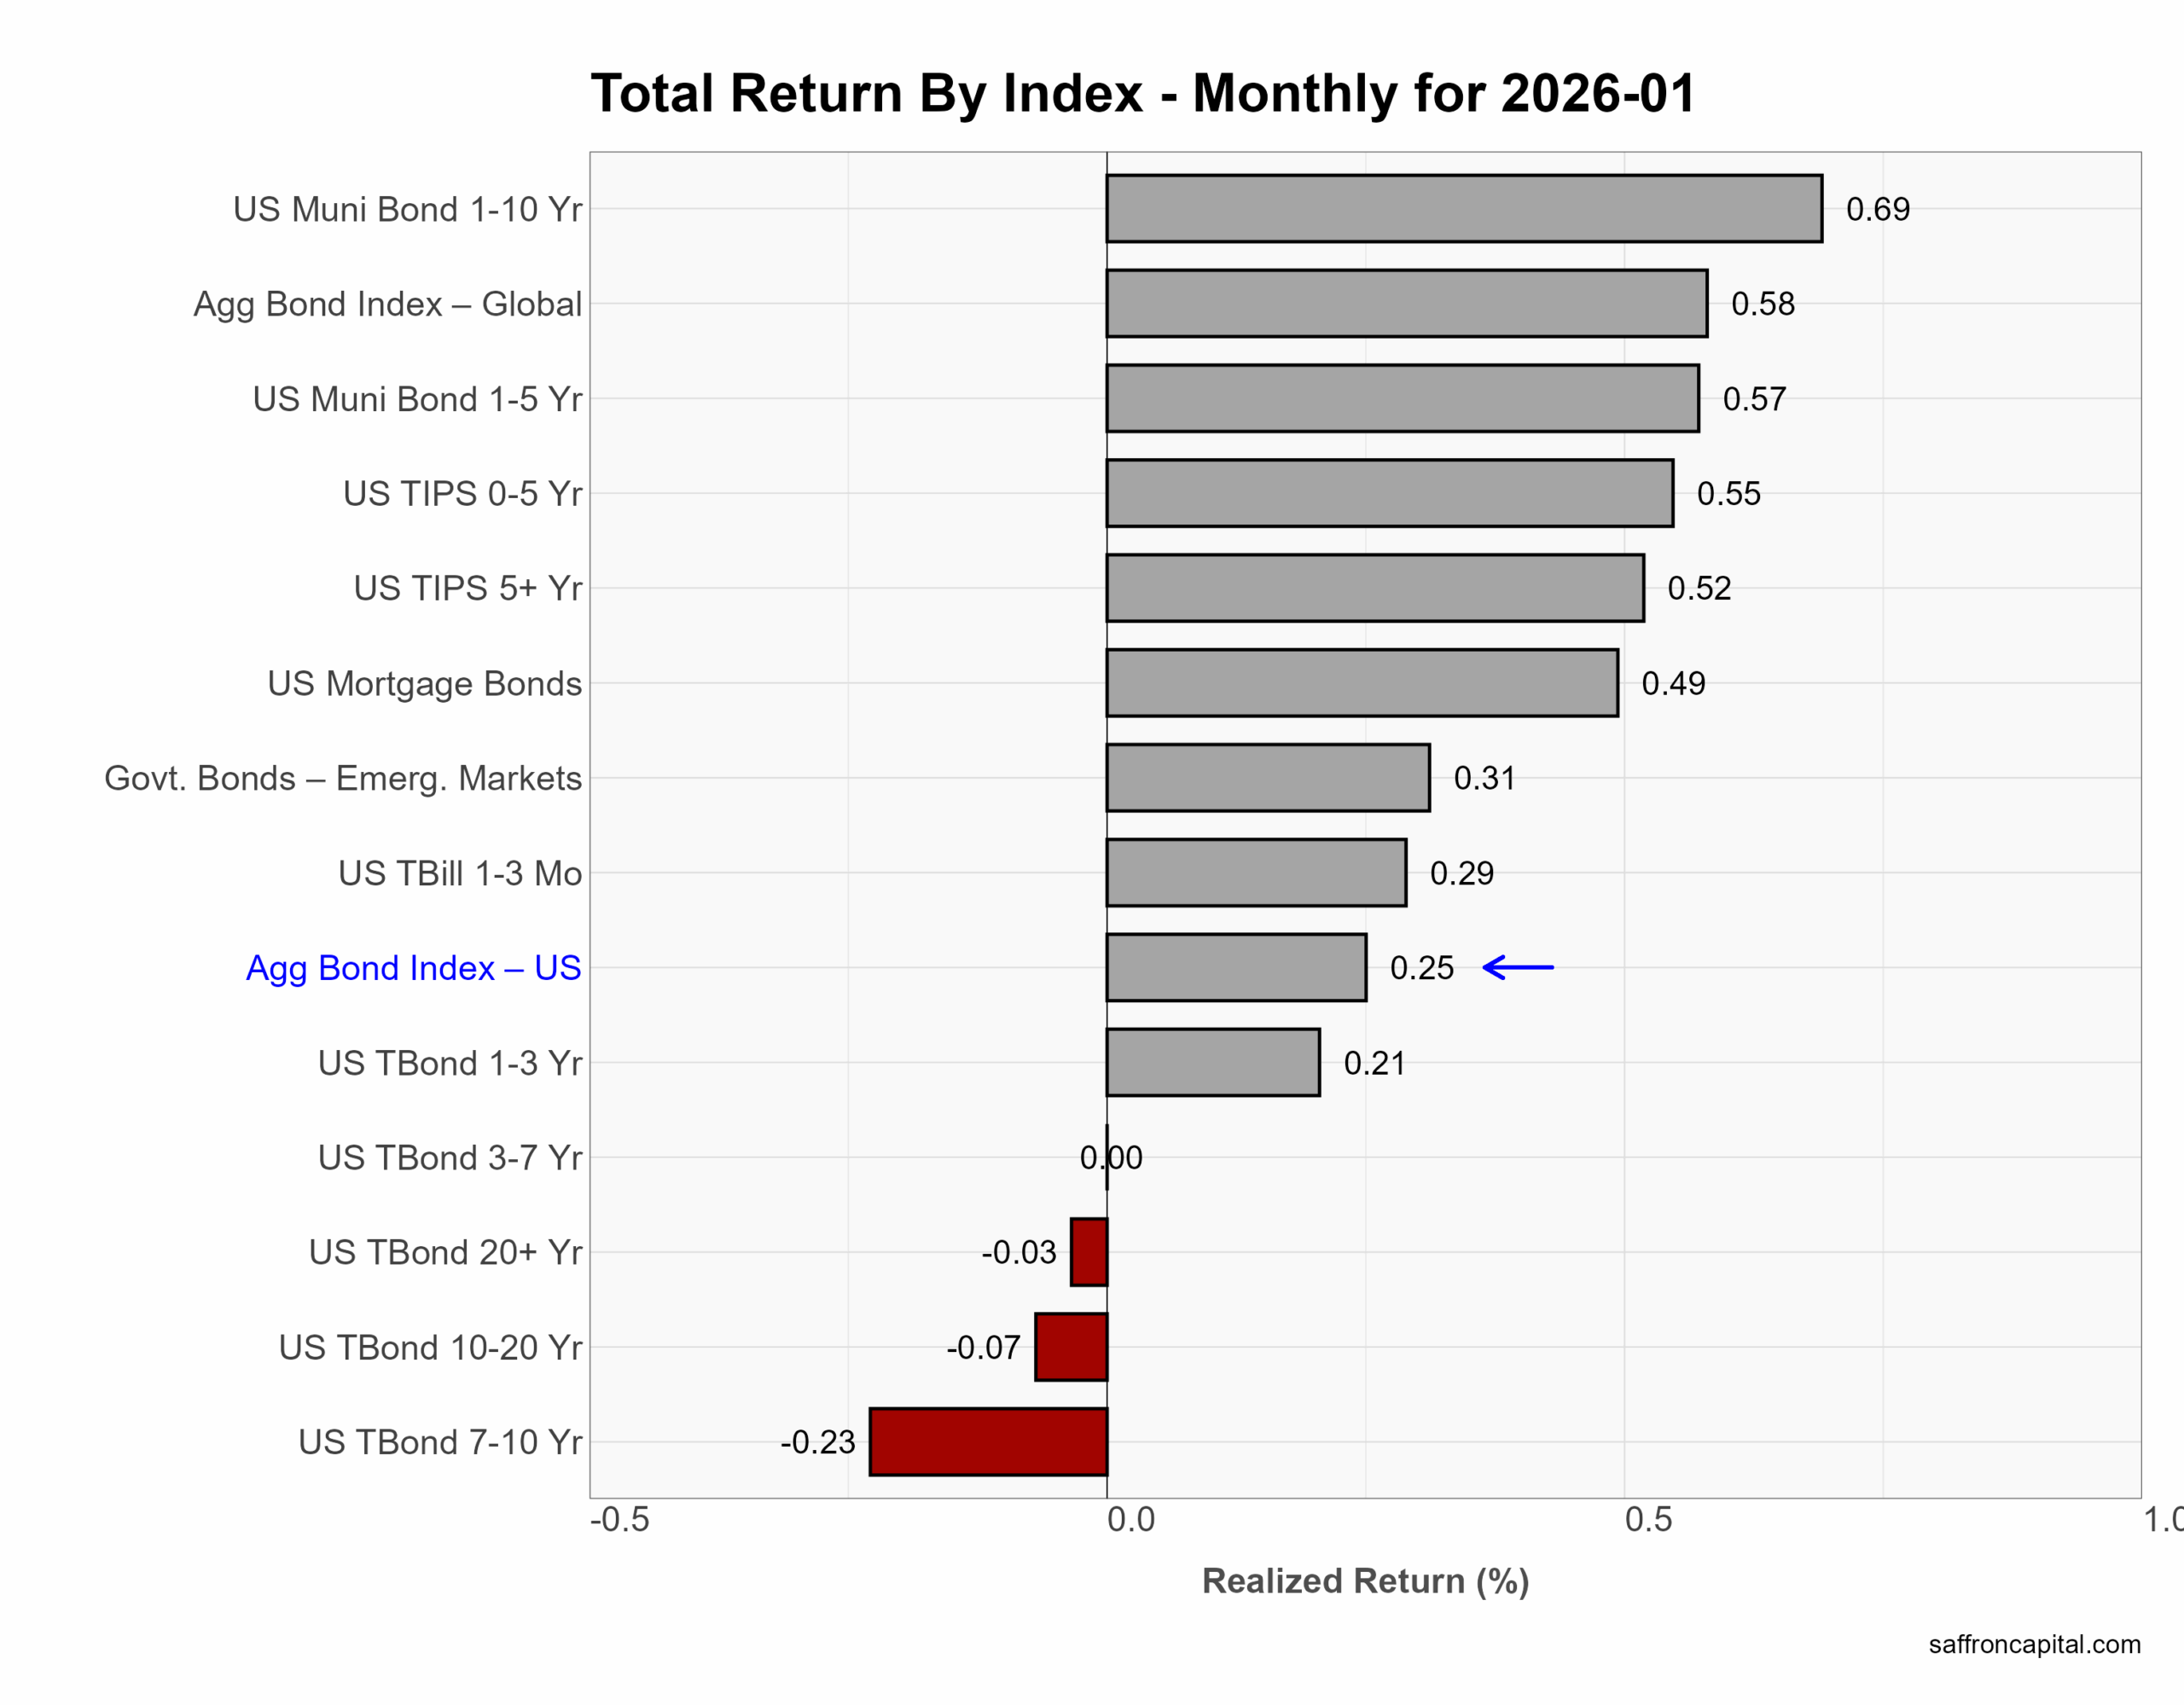
Government Bonds
January returns for government bond were driven by yield-curve positioning, with the front end outperforming longer maturities. The US Aggregate Bond Index rose +0.25%, supported by gains in short-duration and spread sectors. Municipal bonds led performance, with 1–10Y munis up +0.69% and 1–5Y munis up +0.57%, reflecting shorter duration and attractive tax-adjusted yields. TIPS posted solid gains across maturities, with 0–5Y TIPS up +0.55% and 5Y+ TIPS up +0.52%, consistent with stable real yields and ongoing demand for inflation protection. Longer-dated Treasuries lagged, with 7–10Y Treasuries down −0.23%, 10–20Y Treasuries down −0.07%, and 20Y+ Treasuries slightly negative at −0.03%. January results continue to favor short- and intermediate-term bonds for income with lower duration risk.
Click to enlarge
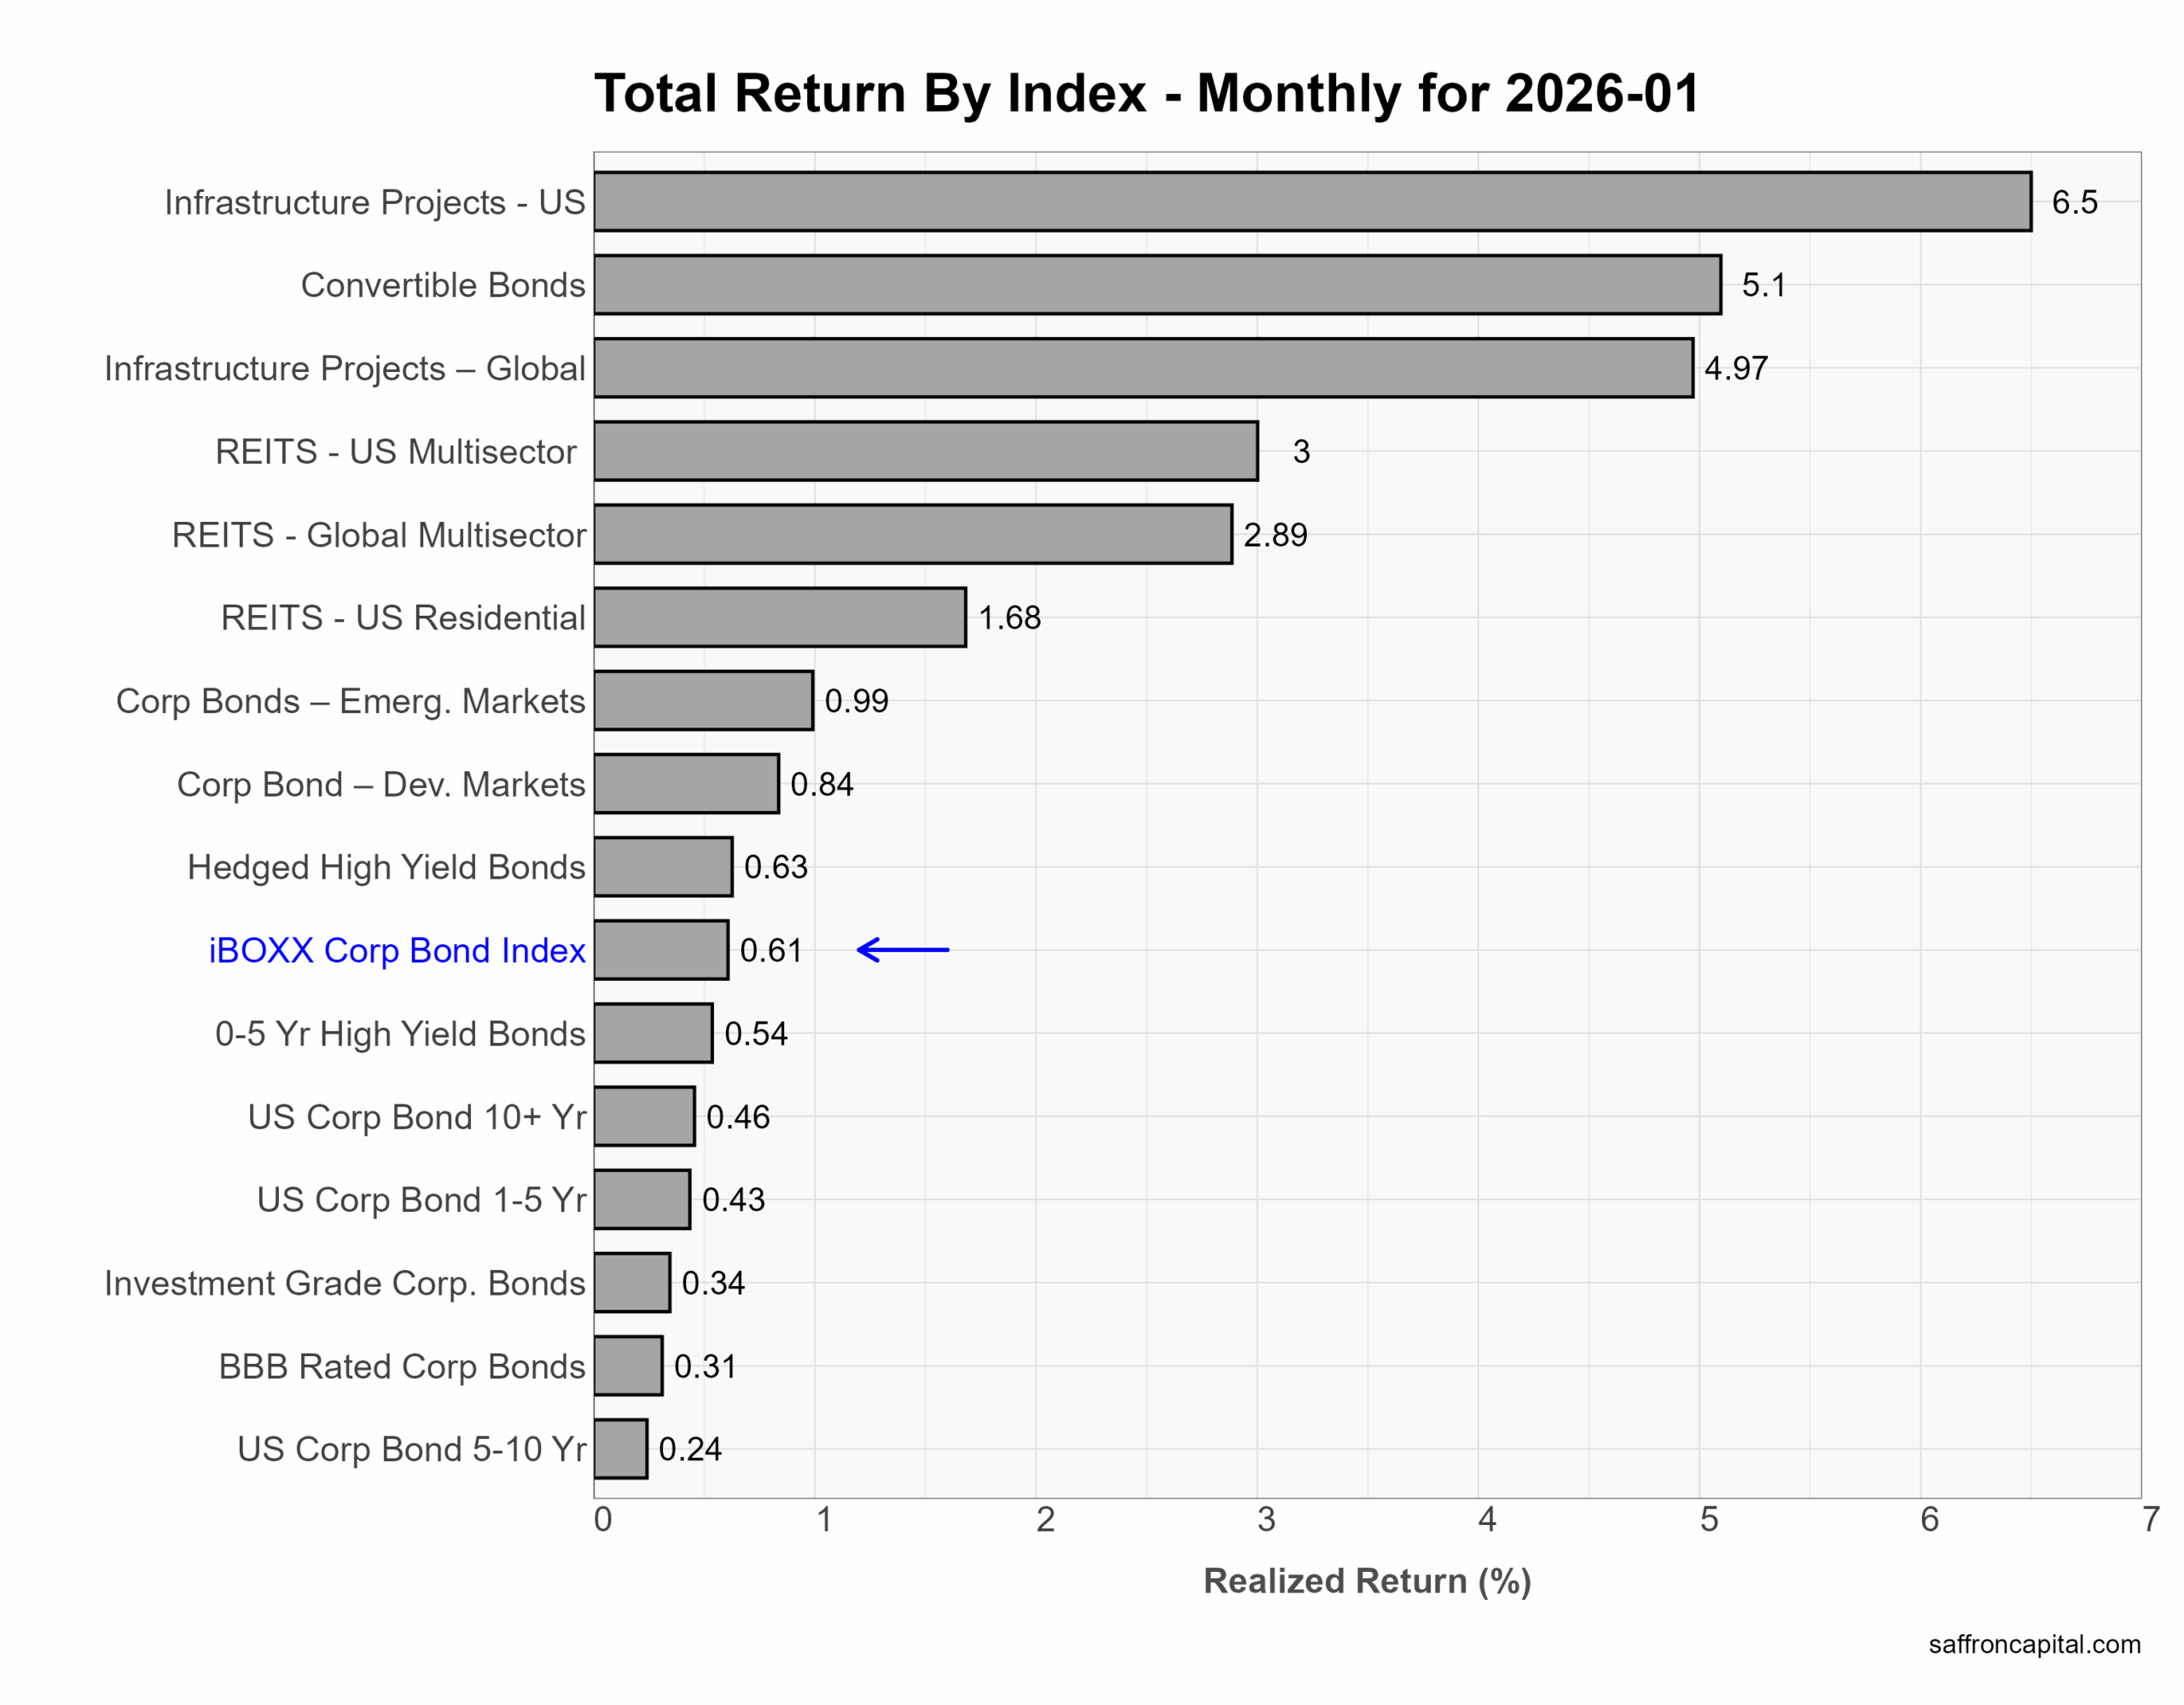
Corporate & Infrastructure Bonds
In January, credit and real-asset sectors delivered returns well above traditional corporate bonds. Infrastructure Project Bonds led performance, with U.S. projects up +6.5% and global projects up +5.0%, reflecting their linkage to long-term contracted cash flows and equity-like sensitivity during a strong risk-asset month. Convertible Bonds rose +5.1%, benefiting directly from rising equity prices while still carrying bond income characteristics. REITs also performed well, with U.S. multisector REITs up +3.0% and global REITs up +2.9%, rebounding alongside improving equity sentiment and stable financing conditions. By comparison, the iBOXX Corporate Bond Index gained just +0.61%, constrained by higher duration exposure and limited spread compression. January results highlight that hybrid and real-asset credit sectors can materially outperform traditional corporate bonds during periods of improving risk appetite, though they carry higher volatility and equity sensitivity.
Click to enlarge
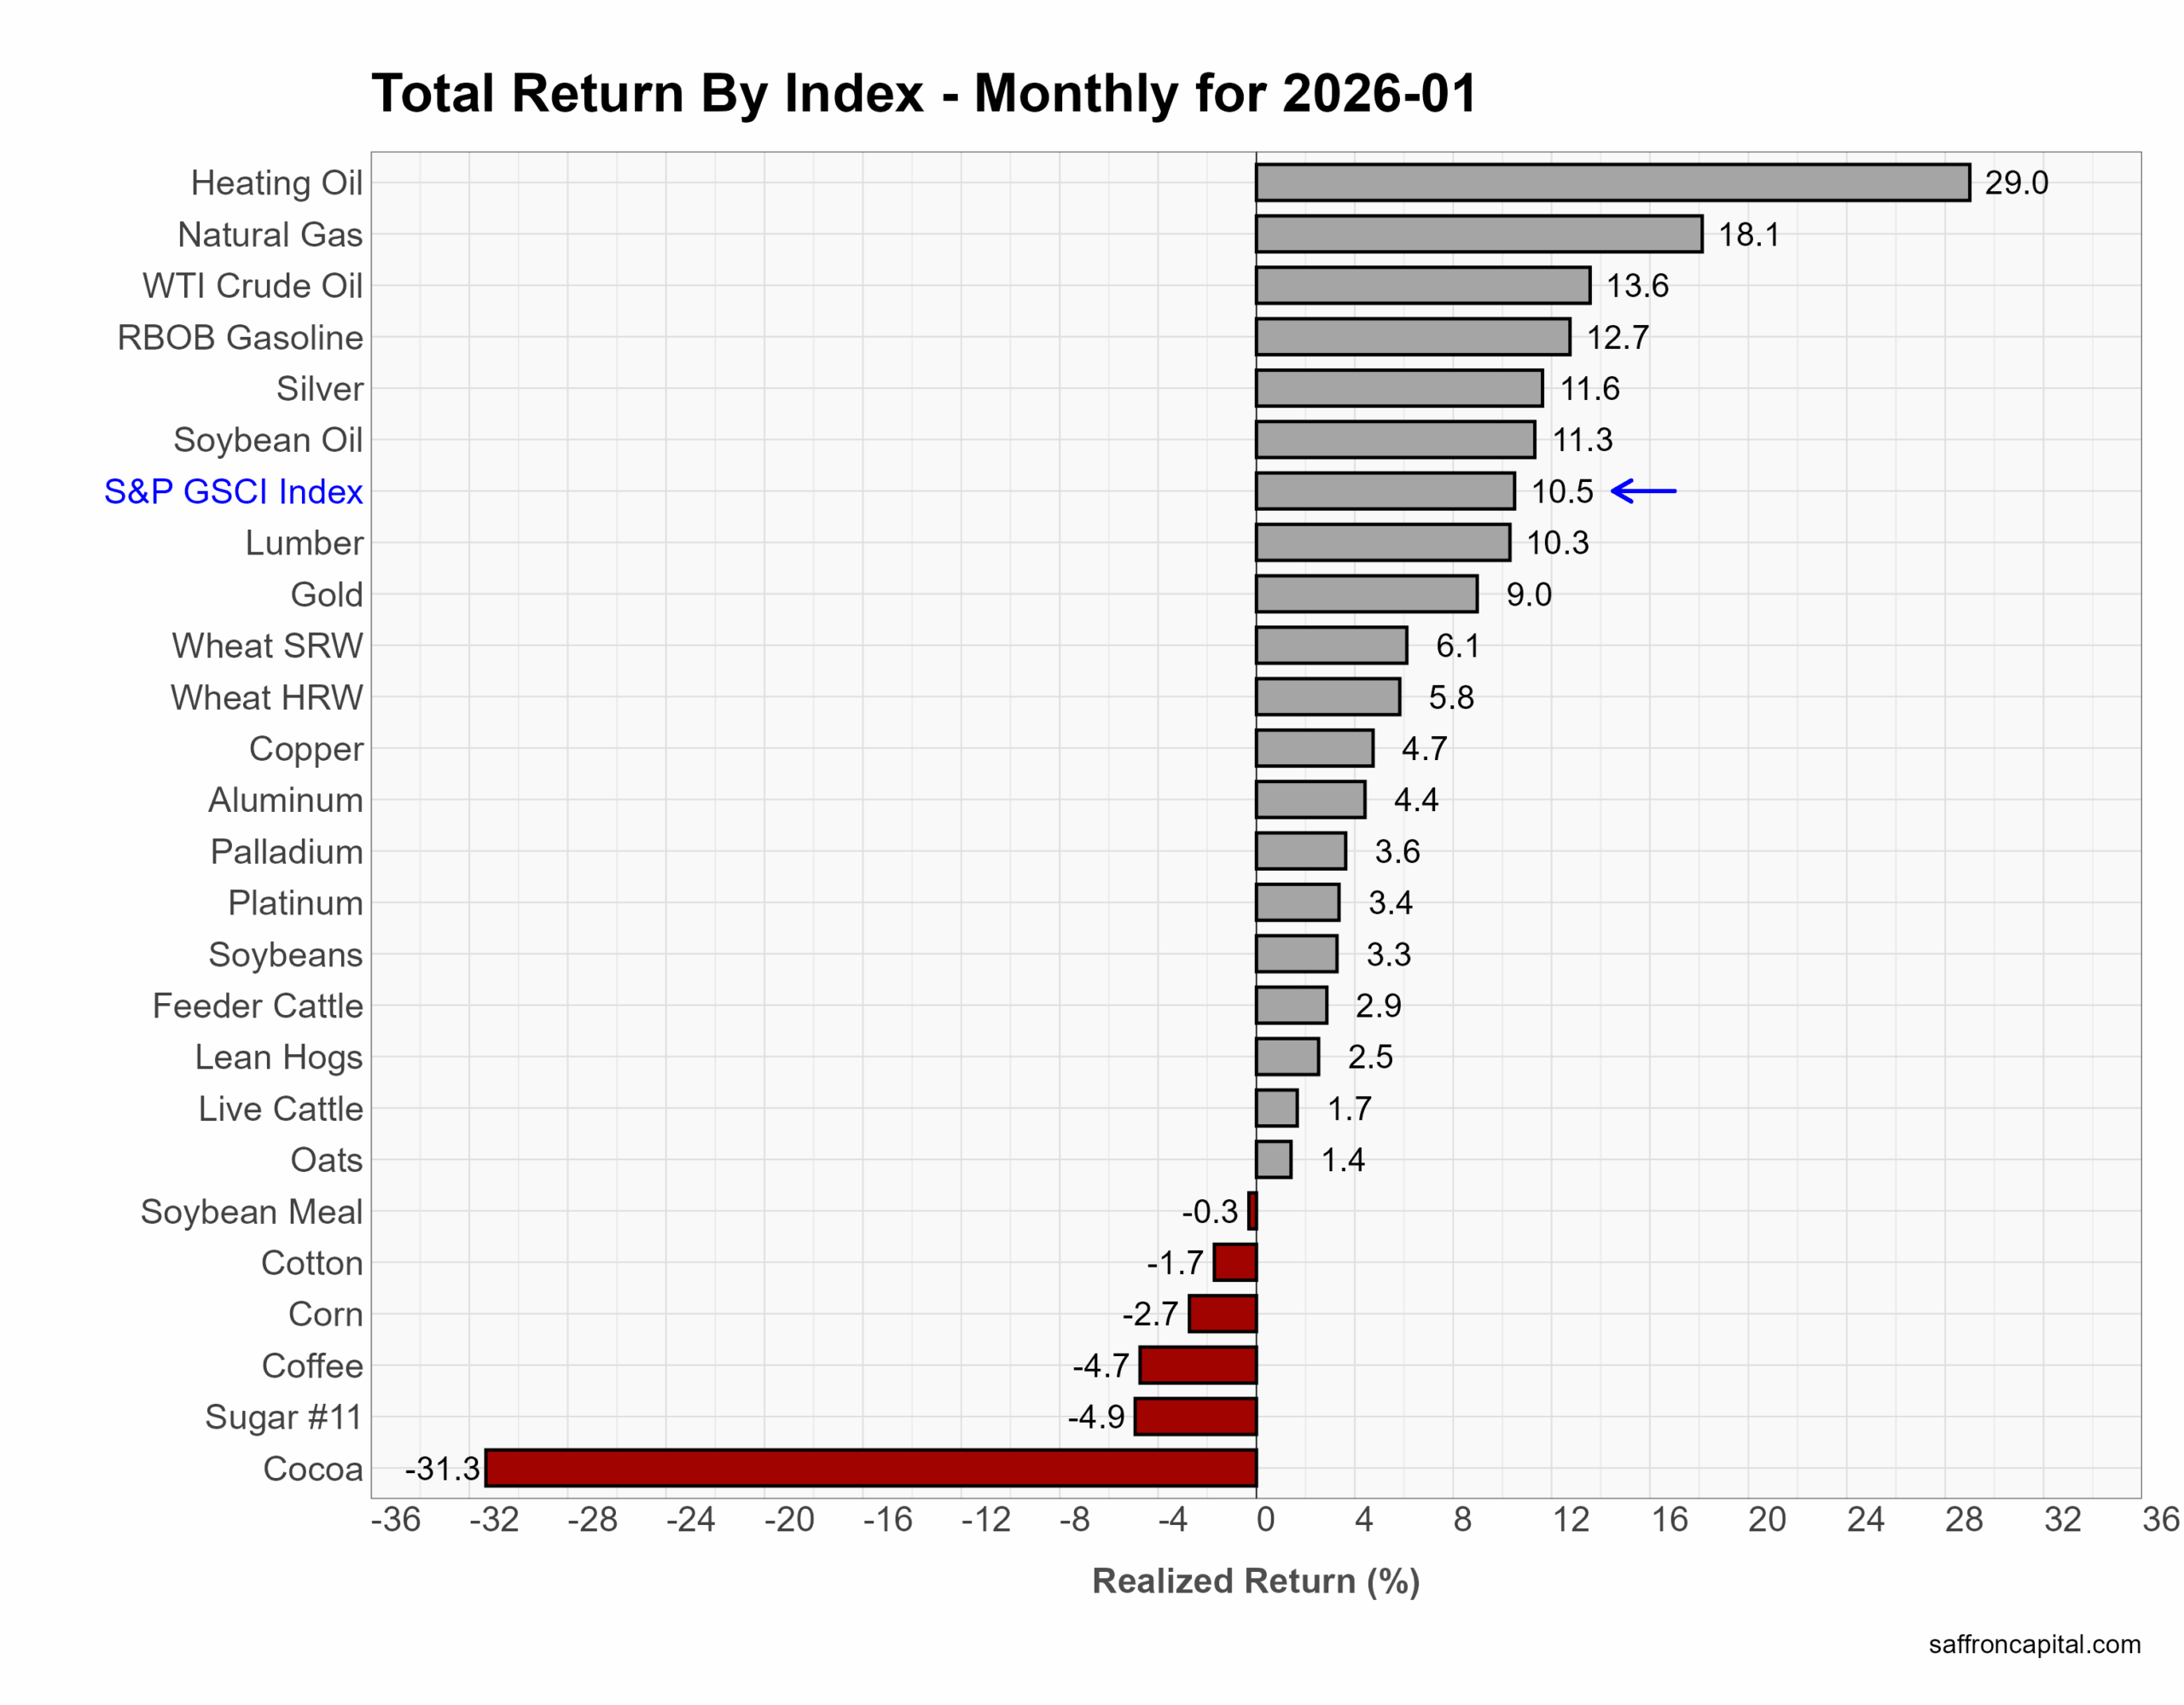
Commodities
Commodity markets posted broad gains in January, with the S&P GSCI Index rising +10.5%, driven primarily by energy strength. For example, Heating oil (+29.0%), natural gas (+18.1%), WTI crude oil (+13.6%), and gasoline (+12.7%) led the complex, reflecting tight inventories and seasonal demand. Precious and industrial metals also advanced, with silver (+11.6%), gold (+9.0%), copper (+4.7%), and aluminum (+4.4%) contributing to upside momentum. Agricultural results were mixed: wheat posted moderate gains (6.1%), while corn (−2.7%), coffee (−4.7%), sugar (−4.9%), and cocoa (−31.3%) declined sharply following prior supply-driven rallies. January performance suggests traders remain positioned toward energy and metals, while agricultural commodities appear more vulnerable.
Click to enlarge
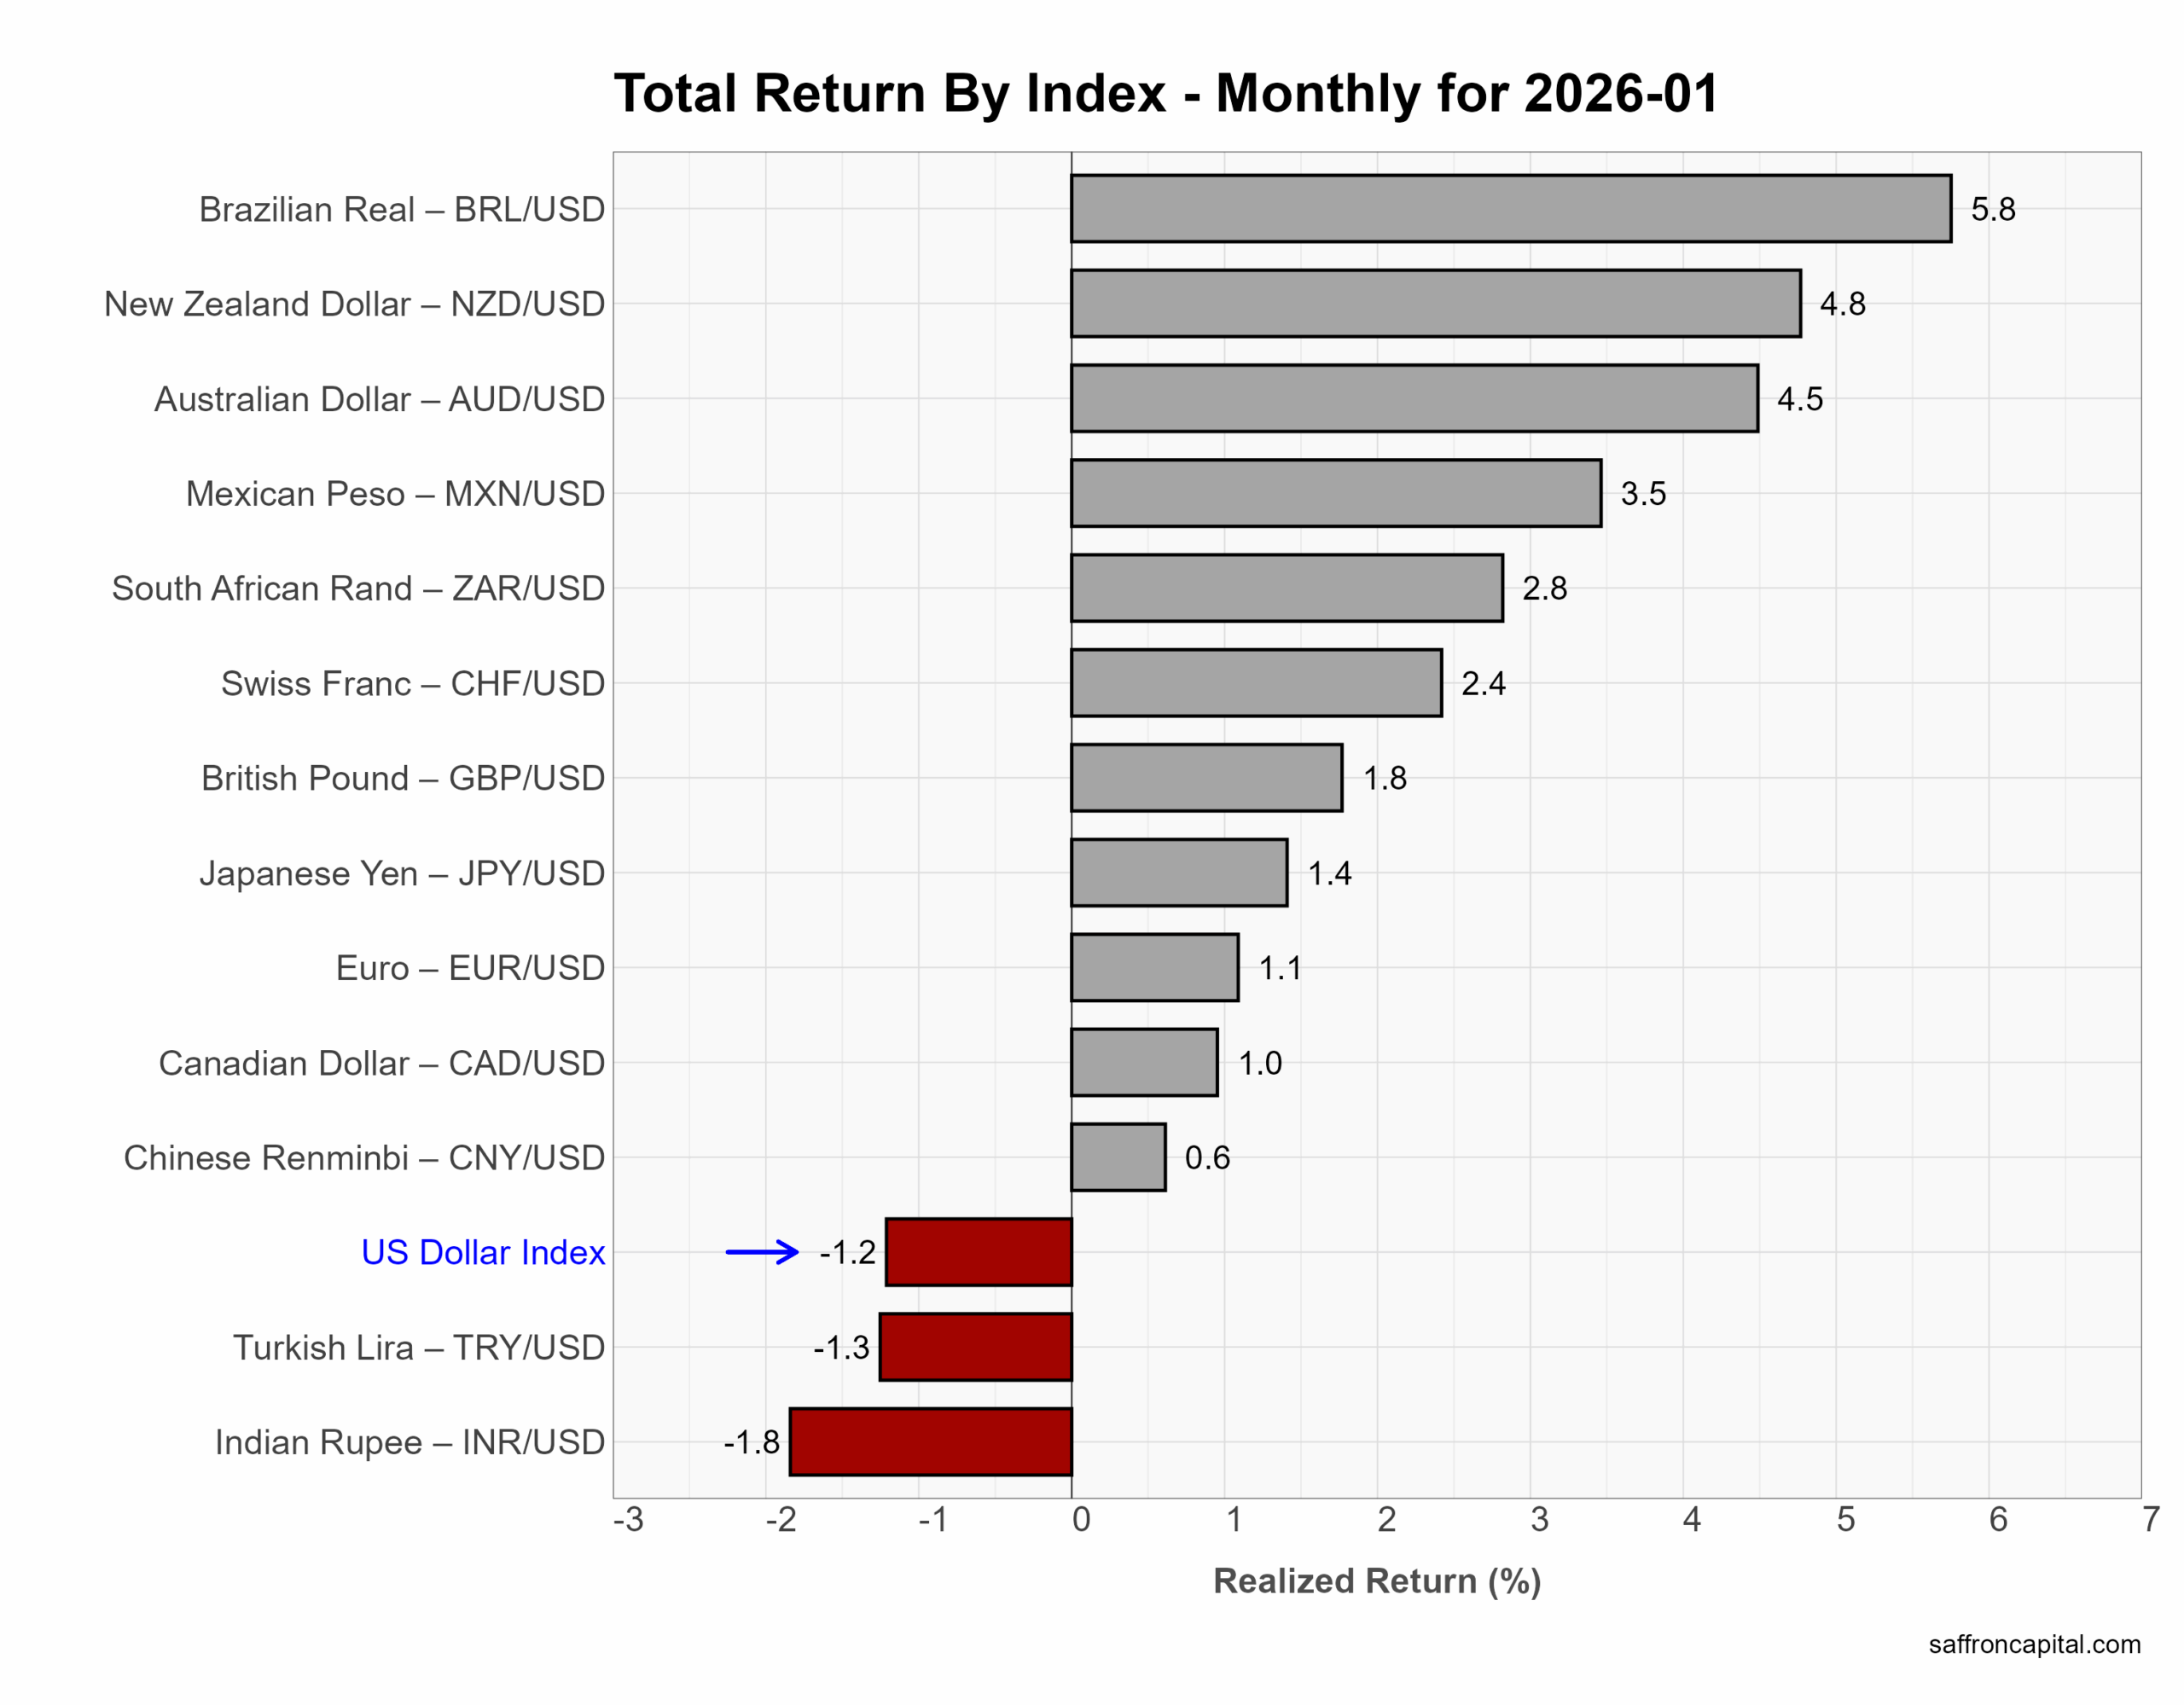
Currencies
Currency markets in January reflected broad U.S. dollar weakness, with the U.S. Dollar Index down −1.2%. Commodity-linked currencies led gains, including the Brazilian real (+5.8%), New Zealand dollar (+4.8%), and Australian dollar (+4.5%), moving higher alongside strong commodity prices. The Mexican peso (+3.5%) and South African rand (+2.8%) also benefited from improved risk sentiment. Major developed currencies posted modest gains, with the euro (+1.1%), yen (+1.4%), and pound (+1.8%) all strengthening versus the dollar. In contrast, the Indian rupee (−1.8%) and Turkish lira (−1.3%) lagged due to country-specific policy and inflation pressures.
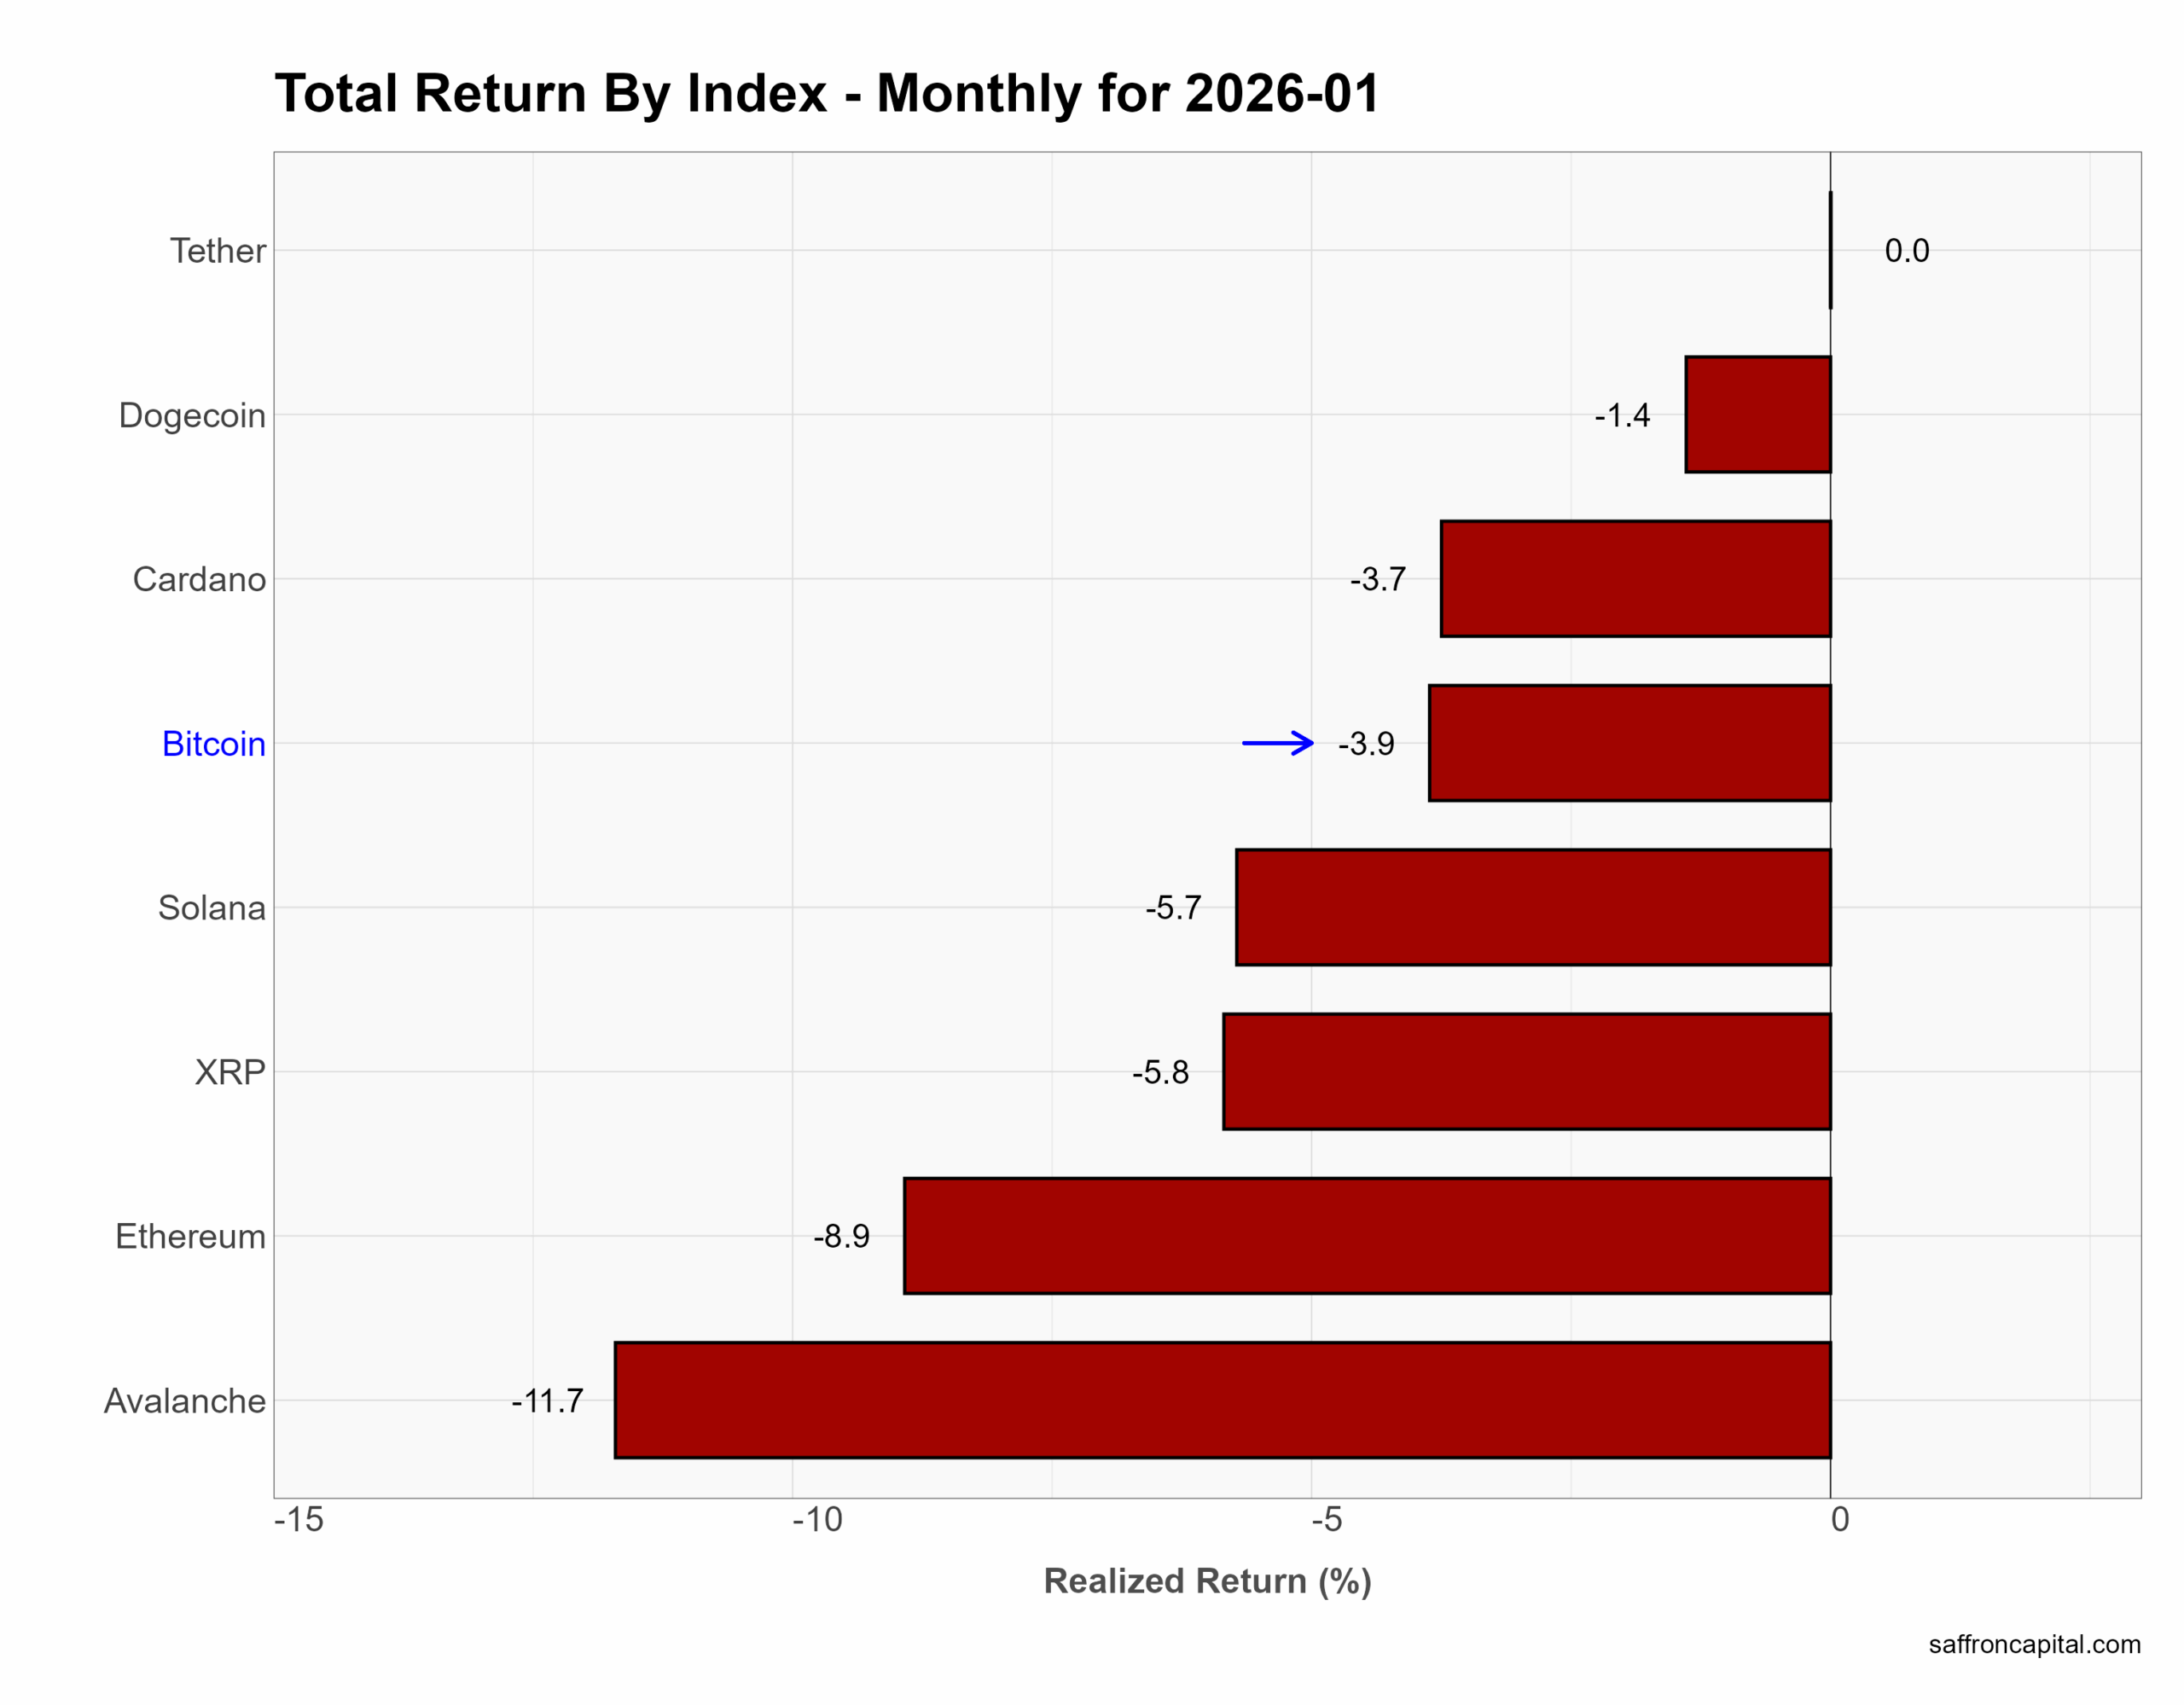
Cryptocurrencies
Crypto markets broadly declined in January, with losses concentrated in higher-beta tokens. Bitcoin fell −3.9%, while Ethereum dropped −8.9%, and larger drawdowns hit Avalanche (−11.7%), Solana (−5.7%), and XRP (−5.8%), reflecting a pullback after strong prior gains. Market data show profit-taking across altcoins and reduced risk appetite, with capital rotating out of more volatile projects first. Stablecoins such as Tether were unchanged, underscoring the defensive shift. January price action suggests investors favored liquidity and caution, with speculative crypto assets lagging as volatility rose and momentum cooled.
Click to enlarge
Have questions or concerns about the performance of your portfolio? Could you benefit from a capital preservation strategy or a custom portfolio formulation that better aligns to your return goals and risk appetite? Whatever your needs, we are here to listen and to help. Contact us here.
Saffron Capital LLC is a registered investment advisor that provides guided growth and risk-managed portfolios. The company is employee-owned and Minnesota-based.


