February returns delivered a sharp rotation across global markets. First, U.S. large caps struggled as hotter producer prices and rising scrutiny of AI capex hit sentiment. The S&P 500 fell -0.9%, while the NASDAQ-100 lost -2.3%. However, investors rotated into smaller stocks where the S&P 400 gained +4.1% and the S&P 600 rose +2.1%. Meanwhile, leadership also turned defensive. Utilities jumped +10.4%, and Energy and Materials beat the tape, while Technology and Financials lagged. Abroad, developed markets outperformed the US. For example, MSCI Norway rose +8.8%, and the S&P Developed Markets Index gained +5.0%. In emerging markets, Korea surged +23.7% and Thailand rallied +18.8%, lifting the S&P EM Index +5.8%.
The following analysis is a visual summary of monthly and annual returns by asset group. The aim is to help investors to benchmark portfolio returns and to see emerging trends across markets.
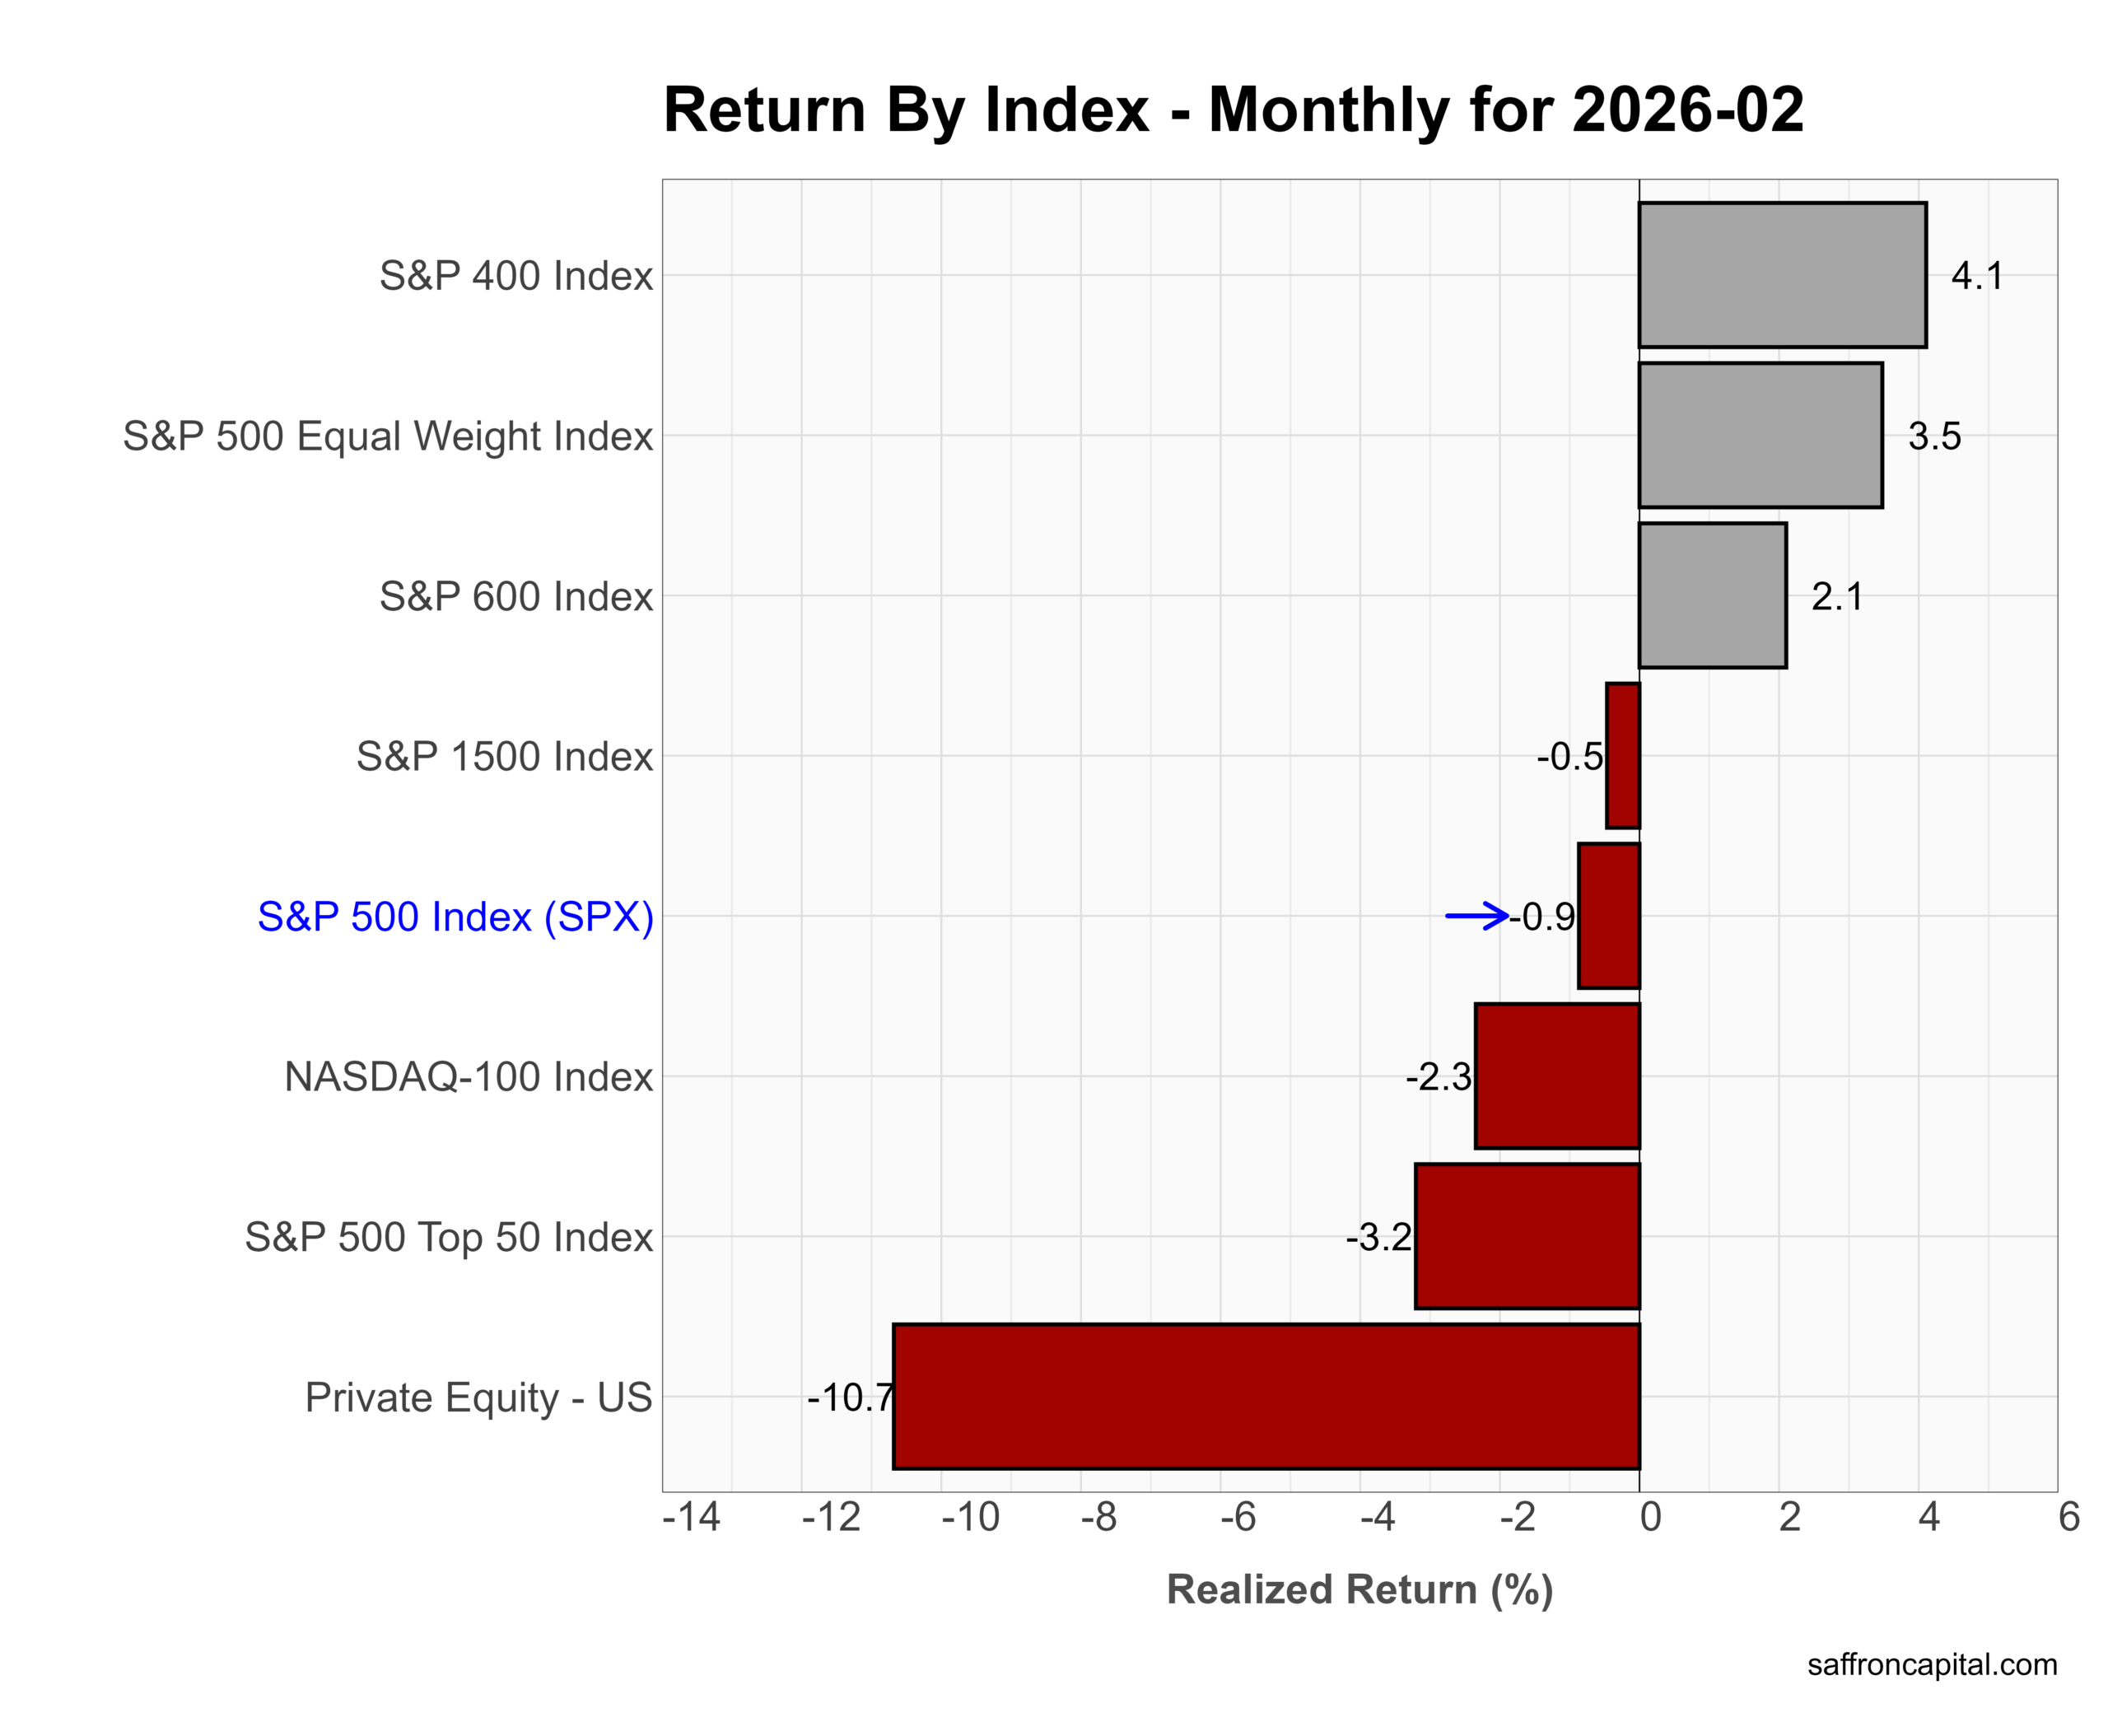
Core US Indices
In February, market leadership flipped. First, mega caps sold off as AI enthusiasm cooled and higher producer prices pressured rate-cut hopes. The NASDAQ-100 fell 2.3%, and the S&P 500 Top 50 dropped 3.2%. Meanwhile, the S&P 500 slipped 0.9%. However, investors rotated into breadth. The S&P 400 gained 4.1%, and the S&P 600 rose 2.1%. The Equal Weight S&P 500 advanced 3.5%, which signals improving participation beyond Big Tech. In contrast, private equity fell 10.7%, reflecting tighter liquidity and valuation resets.
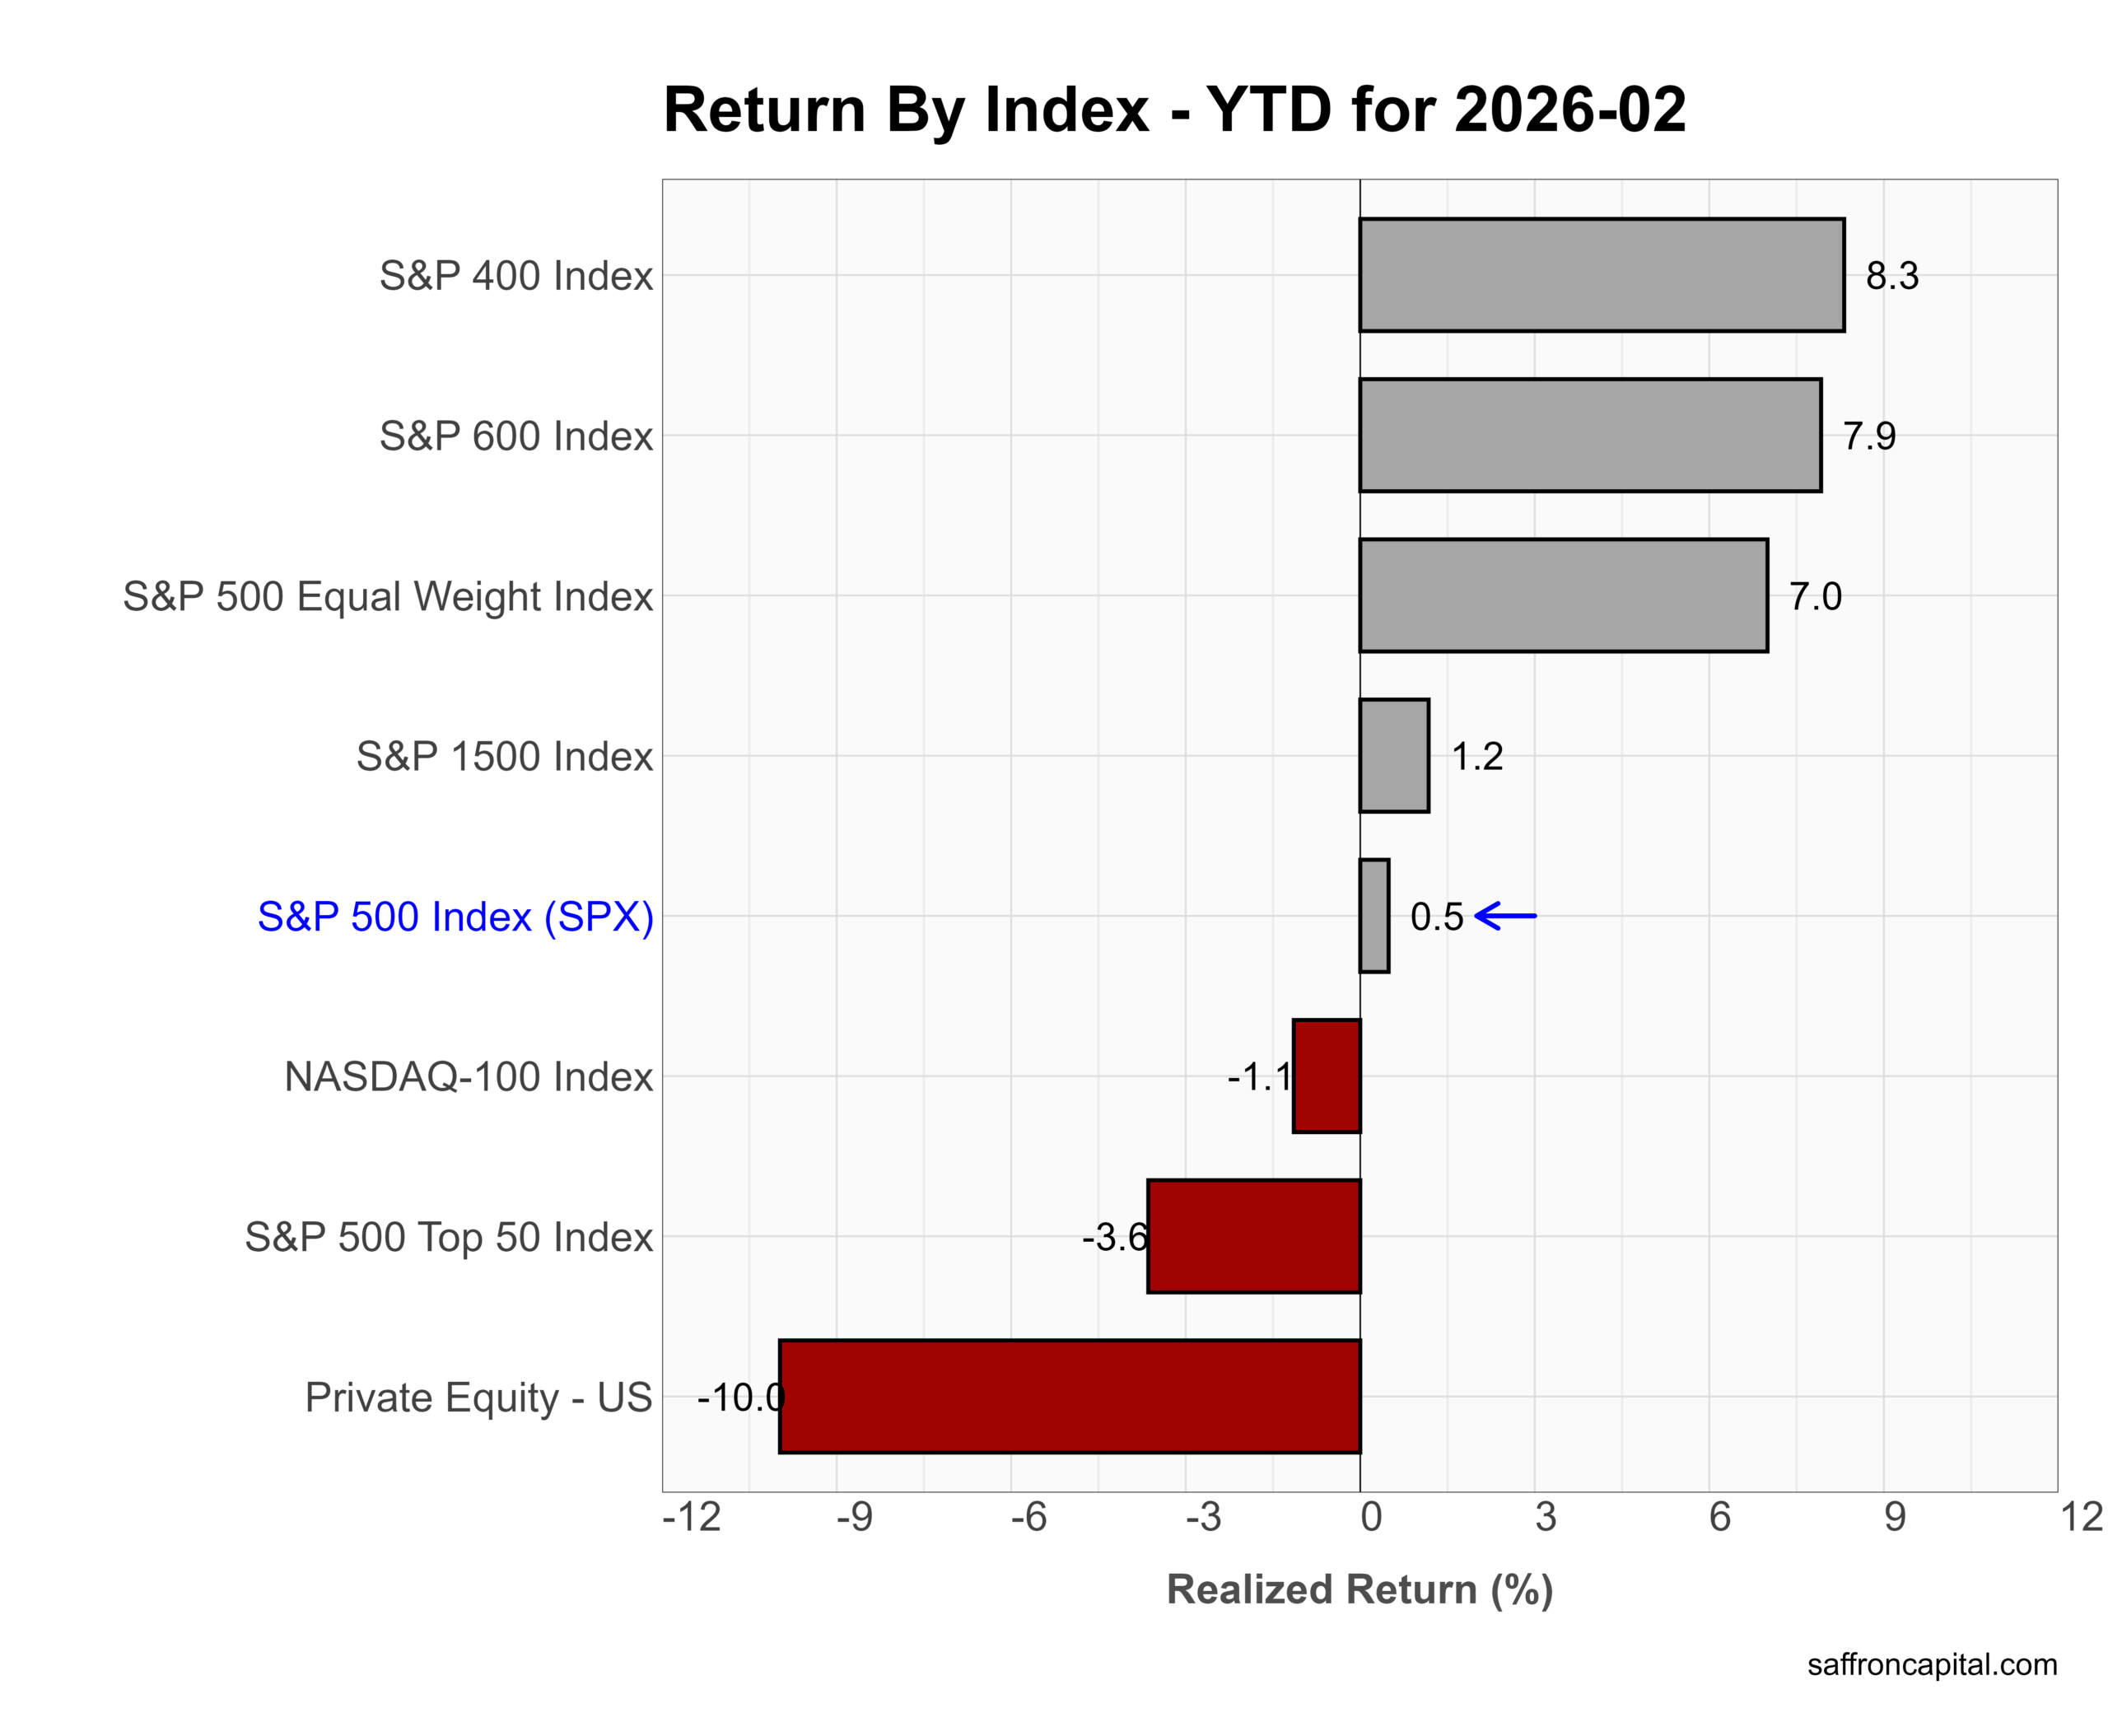
Year to date, the tone looks different. Small and mid caps lead, with the S&P 400 up 8.3% and the S&P 600 up 7.9%. The Equal Weight S&P 500 gained 7.0%, while the cap-weighted S&P 500 sits at just 0.5%. Meanwhile, the NASDAQ-100 remains down 1.1%. Overall, February confirms a shift from concentration risk toward broader U.S. equity leadership.
Click to enlarge
US Sector Indices
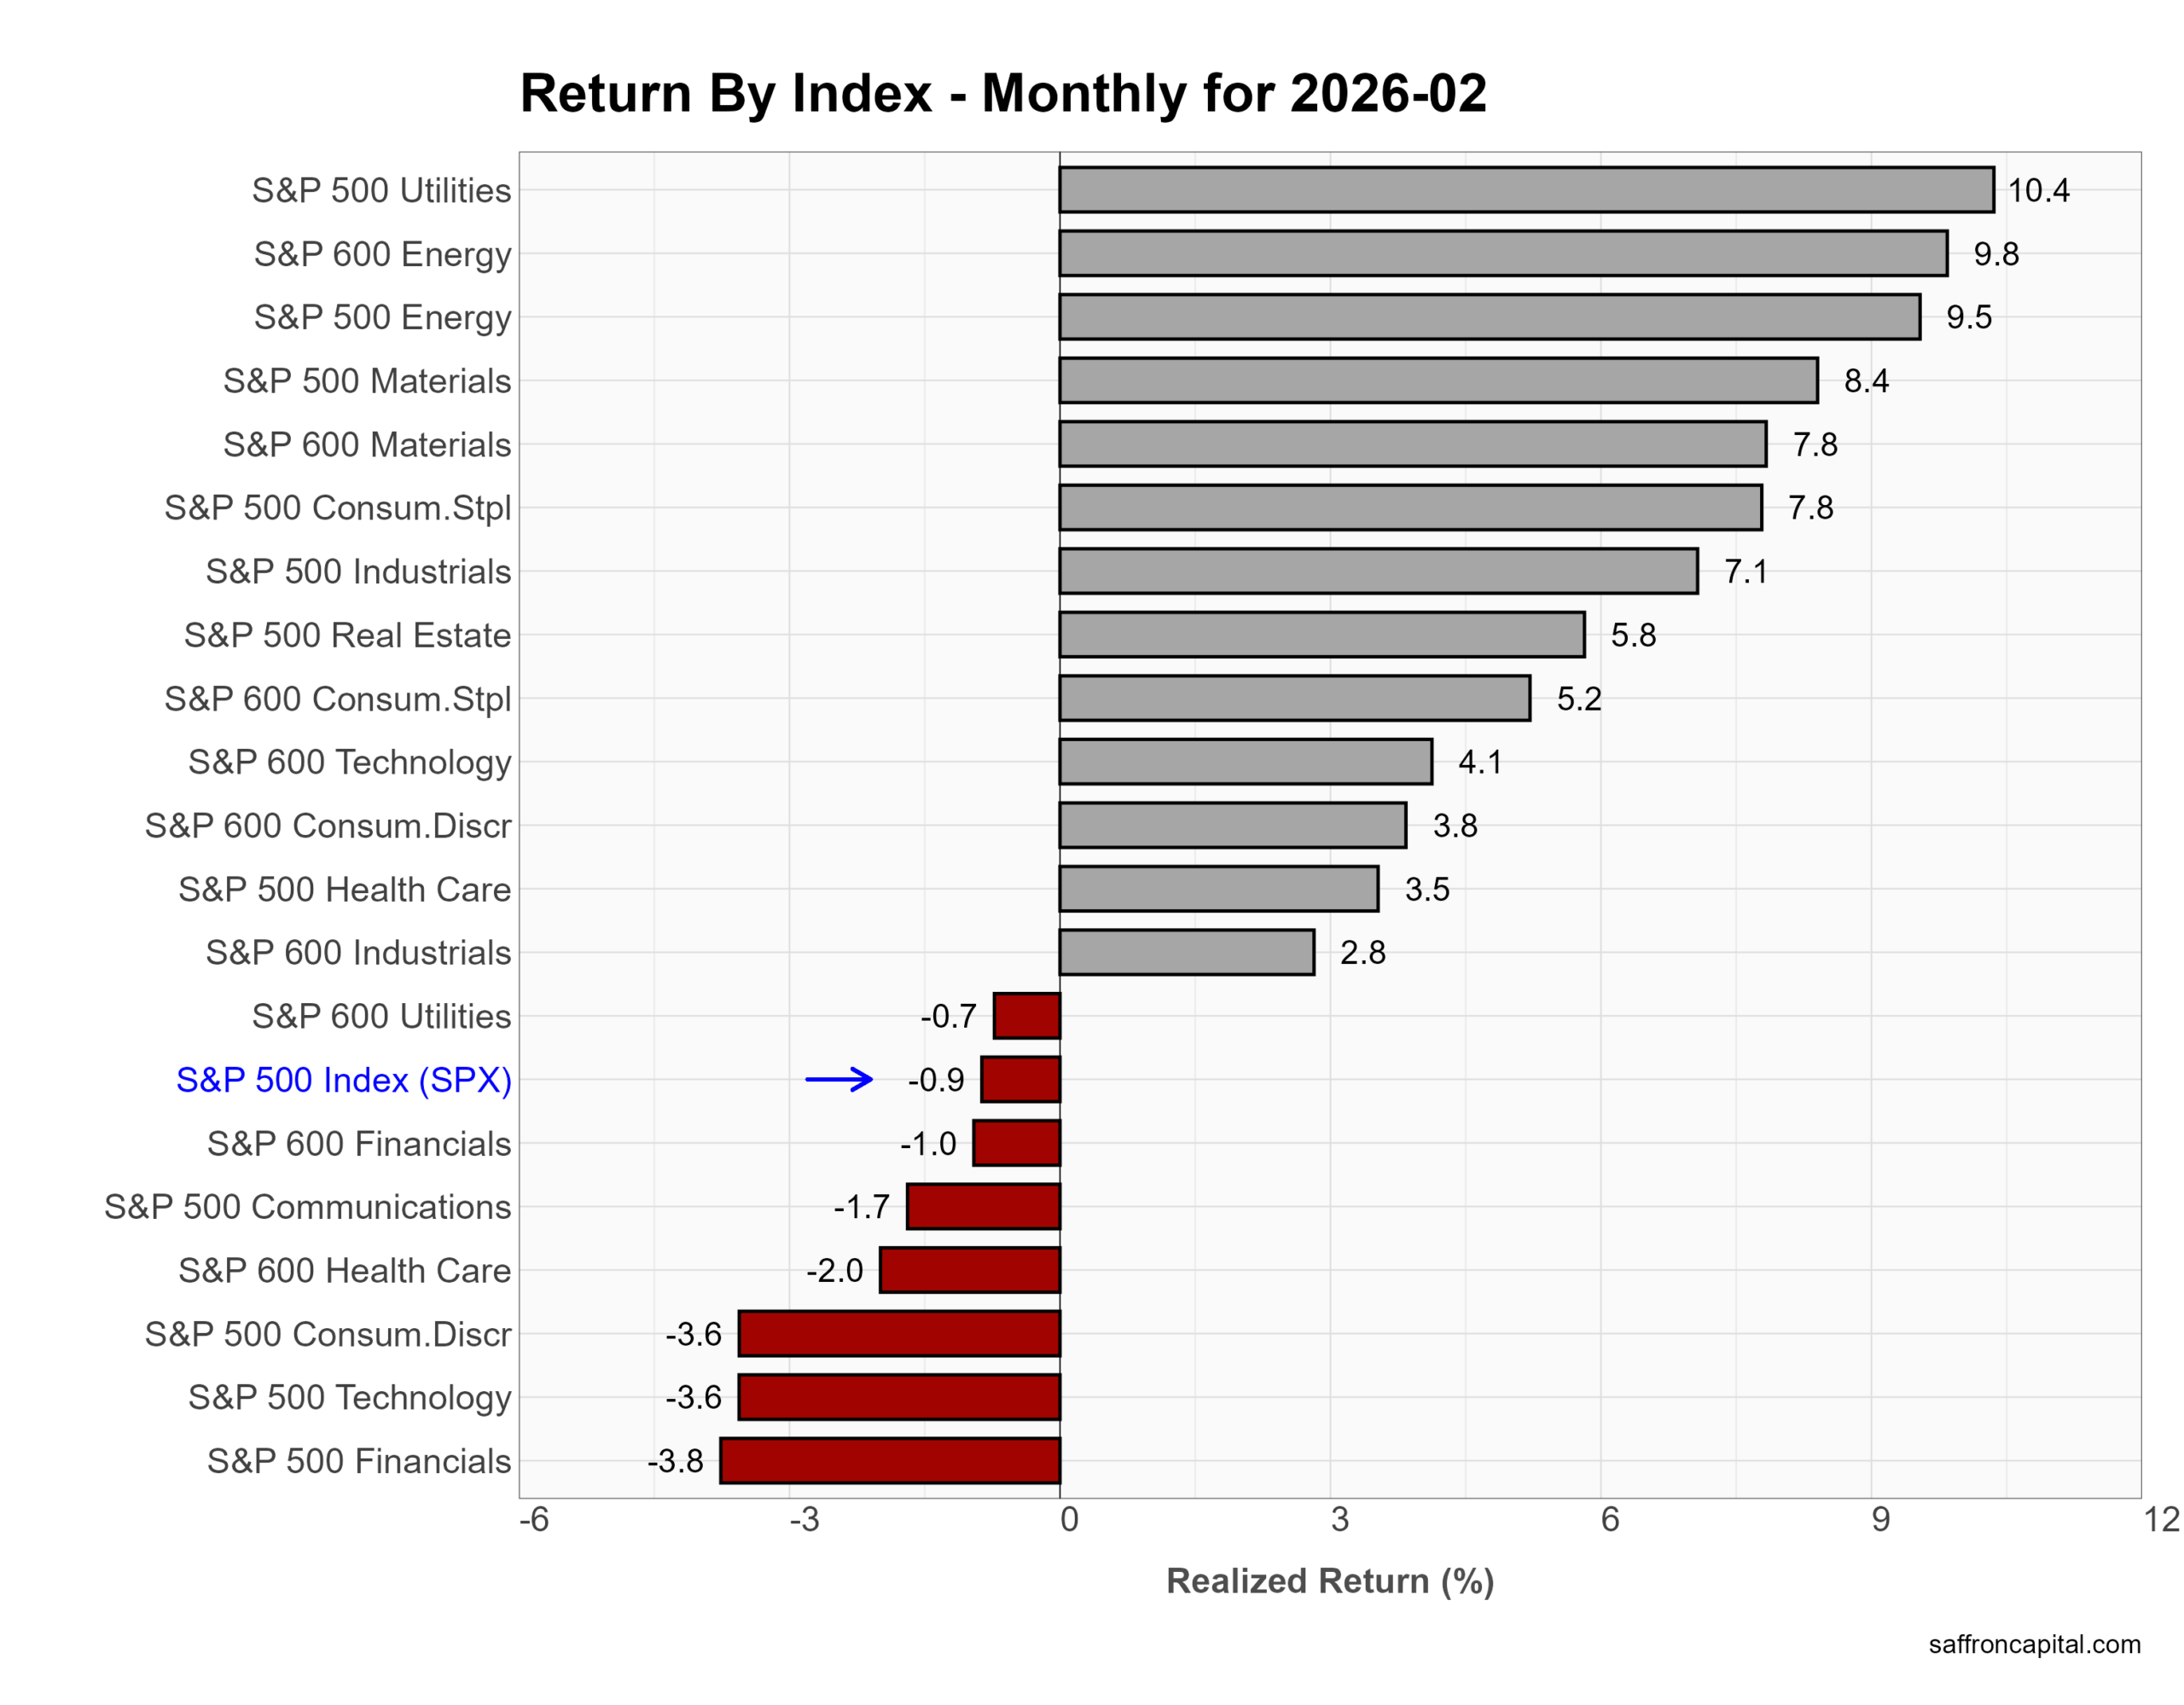
February returns saw, sector leadership turn defensive and cyclical. First, Utilities led with a 10.4% gain as investors sought stable cash flows amid inflation concerns. Next, Energy surged. Small-cap Energy jumped 9.8%, and large-cap Energy rose 9.5% as oil prices firmed and supply risks stayed in focus. Materials also rallied, up 8.4% in large caps and 7.8% in small caps, supported by global manufacturing demand. Meanwhile, Industrials and Consumer Staples posted solid gains. In contrast, growth sectors struggled. Large-cap Technology fell 3.6%, and Consumer Discretionary dropped 3.6%. Financials declined 3.8% as rate volatility pressured margins.
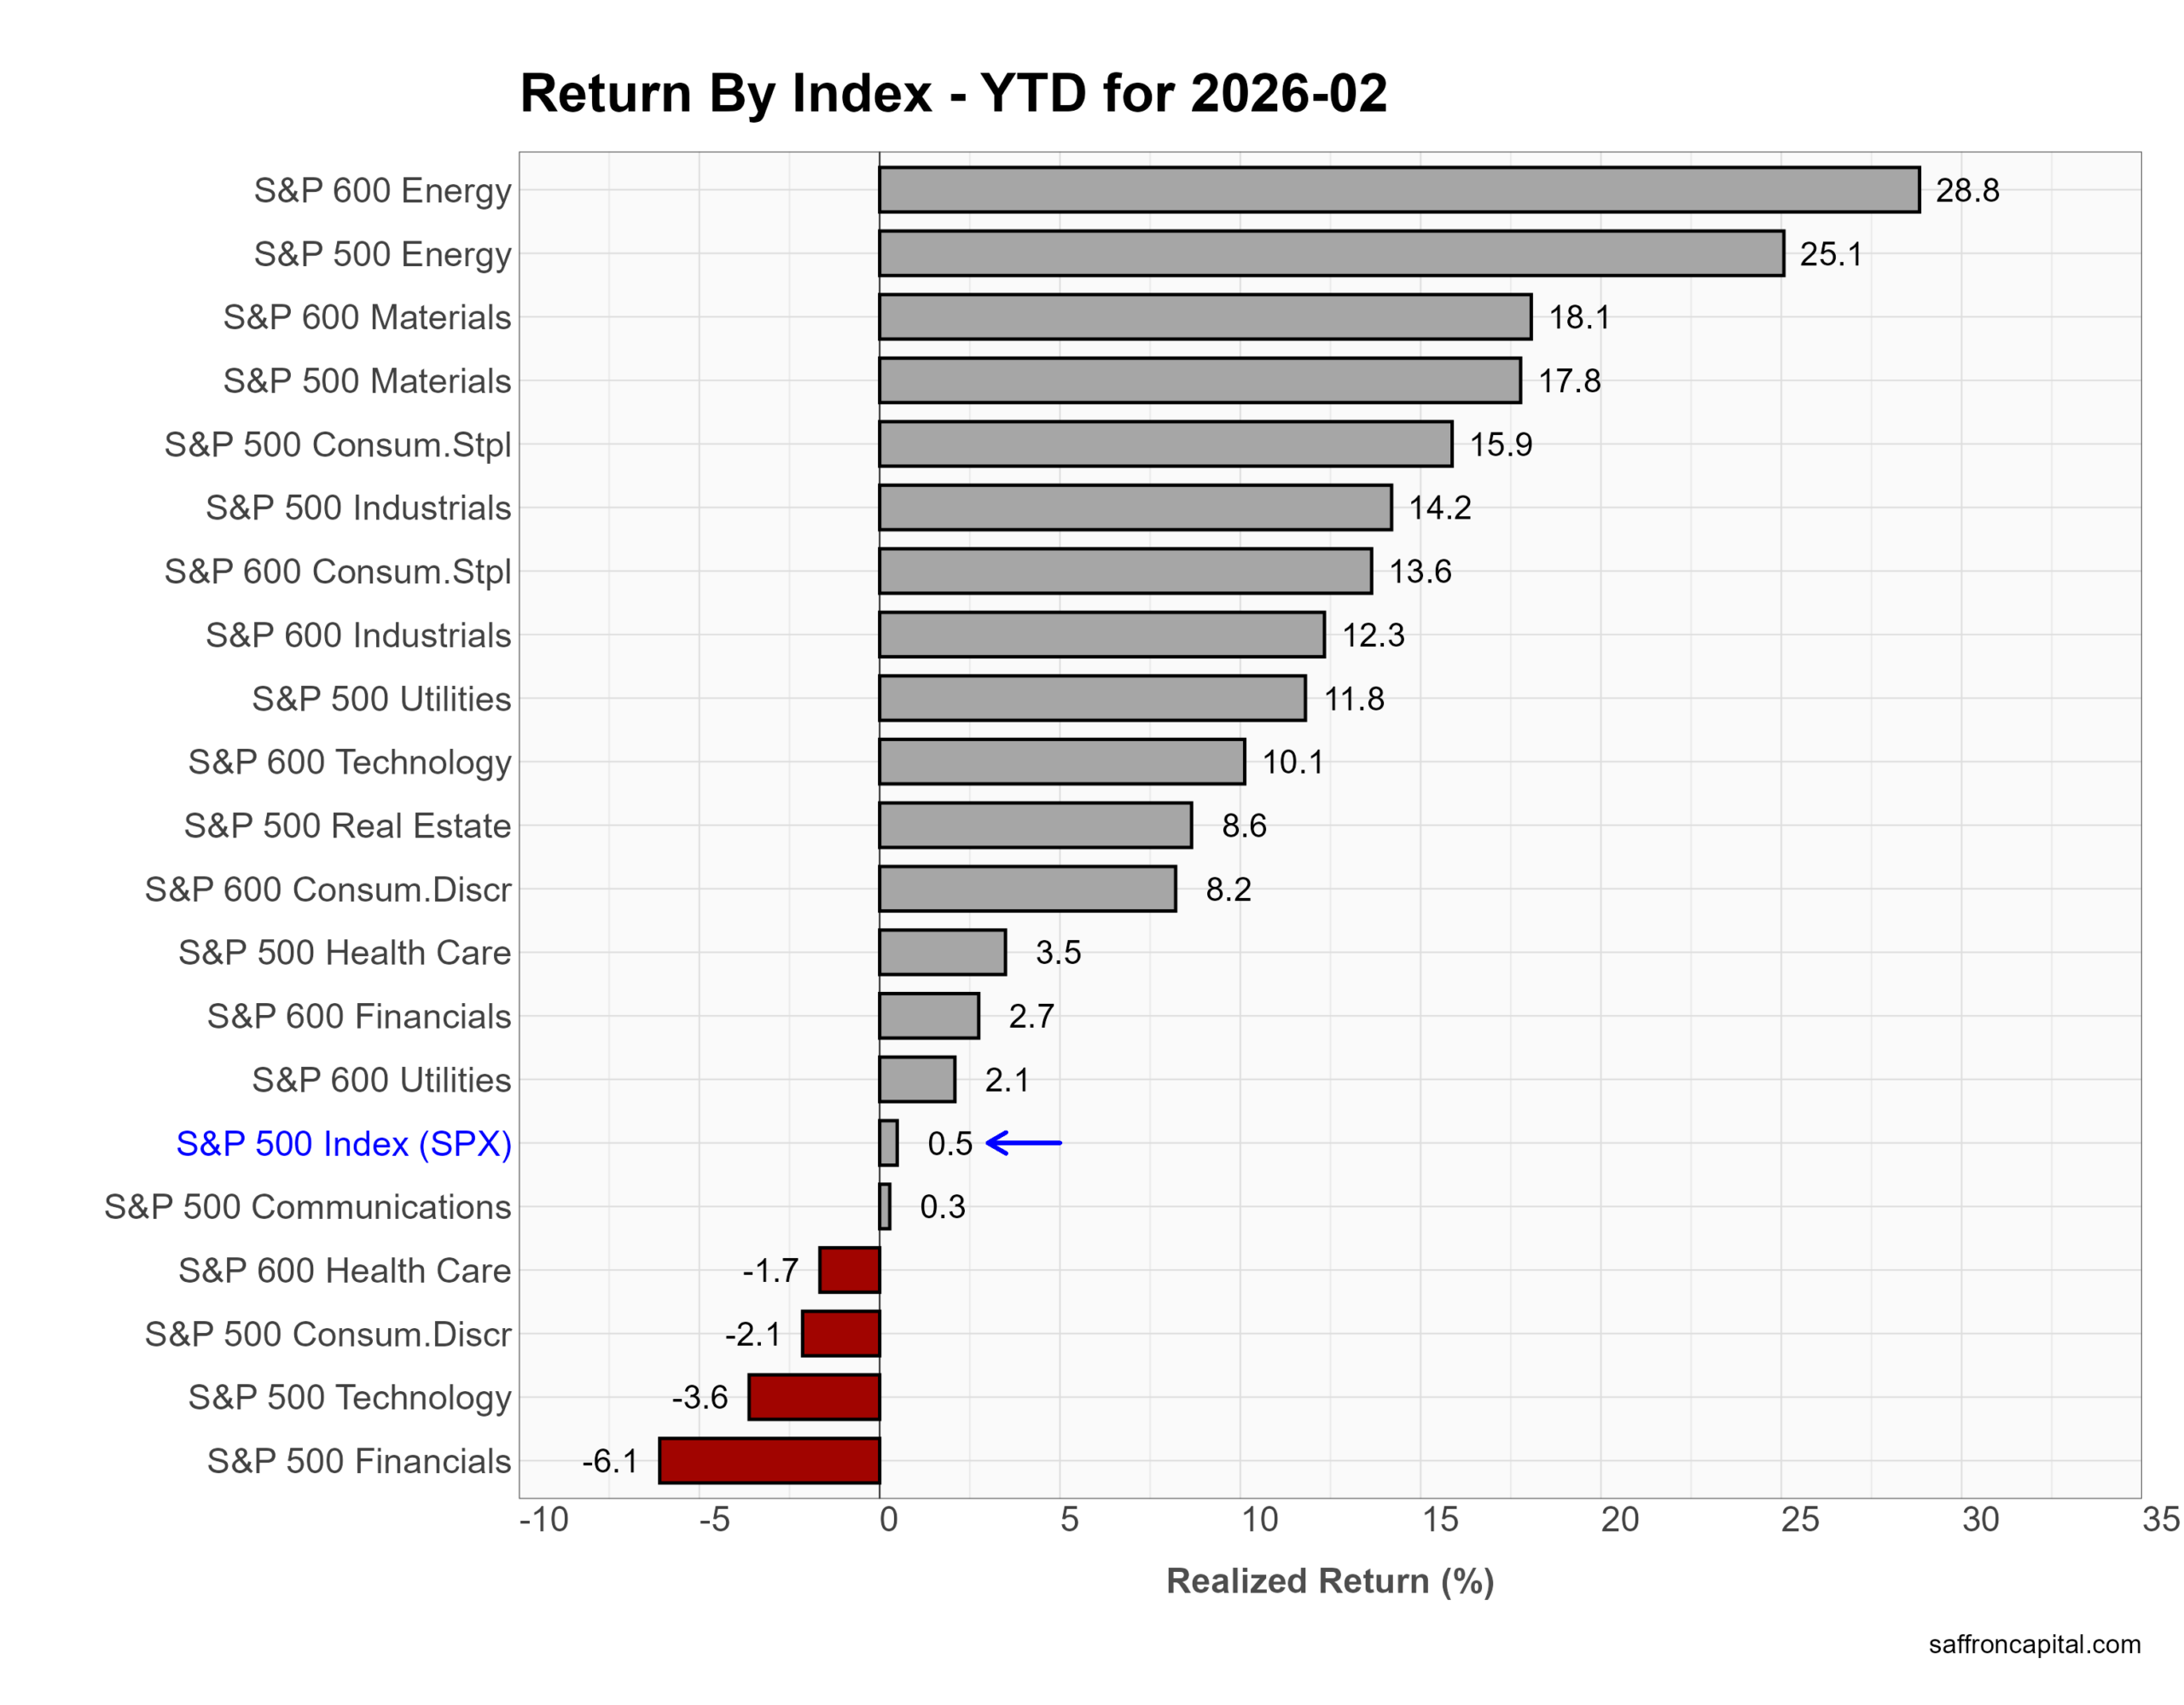
Year to date, Energy dominates. Small-cap Energy leads at 28.8%, and large-cap Energy follows at 25.1%. Materials and Industrials also show strong double-digit gains. However, Technology remains down 3.6%, and Financials trail at -6.1%. Overall, 2026 favors real assets and cyclicals over rate-sensitive growth stocks.
Click to enlarge
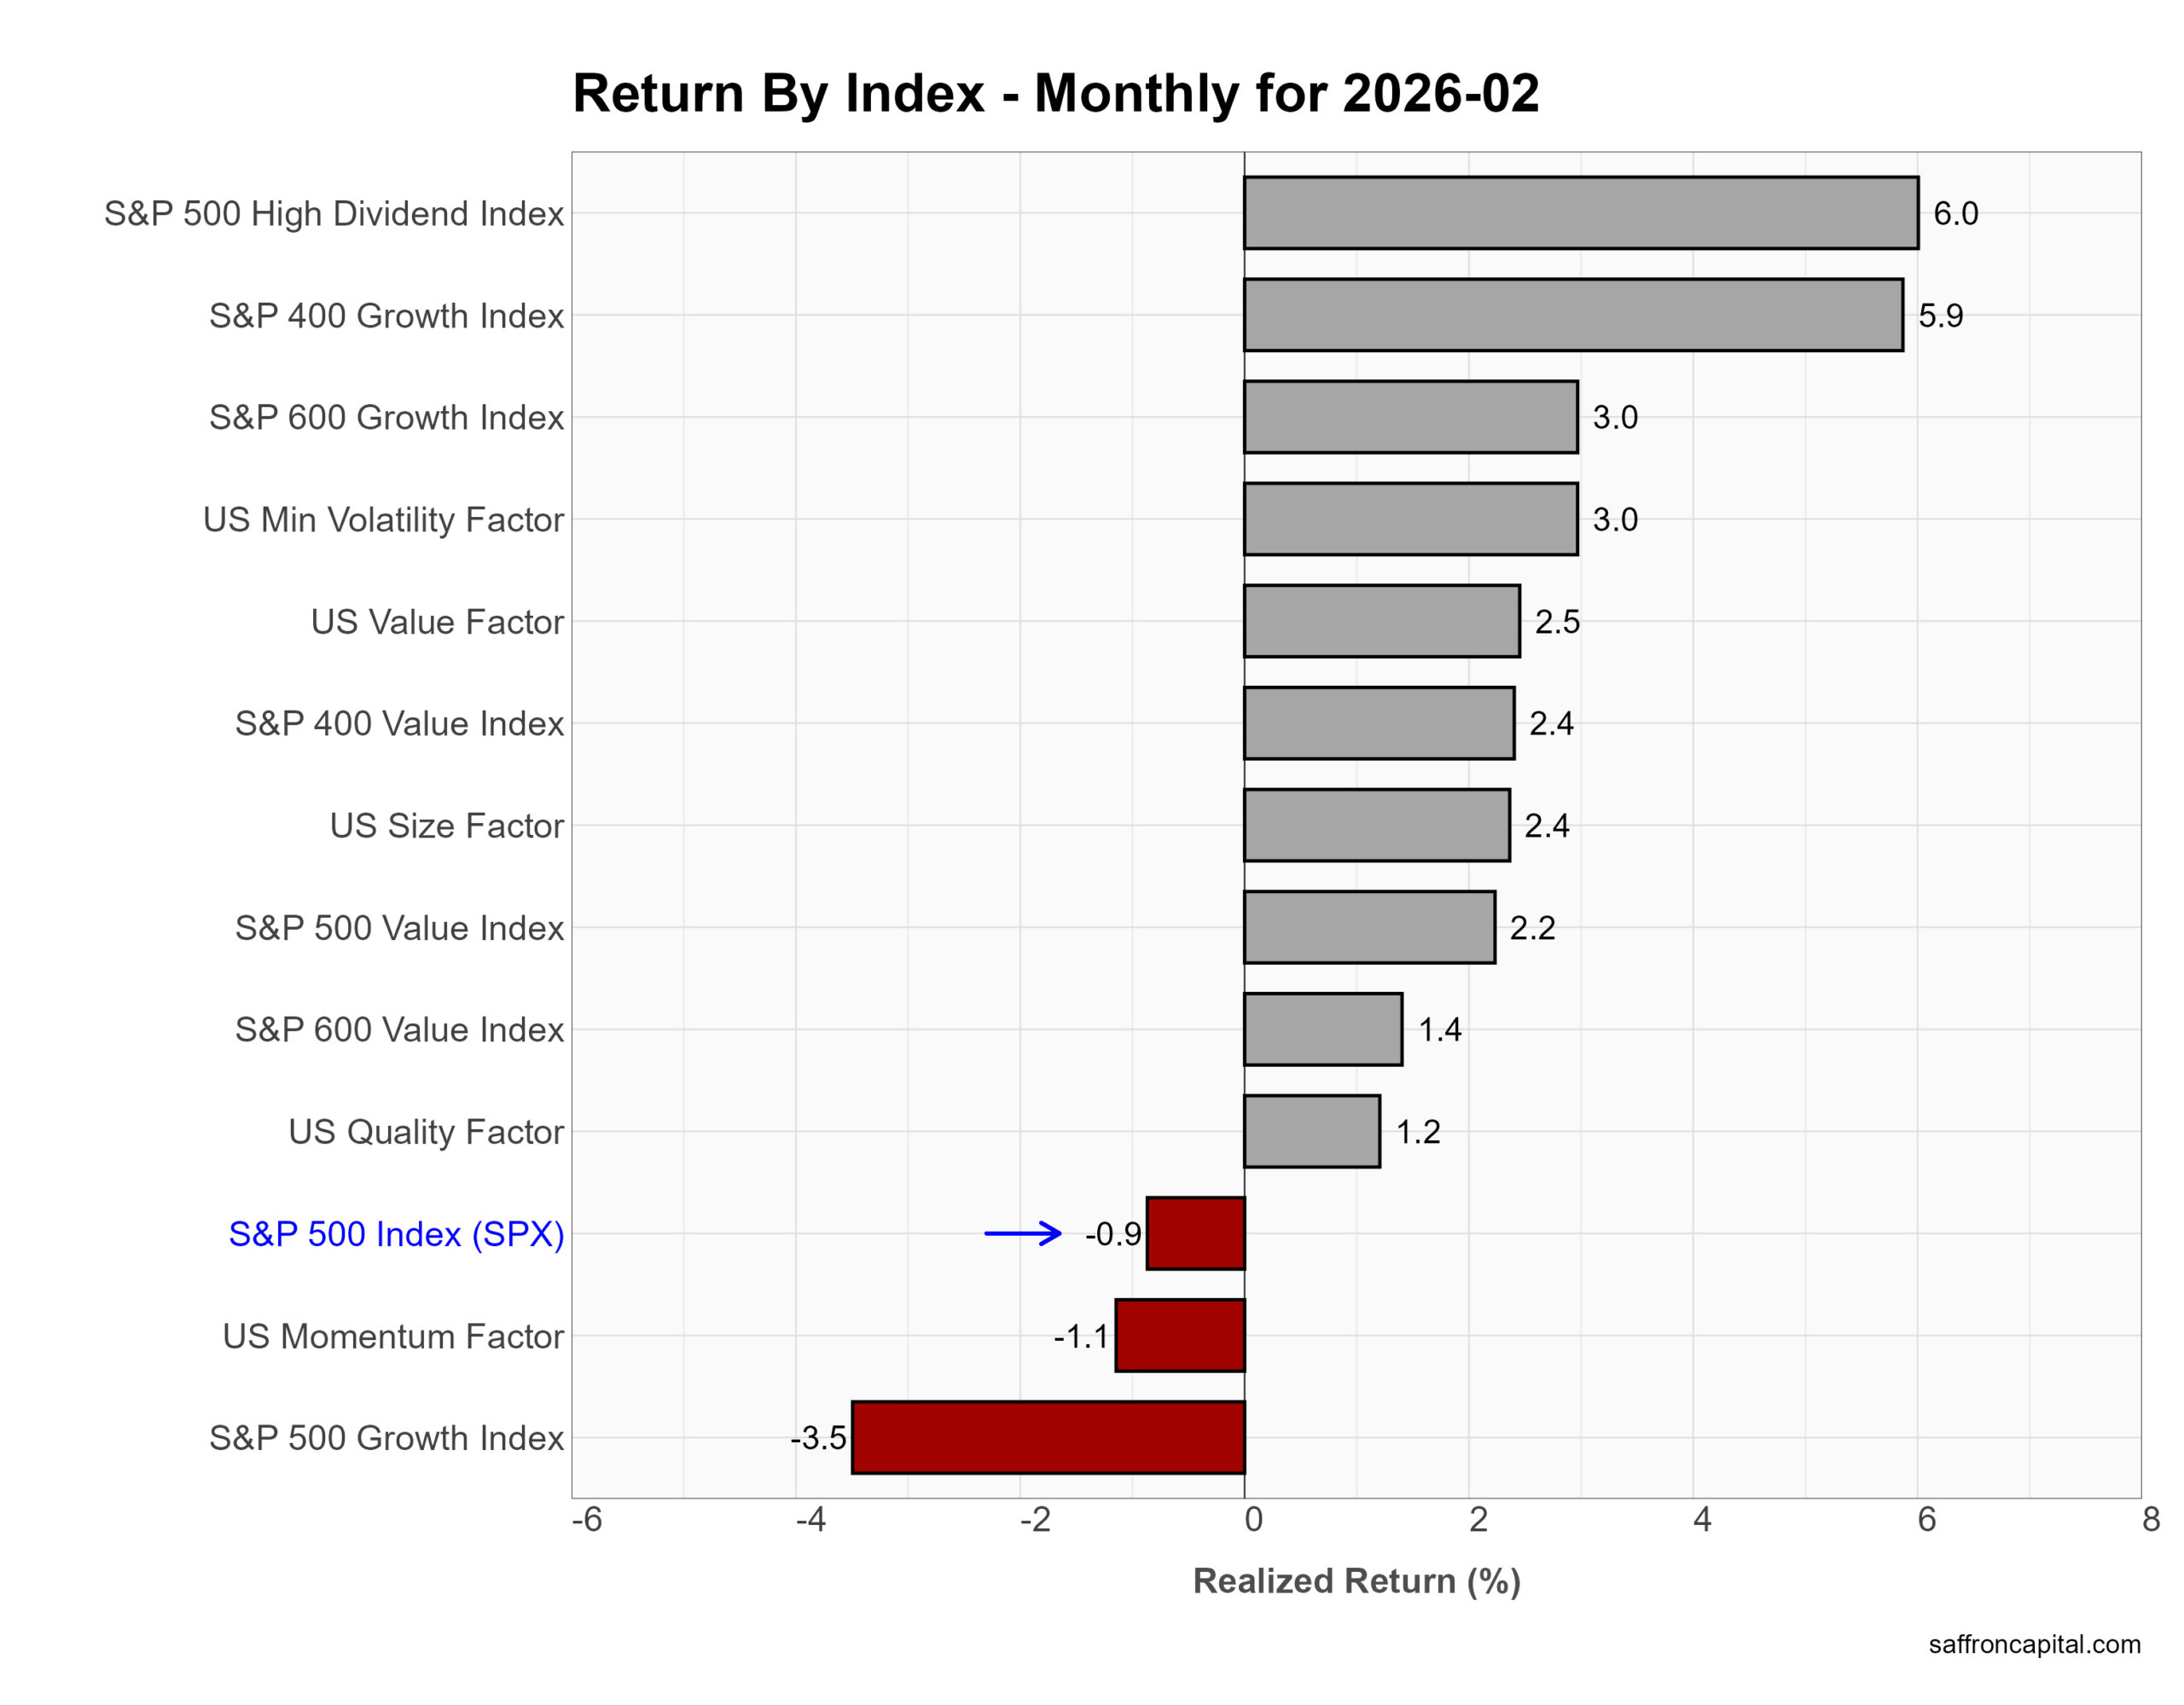
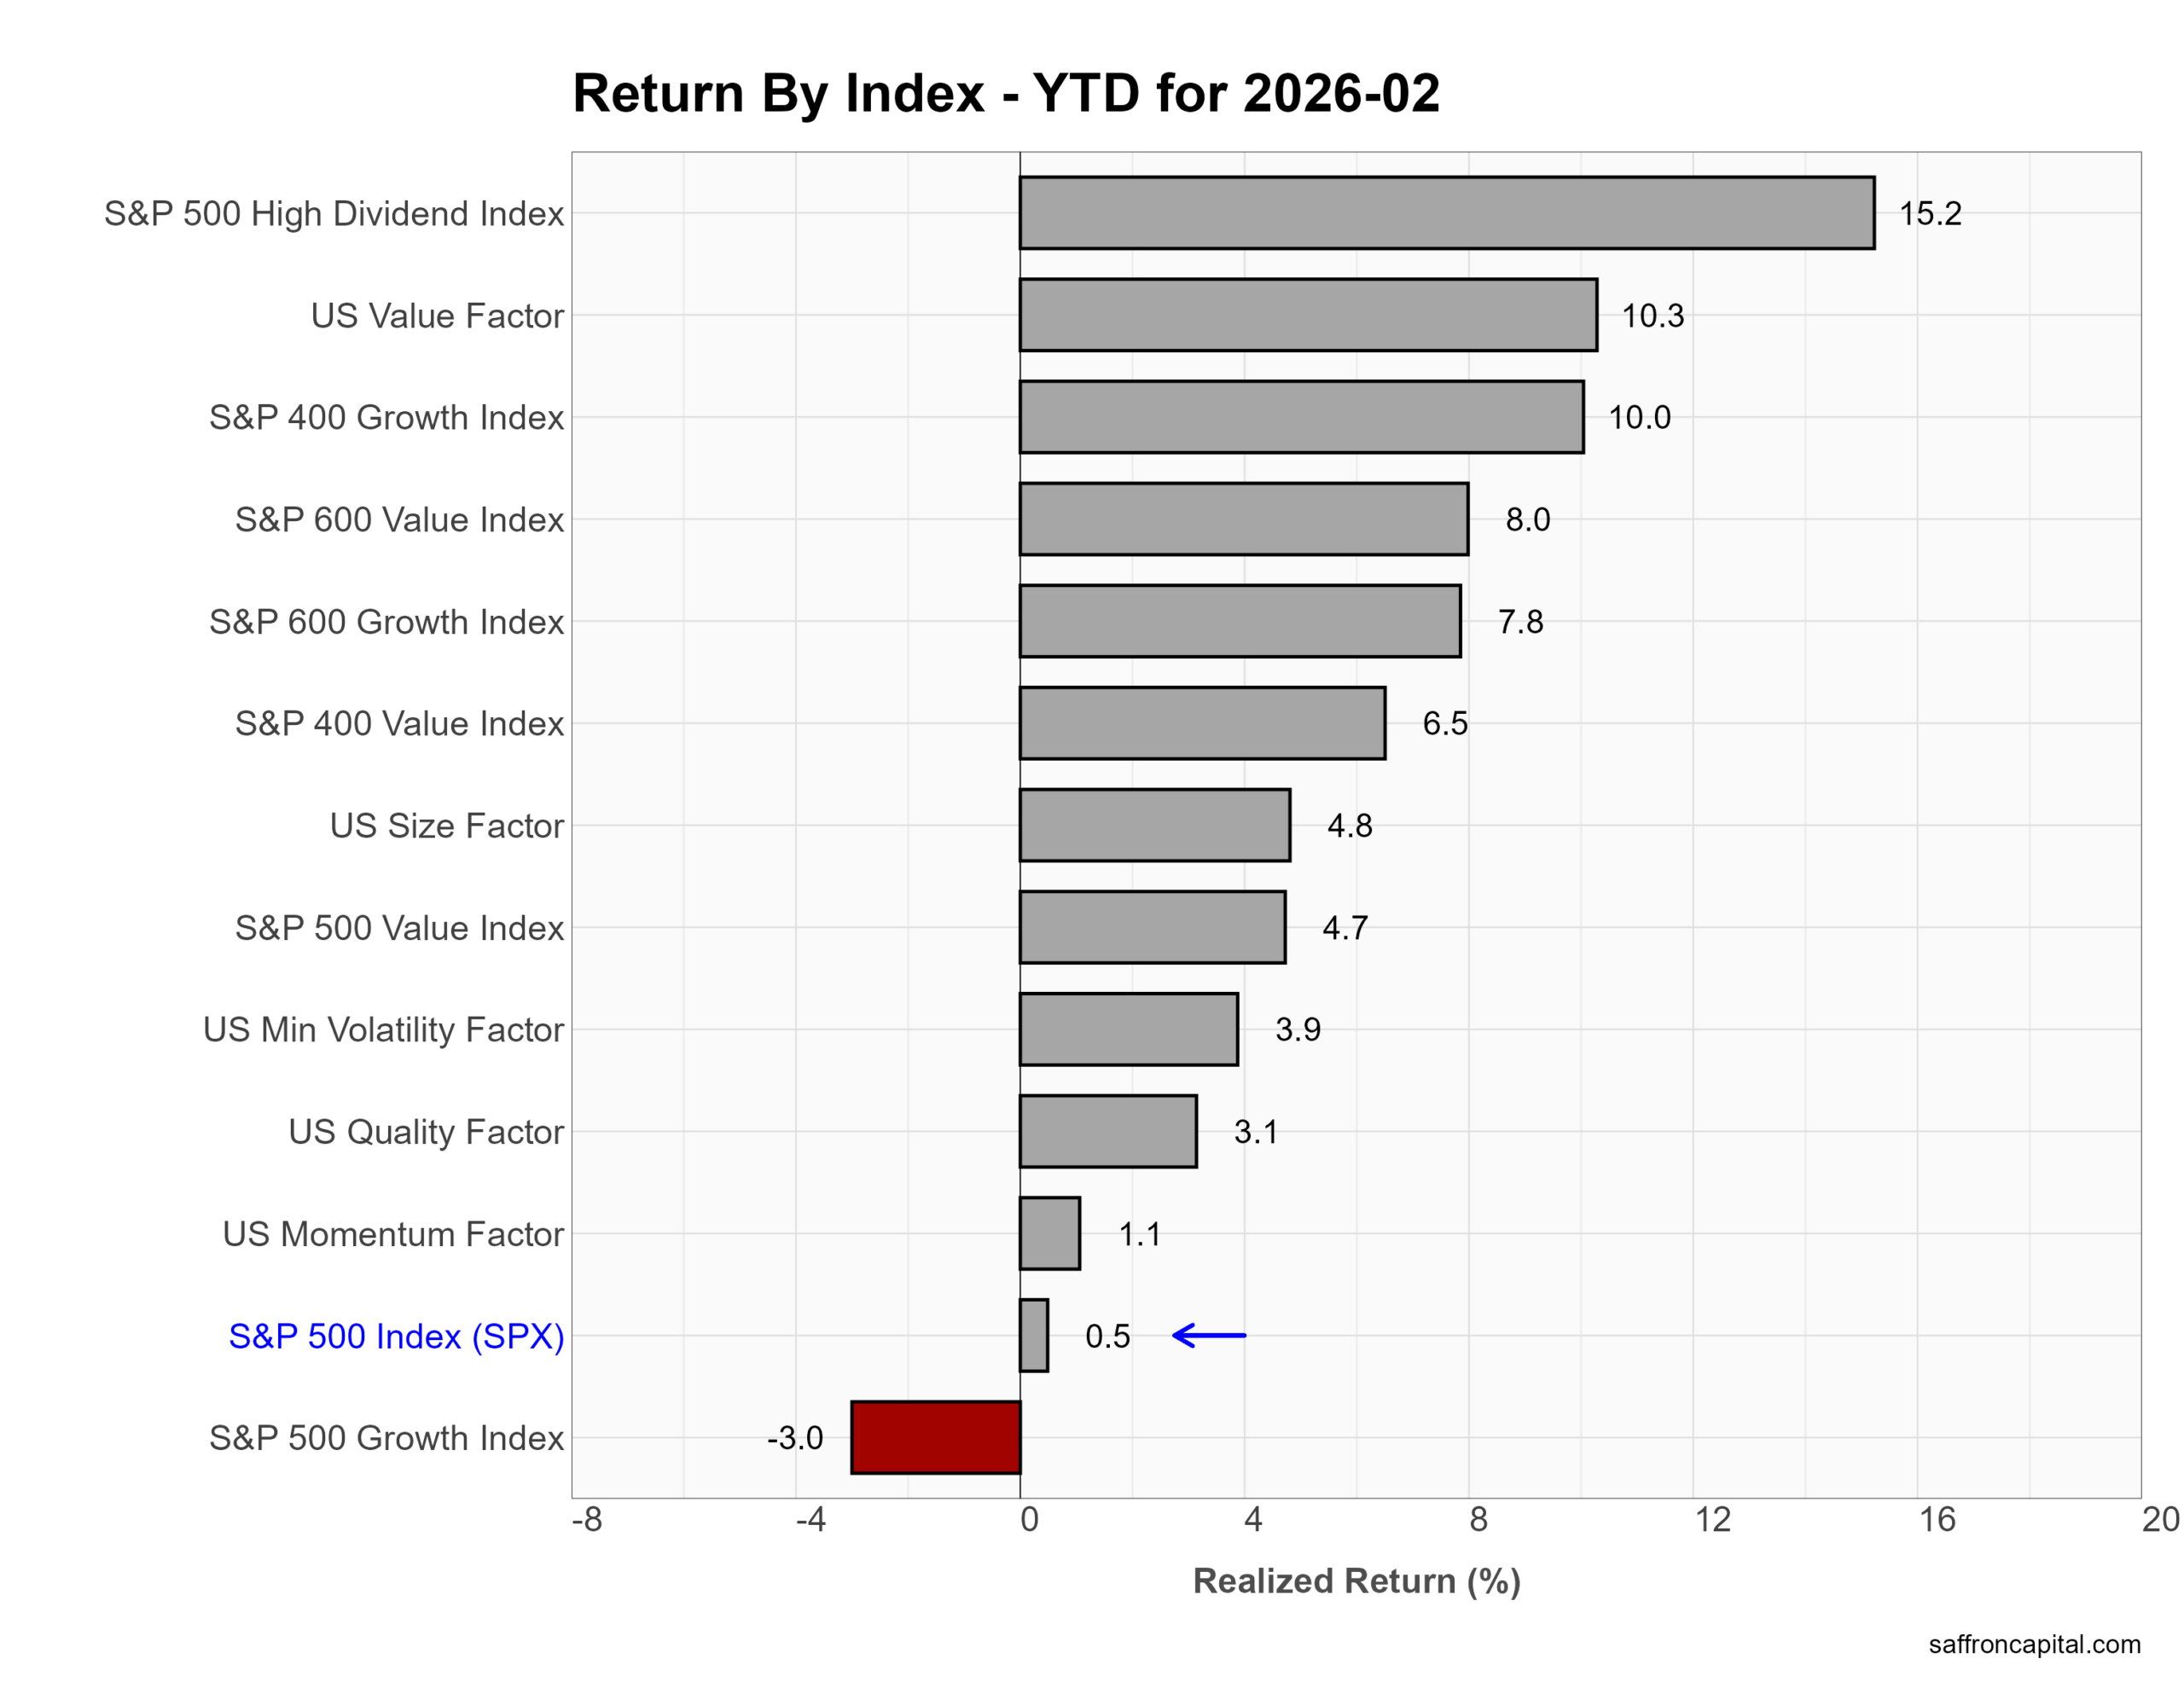
US Factor Indices
In February, investors favored income and balance sheet strength over growth. First, the S&P 500 High Dividend Index gained 6.0%, which shows demand for steady cash flow as rate uncertainty rose. Next, mid-cap growth advanced 5.9%, and small-cap growth rose 3.0%, helped by improving market breadth. Meanwhile, the US Minimum Volatility factor gained 3.0%, and Value added 2.5%. In contrast, the S&P 500 Growth Index fell 3.5% as mega-cap tech cooled. Momentum also slipped 1.1%. Overall, investors reduced exposure to crowded growth trades and rotated toward defensive and value-oriented strategies.
Year to date, dividend and value lead. High Dividend stands up 15.2%, and the US Value factor gained 10.3%. Mid-cap growth rose 10.0%, and small-cap value climbed 8.0%. However, large-cap growth remains down 3.0%. The S&P 500 sits at just 0.5%. In short, 2026 rewards income, value, and diversification over pure growth momentum.
Click to enlarge
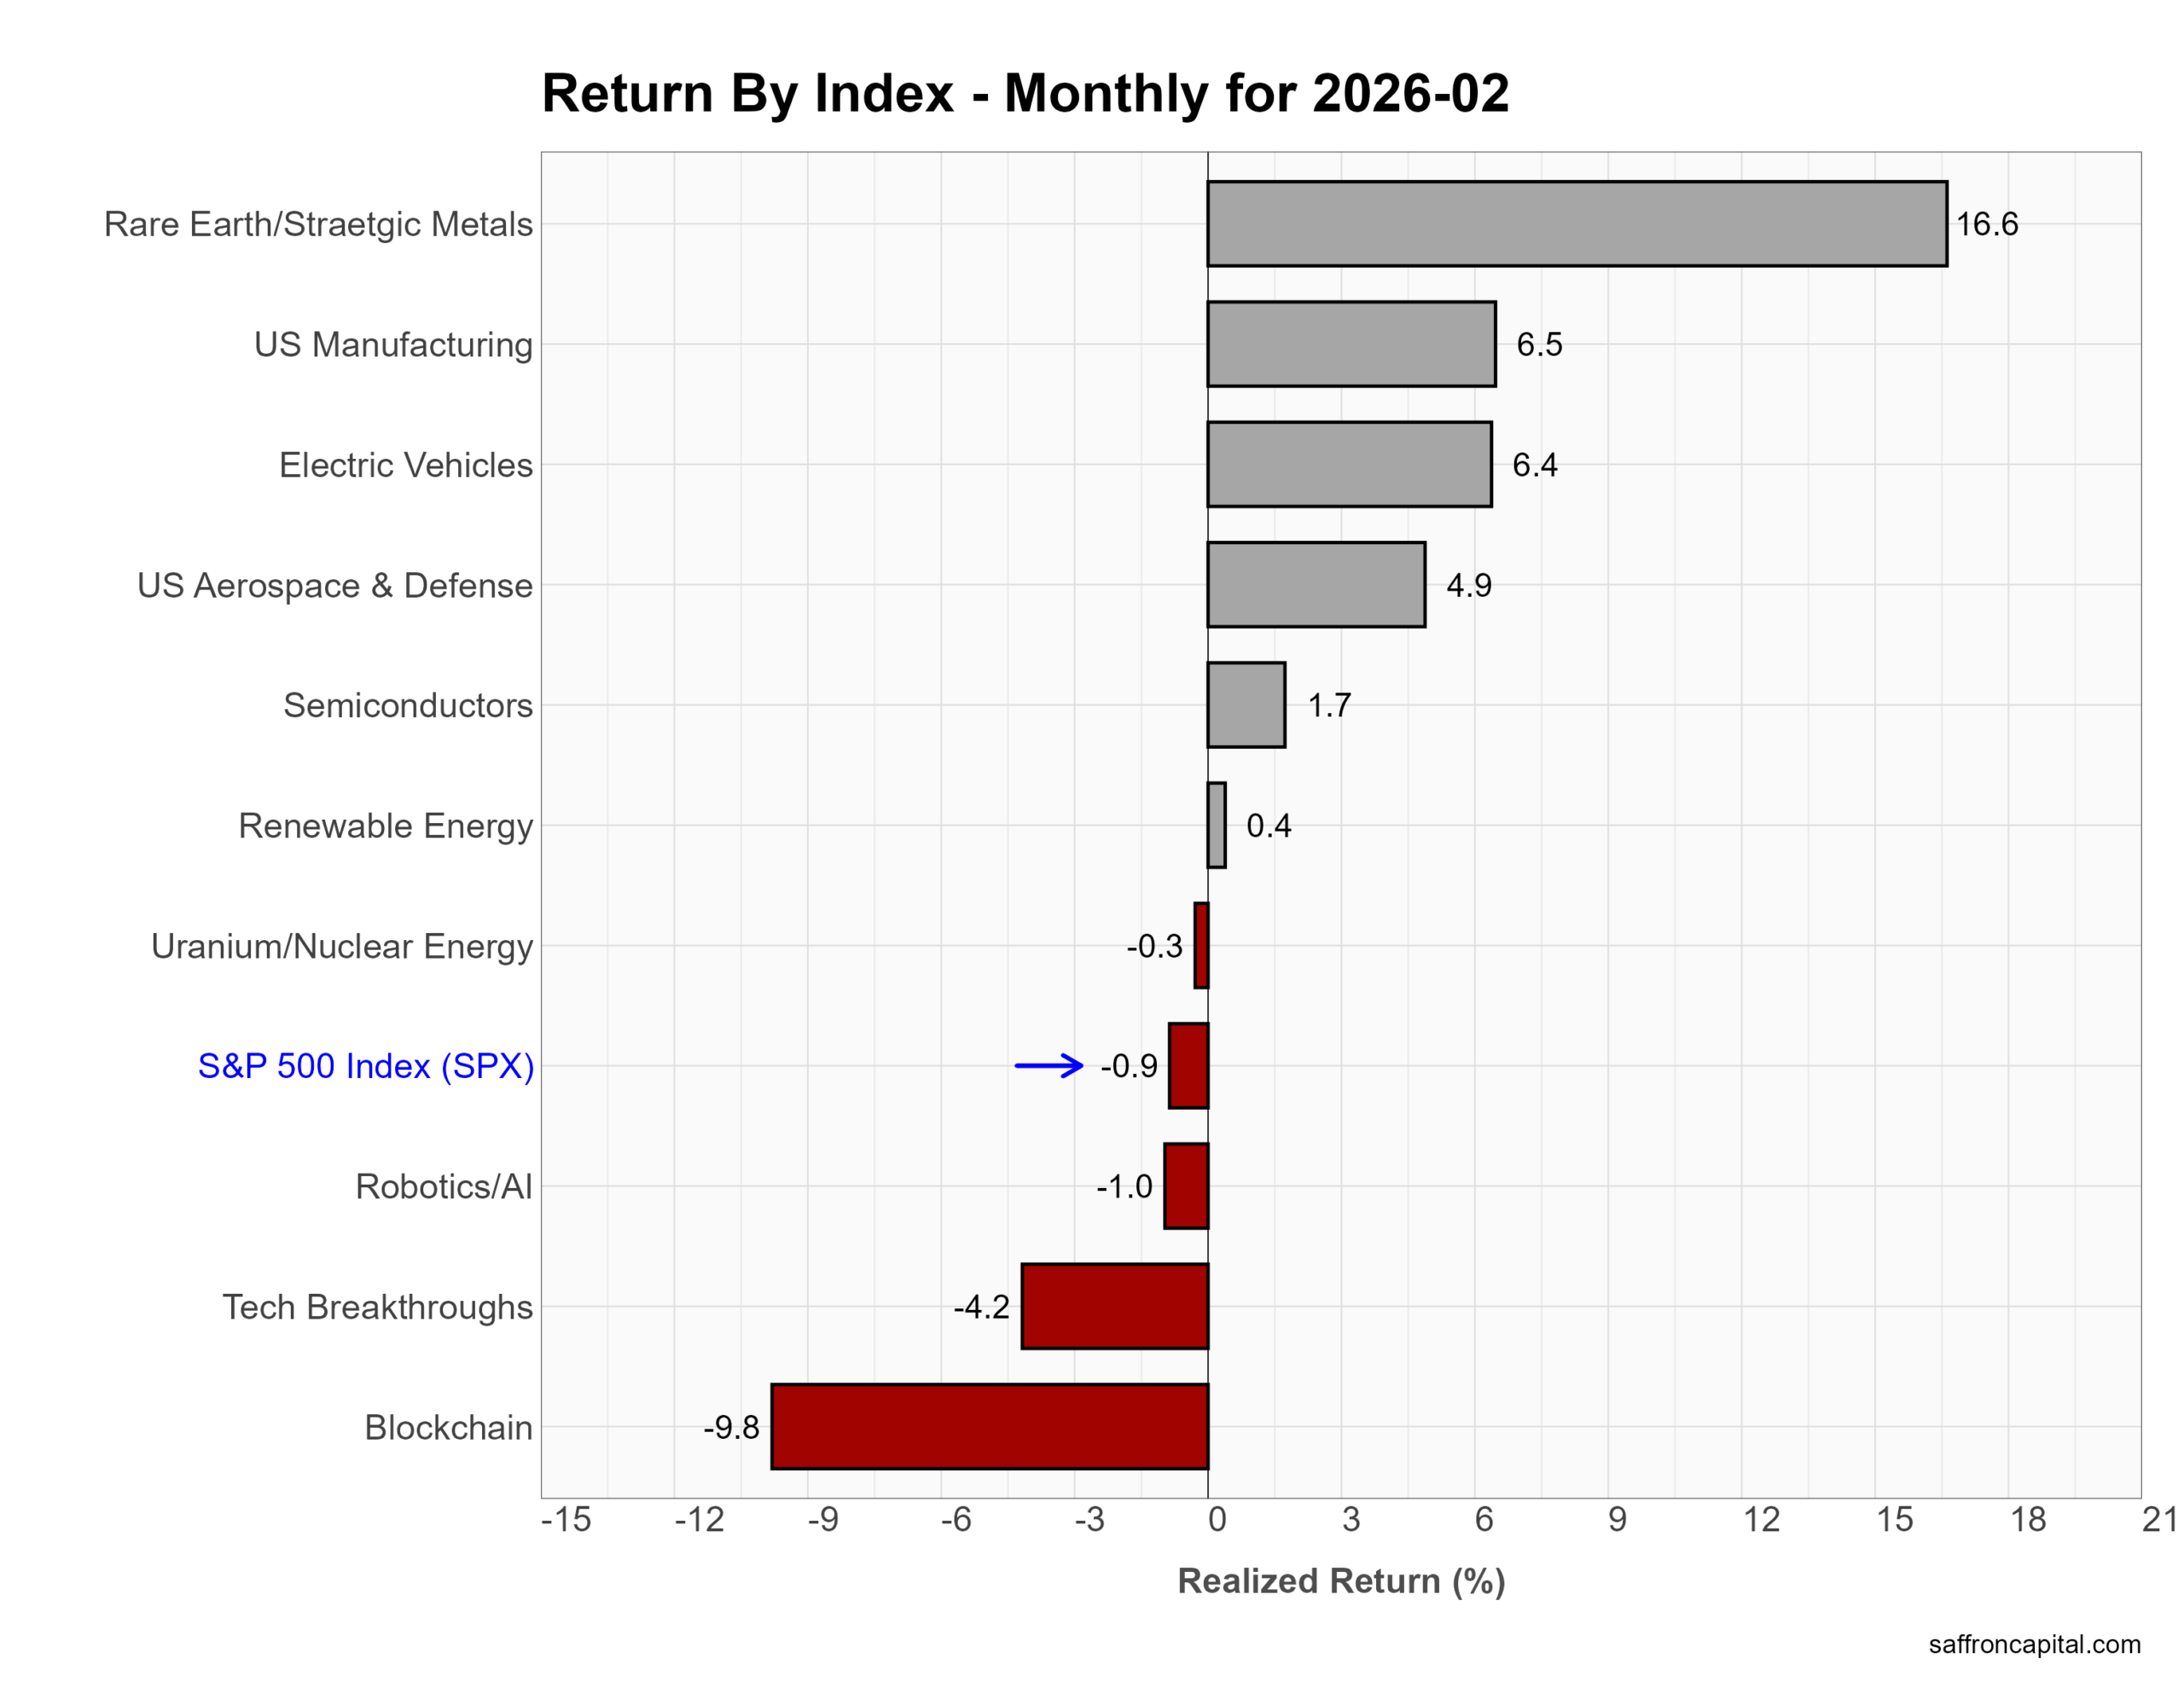
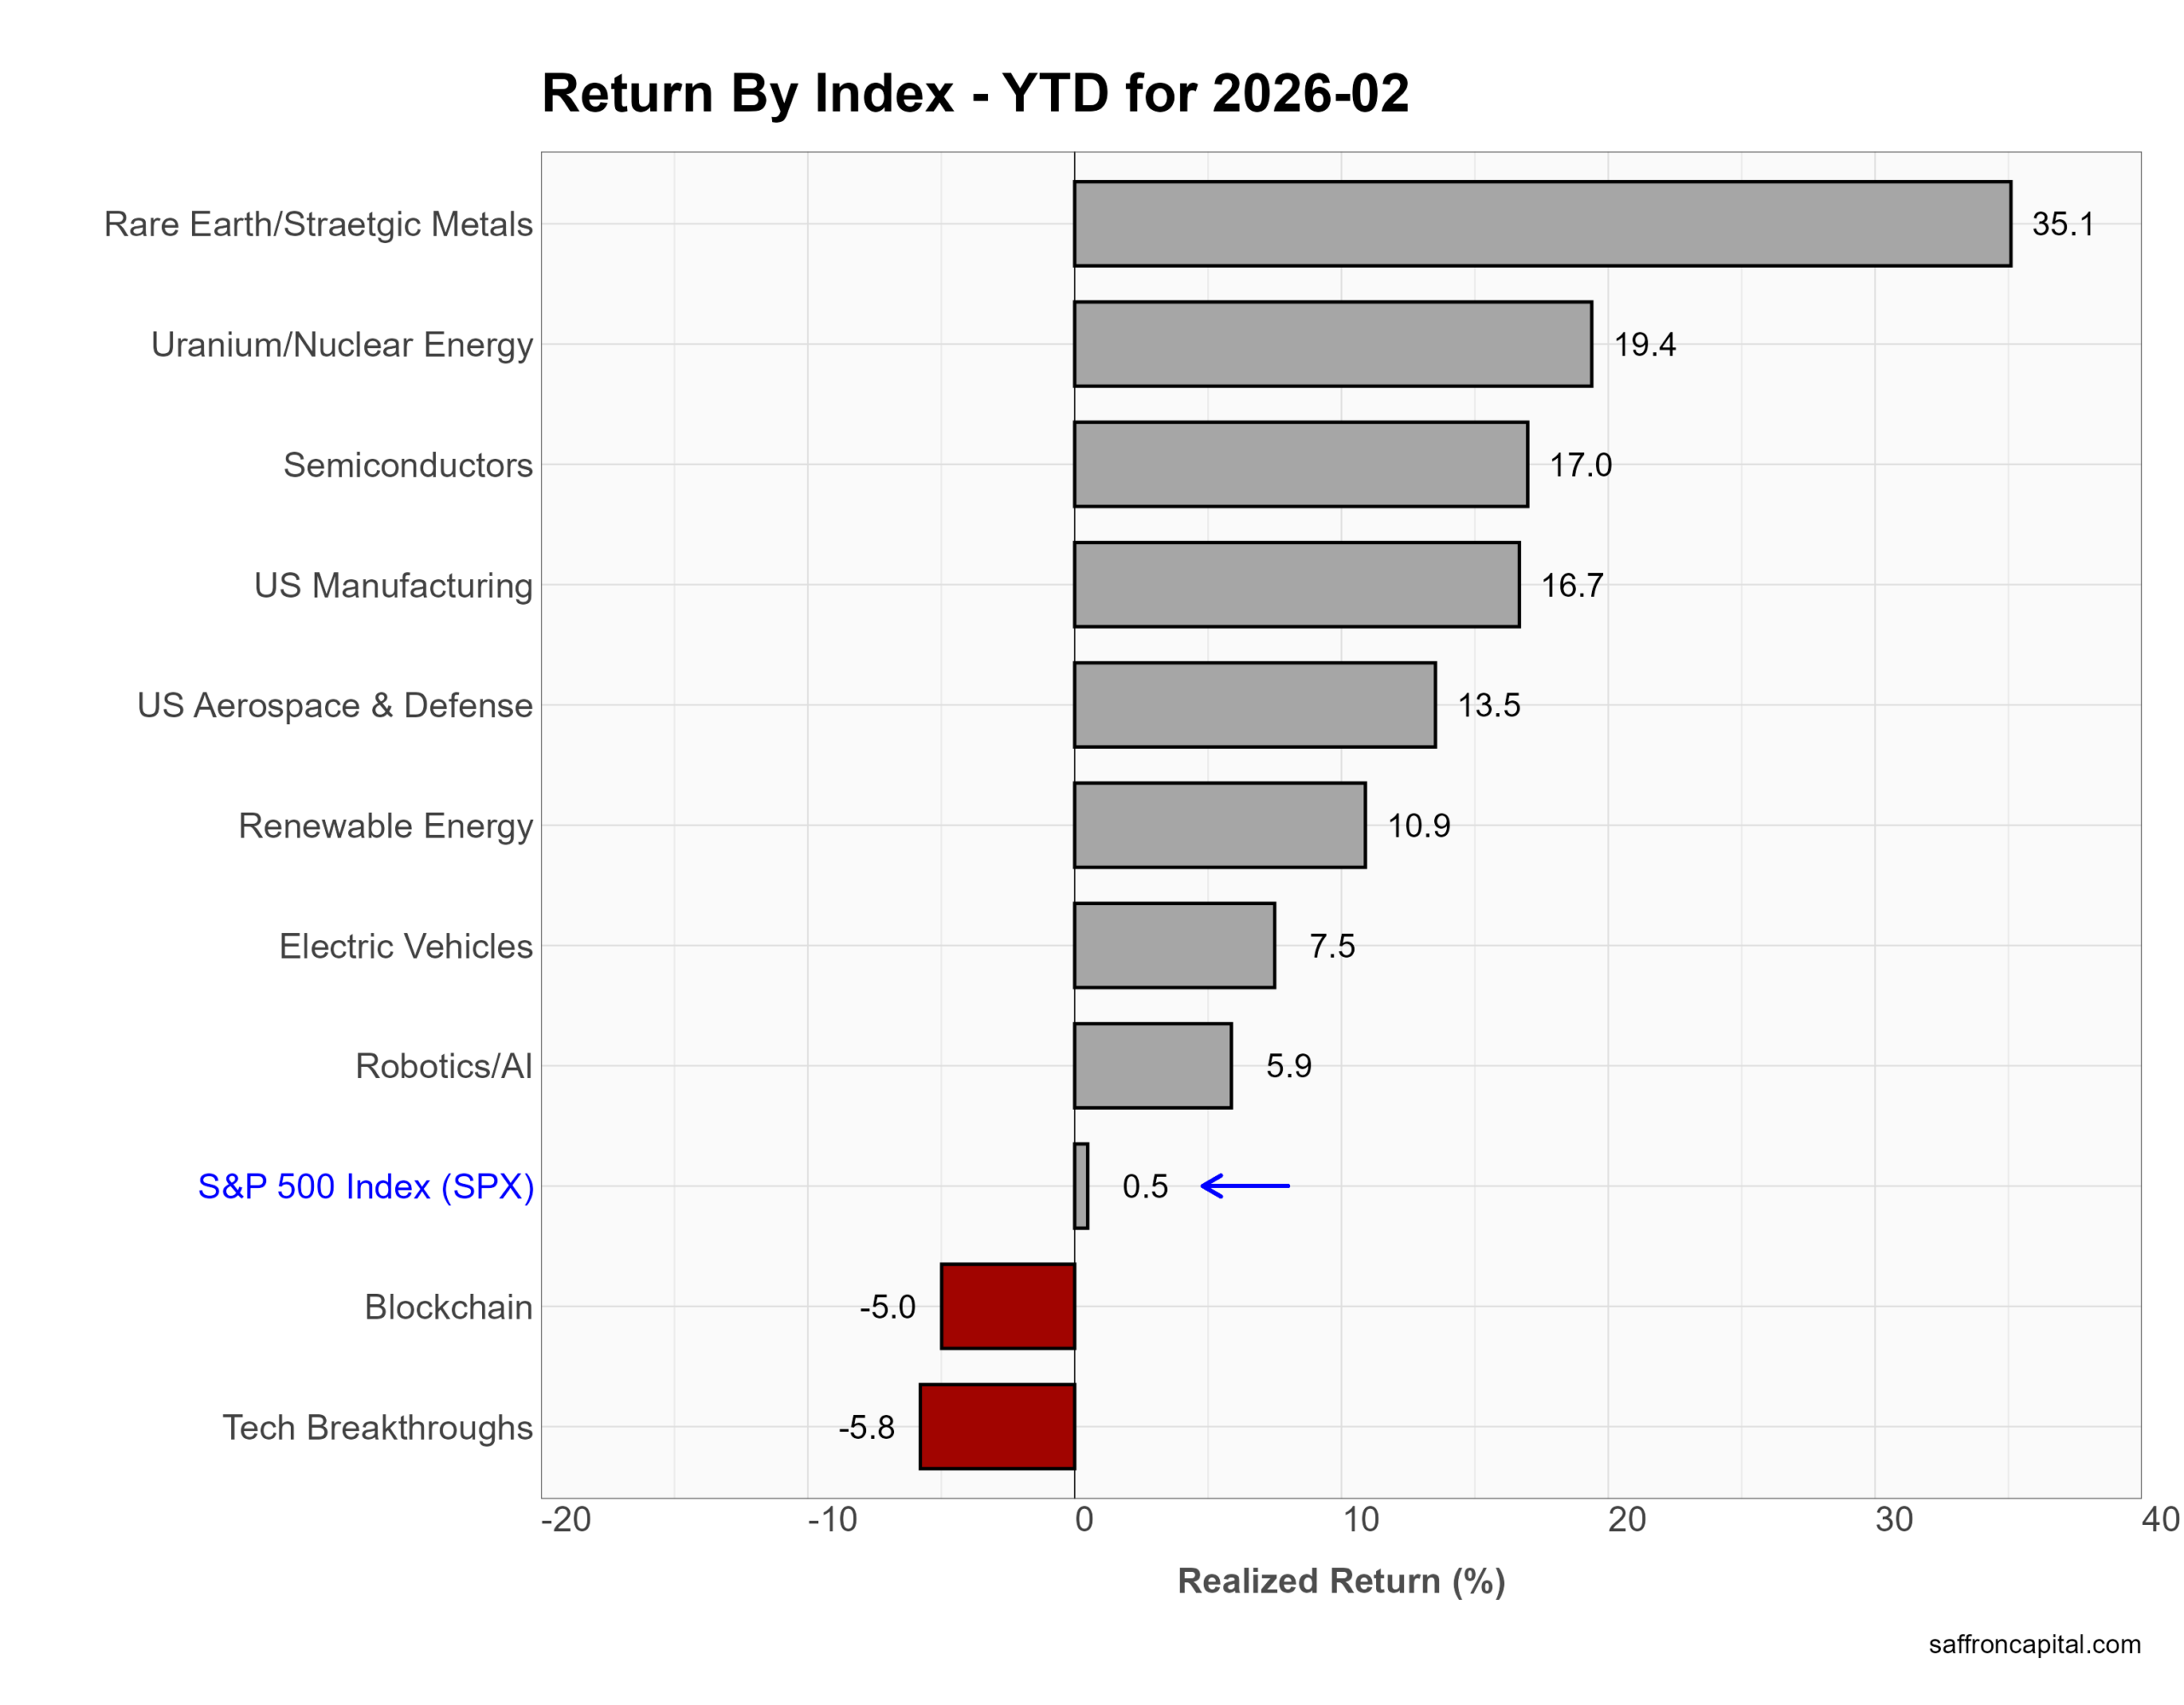
US Thematic Portfolios
February returns were led by hard-asset themes while speculative tech lagged. First, Rare Earth and Strategic Metals surged 16.6% as governments pushed supply chain security and defense spending. Next, US Manufacturing rose 6.5%, and Electric Vehicles gained 6.4% on industrial reshoring trends. US Aerospace & Defense added 4.9% as geopolitical tensions supported orders. Meanwhile, Semiconductors edged up 1.7%. In contrast, high-beta themes sold off. Blockchain dropped 9.8%, and Tech Breakthroughs fell 4.2%. Robotics/AI slipped 1.0% as investors trimmed crowded AI trades.
Year to date, leadership remains tied to real assets and strategic industries. Rare Earths jumped 35.1%, and Uranium/Nuclear Energy gained 19.4% amid global energy security efforts. Semiconductors rose 17.0%, and US Manufacturing advanced 16.7%. However, Blockchain remains down 5.0%, and Tech Breakthroughs fell 5.8%. Overall, 2026 favors tangible infrastructure and national security themes over speculative growth narratives.
Click to enlarge
Developed Market Equities
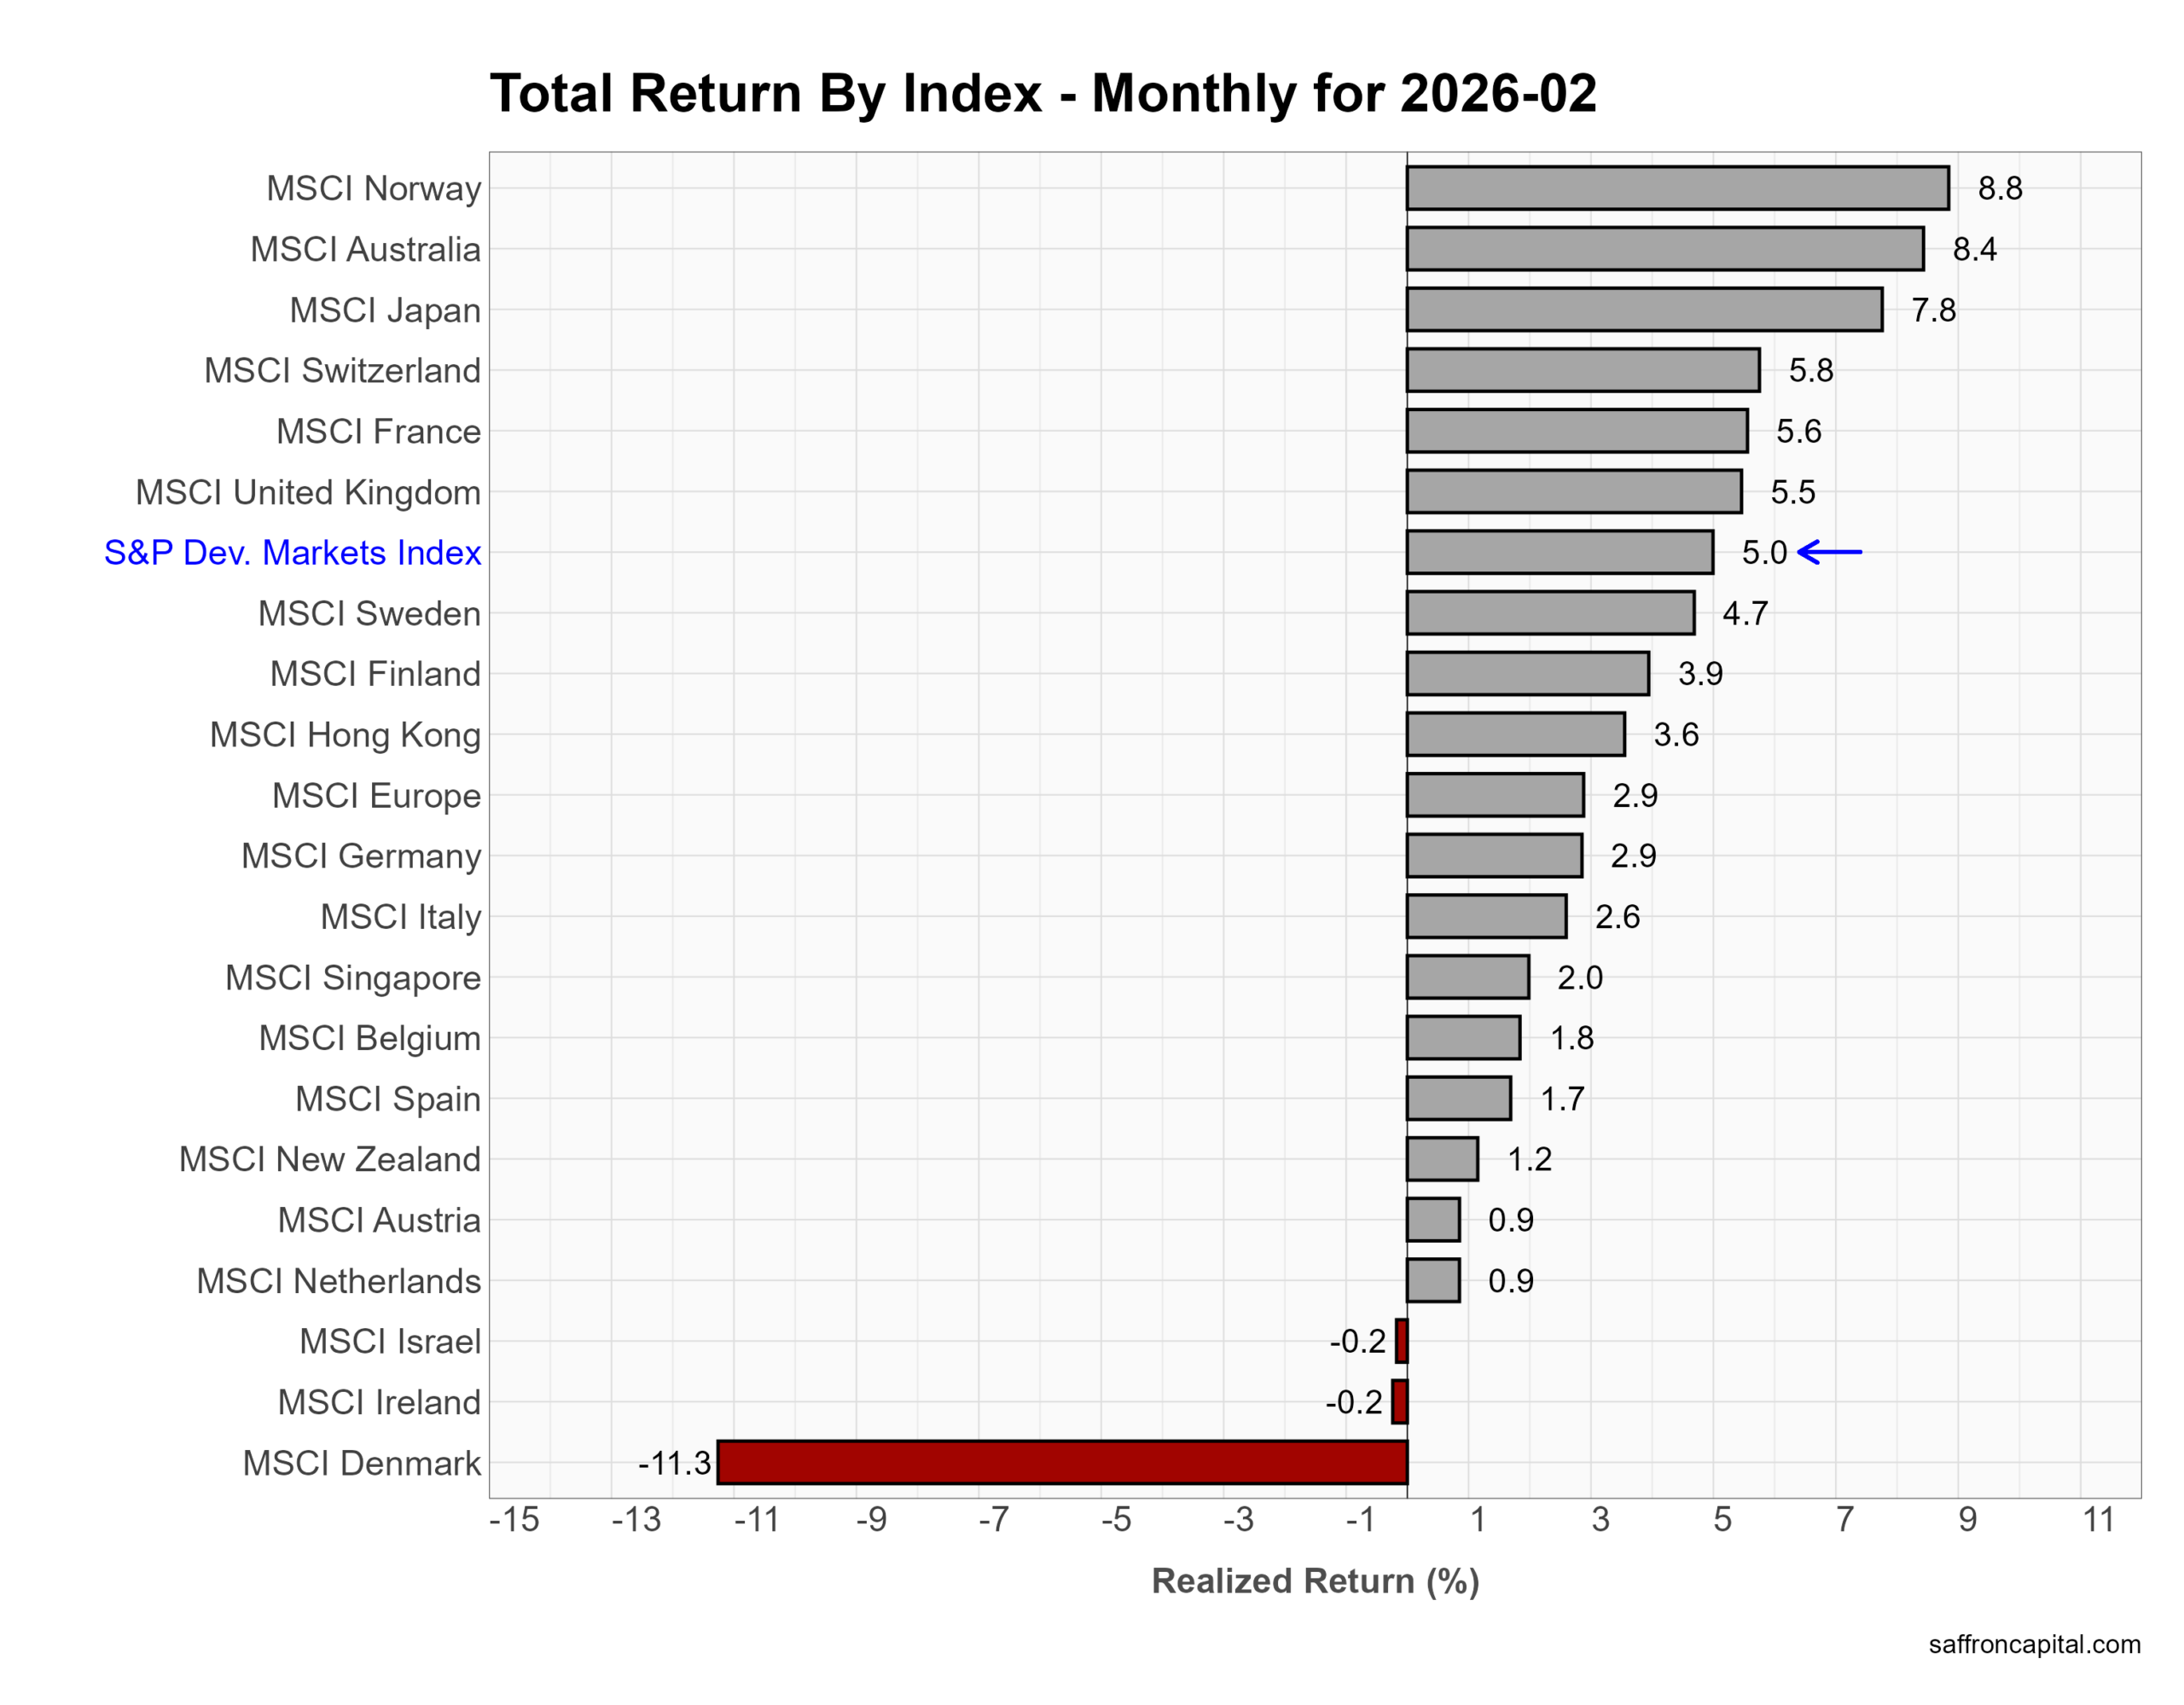
February returns saw developed markets outperform the U.S. First, the S&P Developed Markets Index gained 5.0%. Norway led with an 8.8% rally as energy strength lifted equities. Australia rose 8.4%, and Japan added 7.8% on improved global growth sentiment and a weaker yen. Meanwhile, Switzerland, France, and the U.K. each gained more than 5%. In contrast, Denmark fell 11.3%, which weighed on the lower end of the group. Overall, Europe delivered broad gains as investors rotated away from crowded U.S. mega caps.
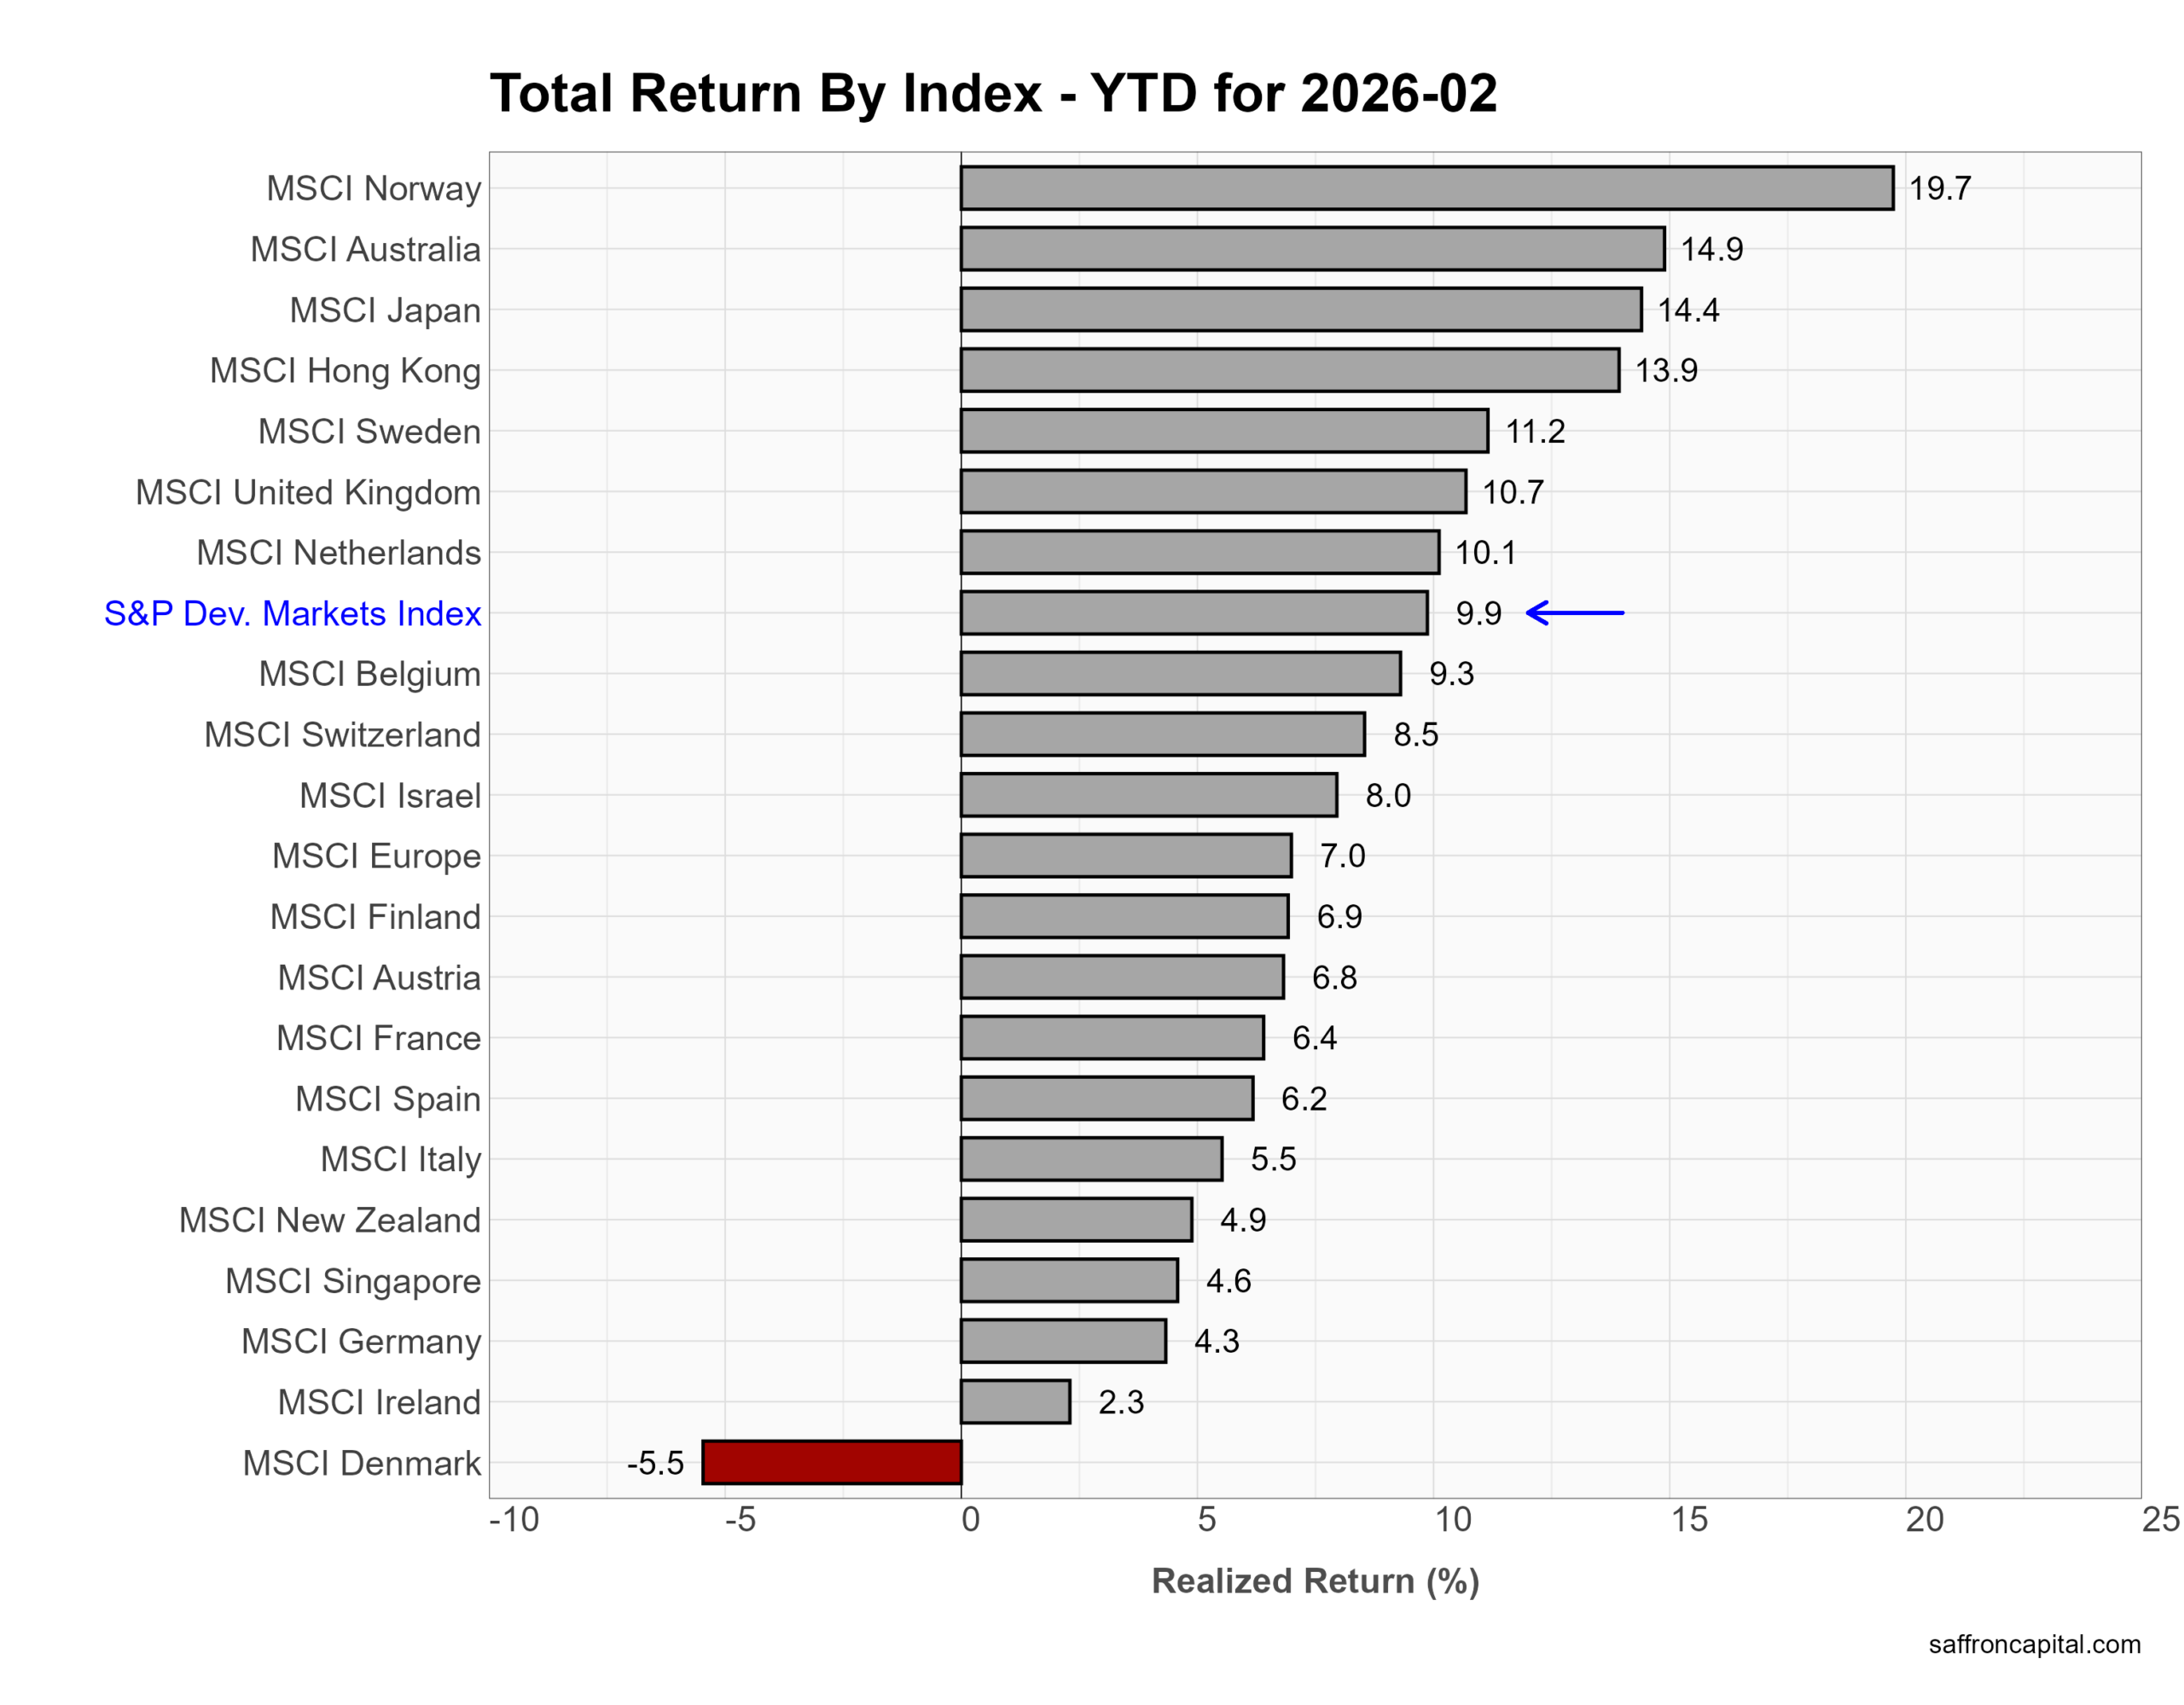
Year to date, leadership remains overseas. Norway surged 19.7%, and Australia and Japan climbed roughly 15%. Hong Kong jumped 13.9%, helped by policy support signals from China. The S&P Developed Markets Index now stands up 9.9%, well ahead of the S&P 500. However, Denmark remains down 5.5% for the year. In short, global diversification paid off in early 2026.
Click to enlarge
Emerging Market Equities
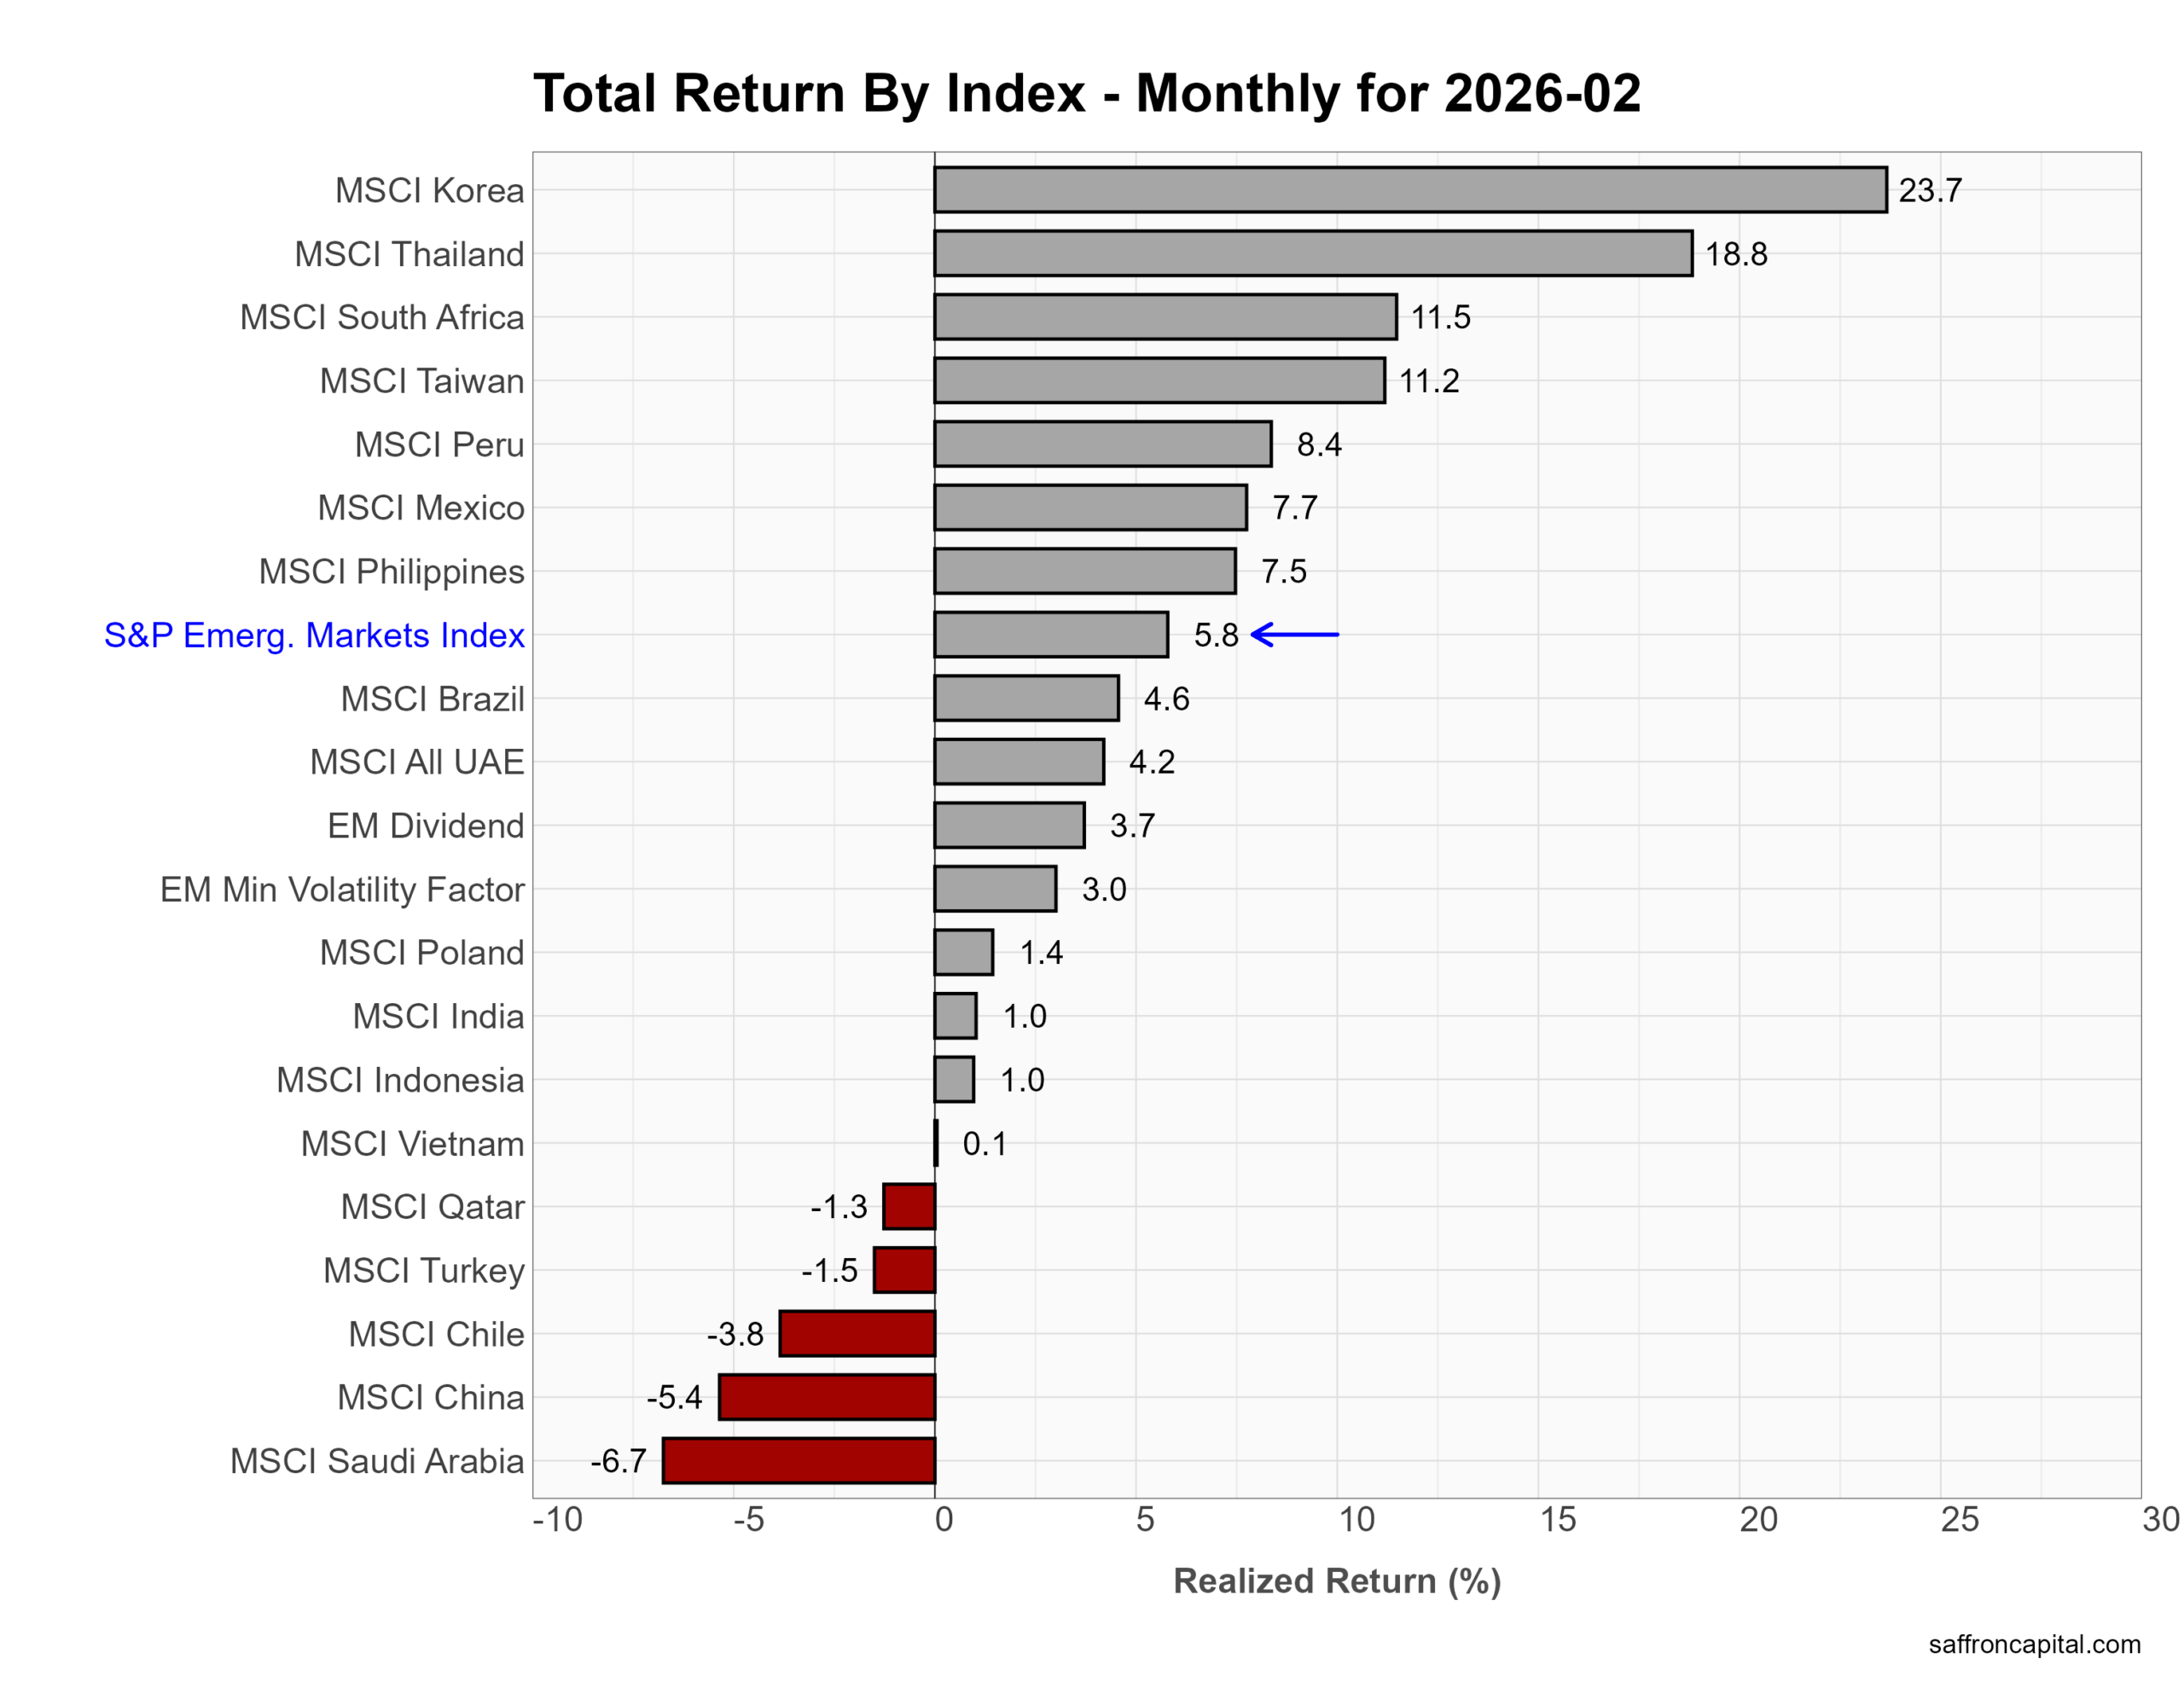
In February, emerging markets delivered strong gains. First, the S&P Emerging Markets Index rose 5.8%, beating many U.S. benchmarks. Korea led with a 23.7% surge as chip stocks rebounded and export data improved. Thailand jumped 18.8%, and South Africa gained 11.5% on firm commodity prices. Taiwan added 11.2%, supported by semiconductor demand. Meanwhile, Peru and Mexico posted solid advances. In contrast, China fell 5.4%, and Saudi Arabia dropped 6.7%, reflecting uneven growth and energy volatility.
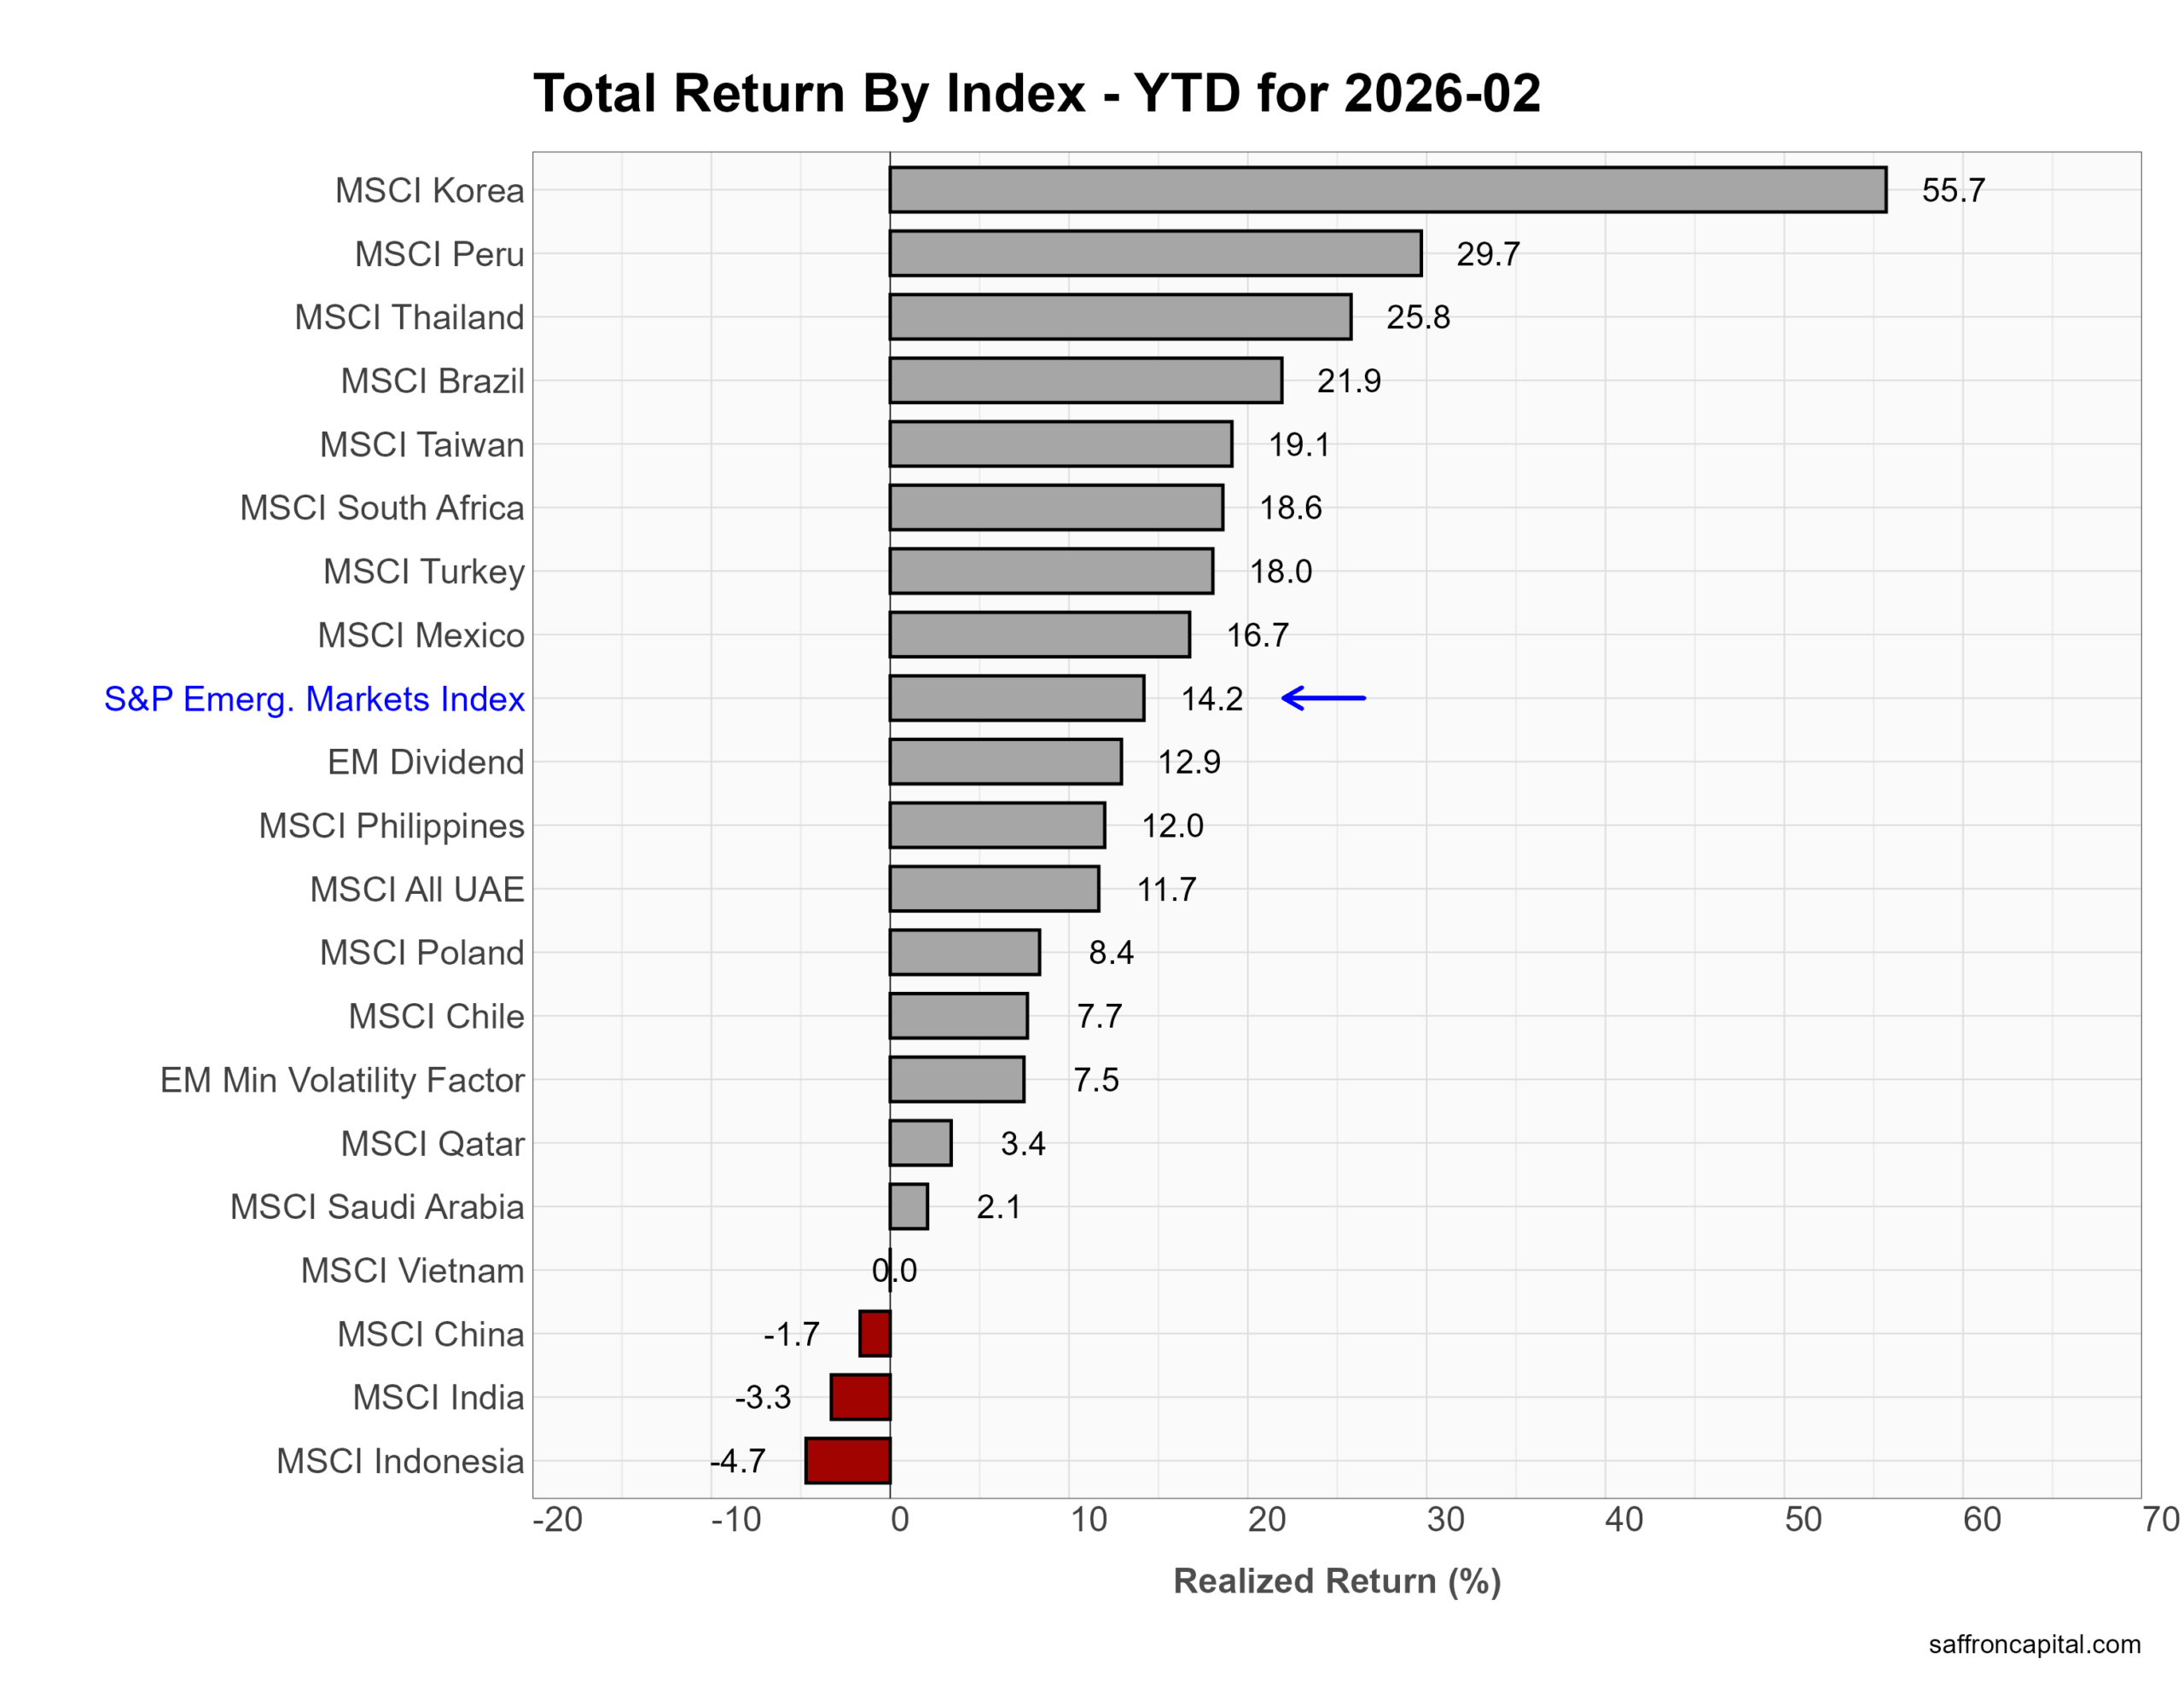
Year to date, leadership remains concentrated in Asia and commodity exporters. Korea soared 55.7%, and Peru climbed 29.7%. Thailand rose 25.8%, and Brazil gained 21.9%. The S&P Emerging Markets Index now stands up 14.2%. However, China remains down 1.7%, while India and Indonesia lag. Overall, 2026 rewards tech exporters and resource-driven economies across emerging markets.
Click to enlarge
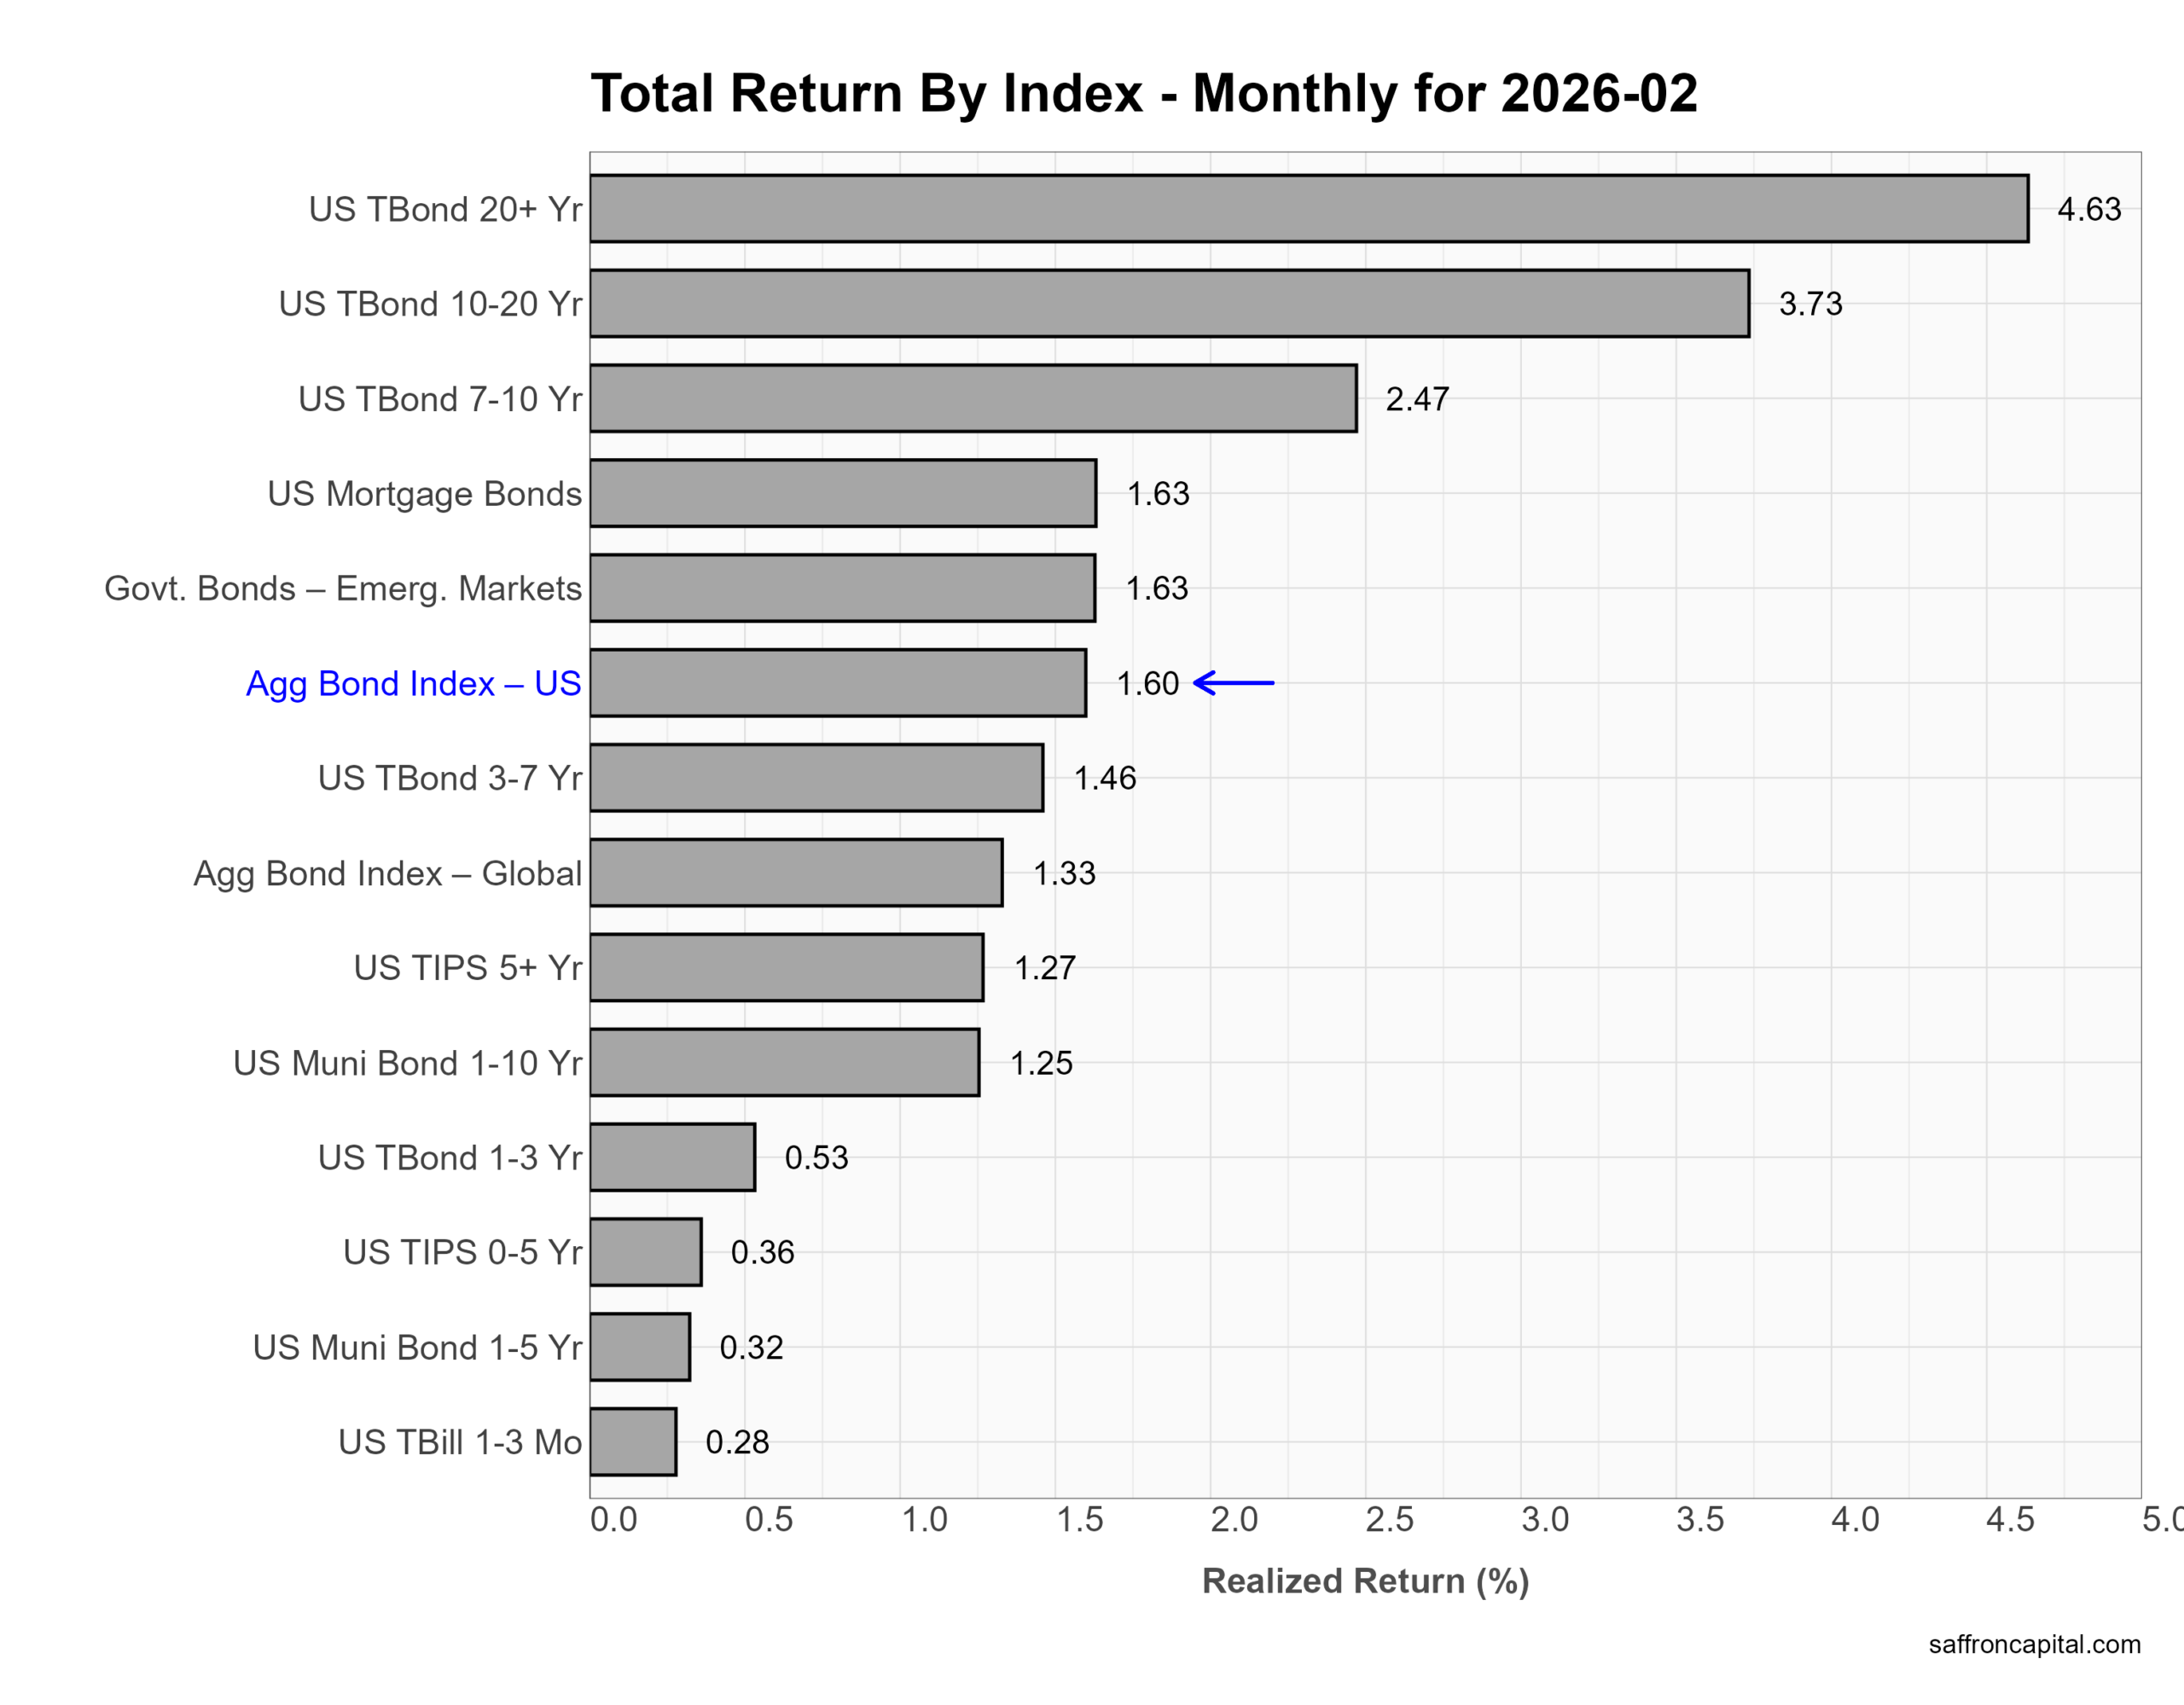
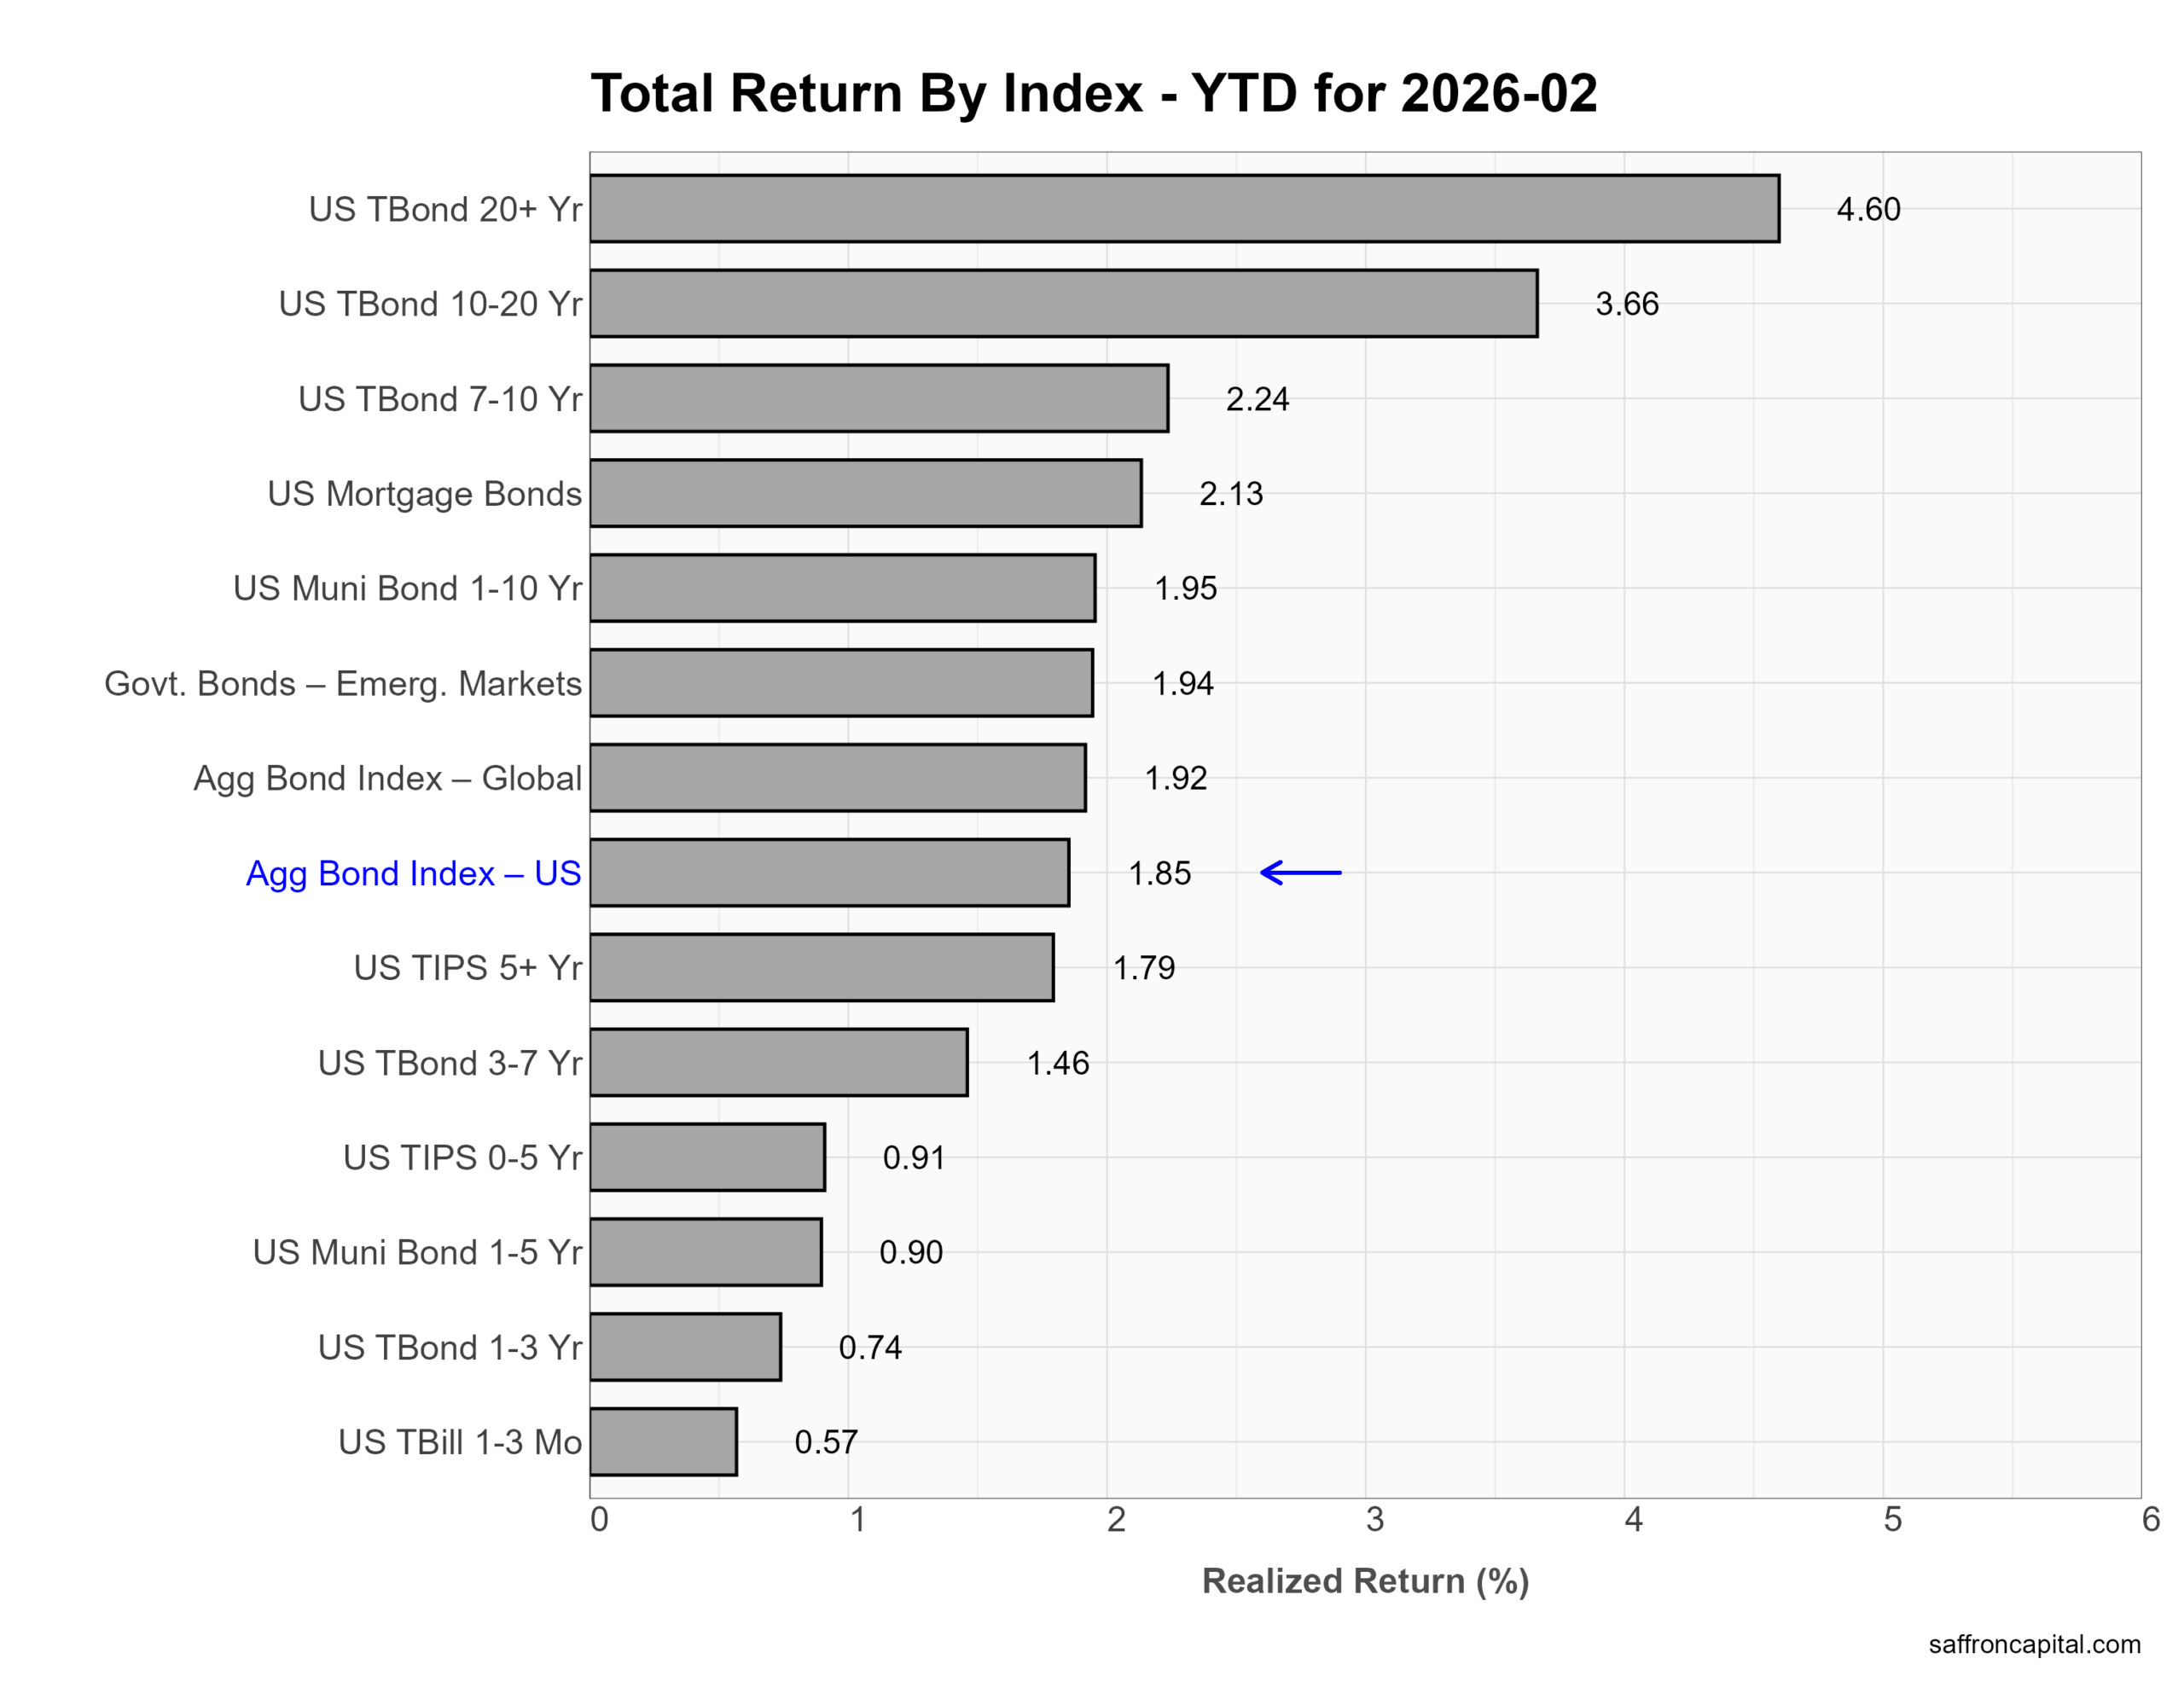
Government Bonds
February returns confirm that duration paid. First, long Treasuries led as yields pulled back on softer growth signals and rising recession talk. US Treasury 20+ Year bonds gained 4.63%, and 10–20 Year Treasuries rose 3.73%. Meanwhile, 7–10 Year bonds added 2.47%. The US Aggregate Bond Index advanced 1.60%. Mortgage bonds and emerging market government debt both returned 1.63%. In contrast, short-term bills rose just 0.28% as rate cuts remain uncertain. Overall, investors moved out the curve and locked in higher yields.
Year to date, the same trend holds. US Treasury 20+ Year bonds lead at 4.60%, followed by 10–20 Year bonds at 3.66%. The US Aggregate Bond Index stands up 1.85%, slightly behind global aggregate bonds at 1.92% and emerging market government debt at 1.94%. TIPS also gained, with 5+ Year TIPS up 1.79%. In short, 2026 favors duration exposure over cash.
Click to enlarge
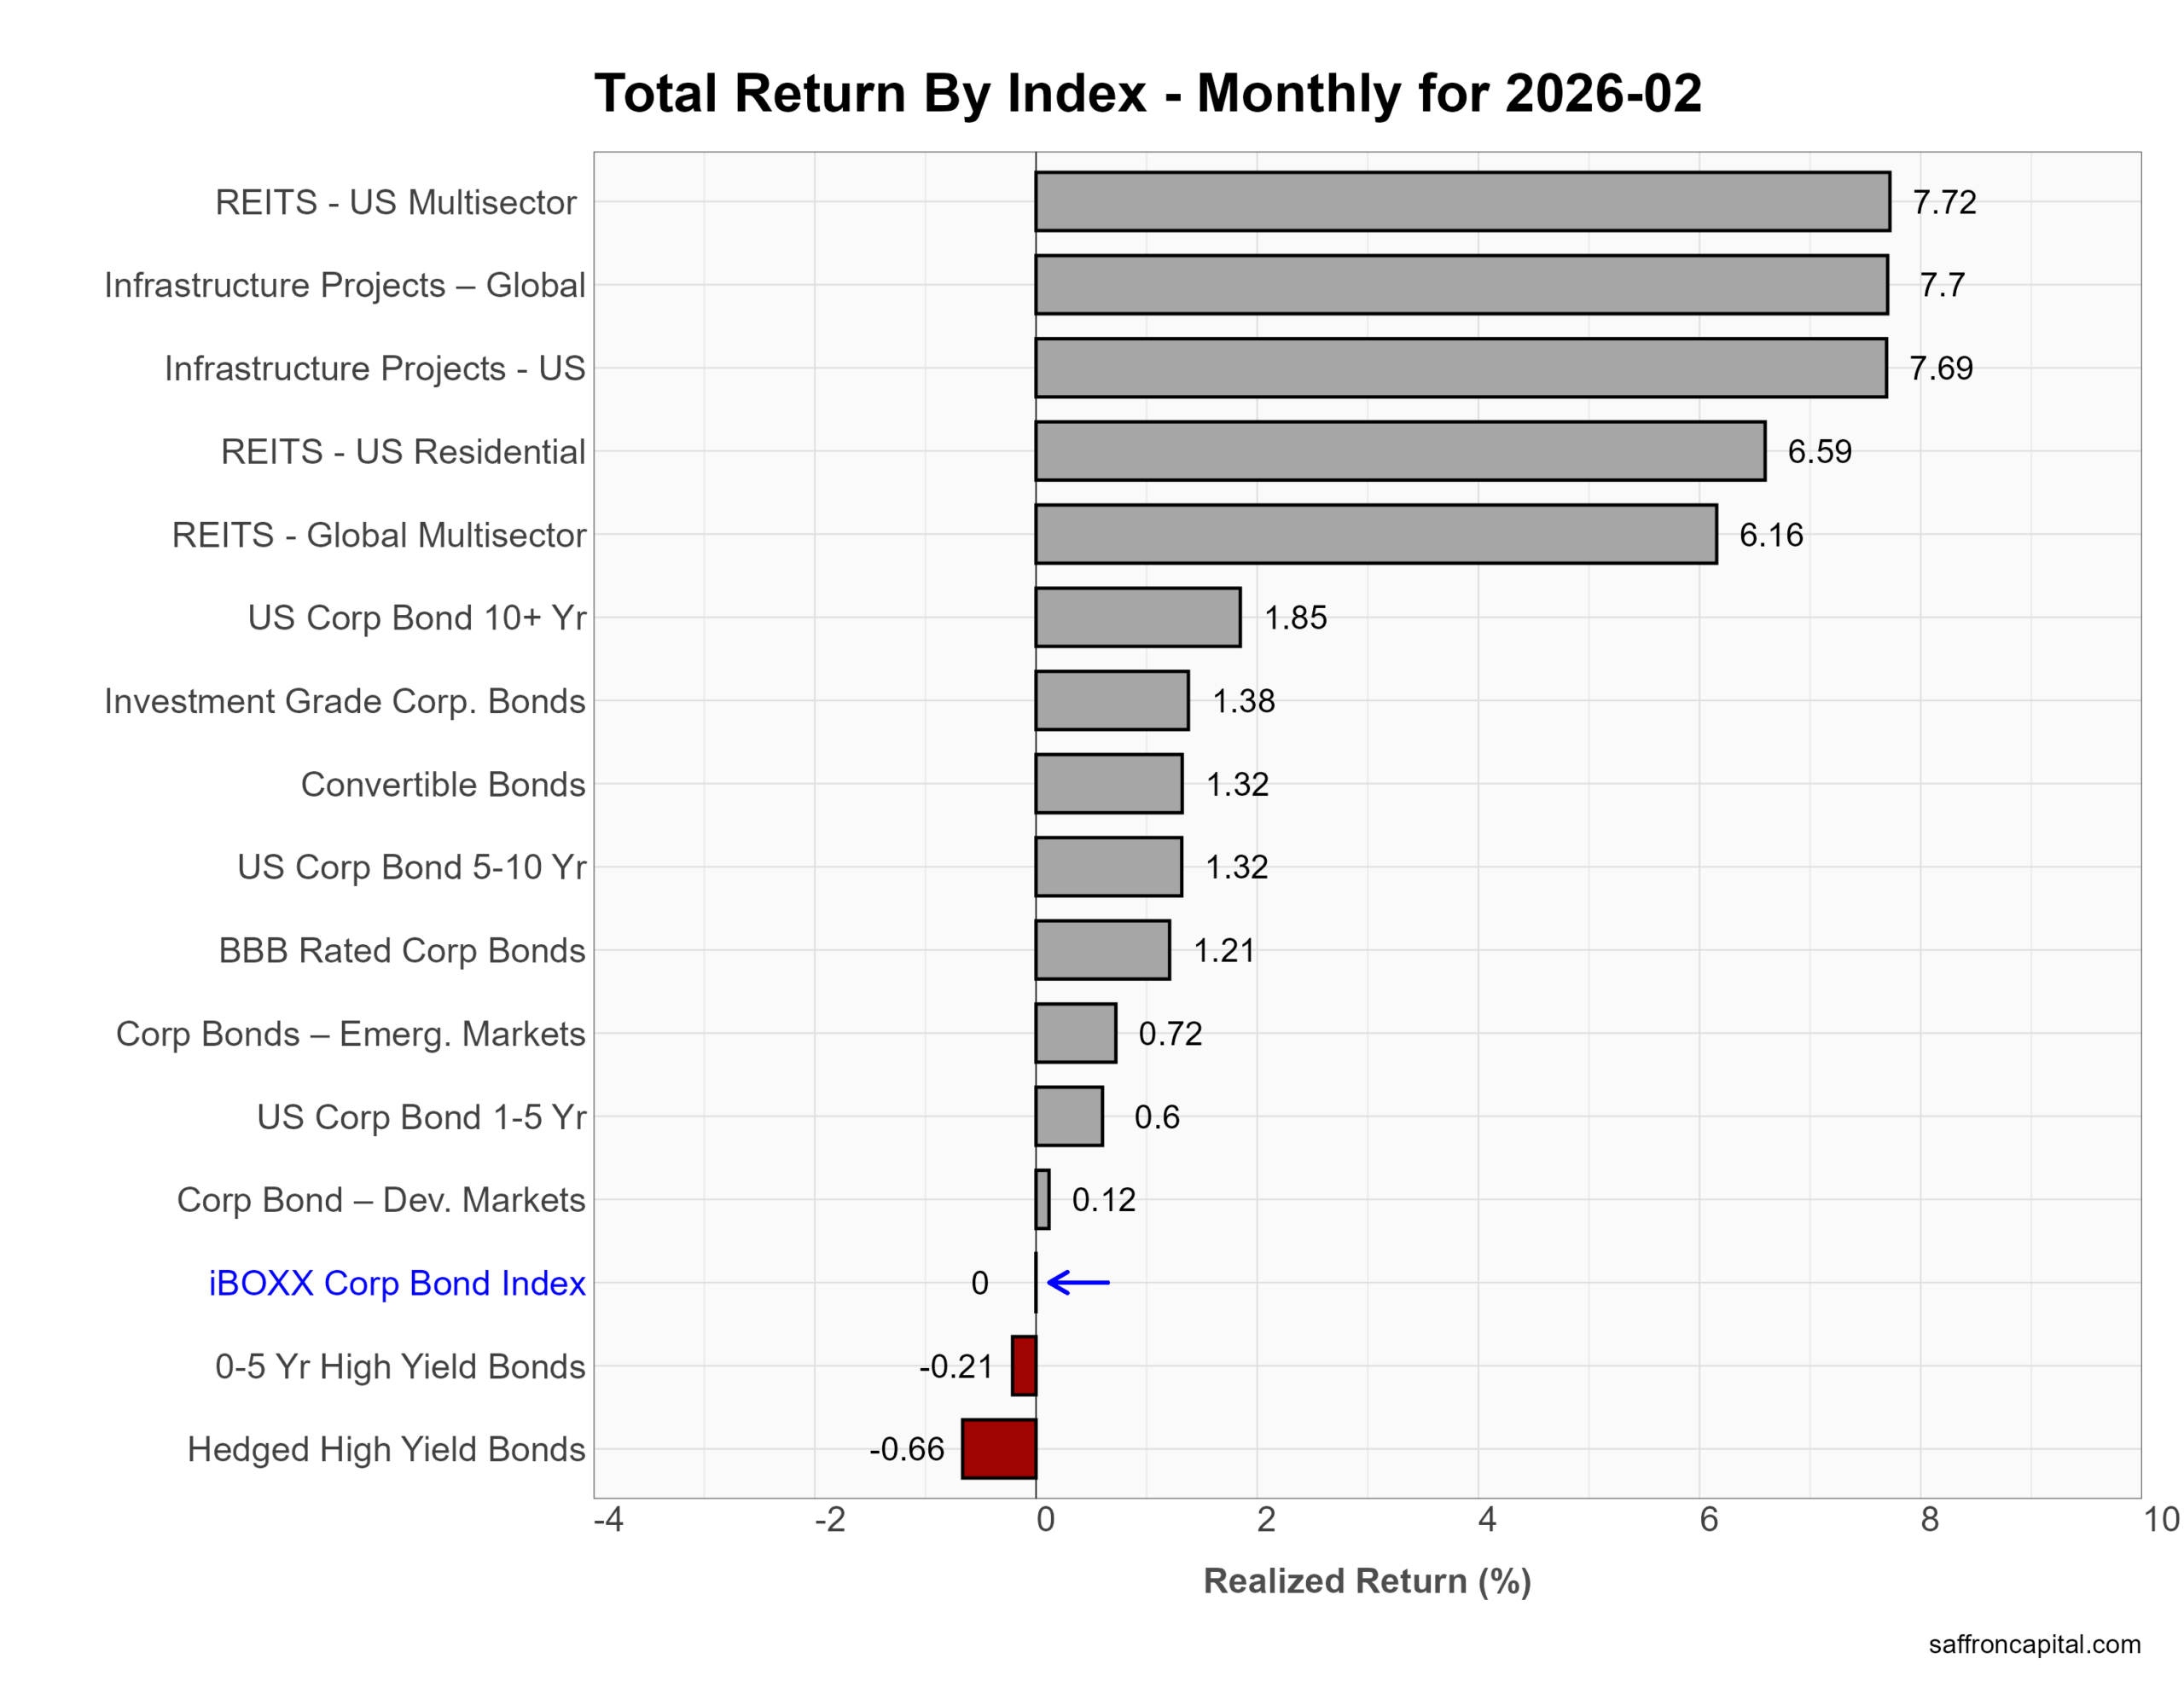
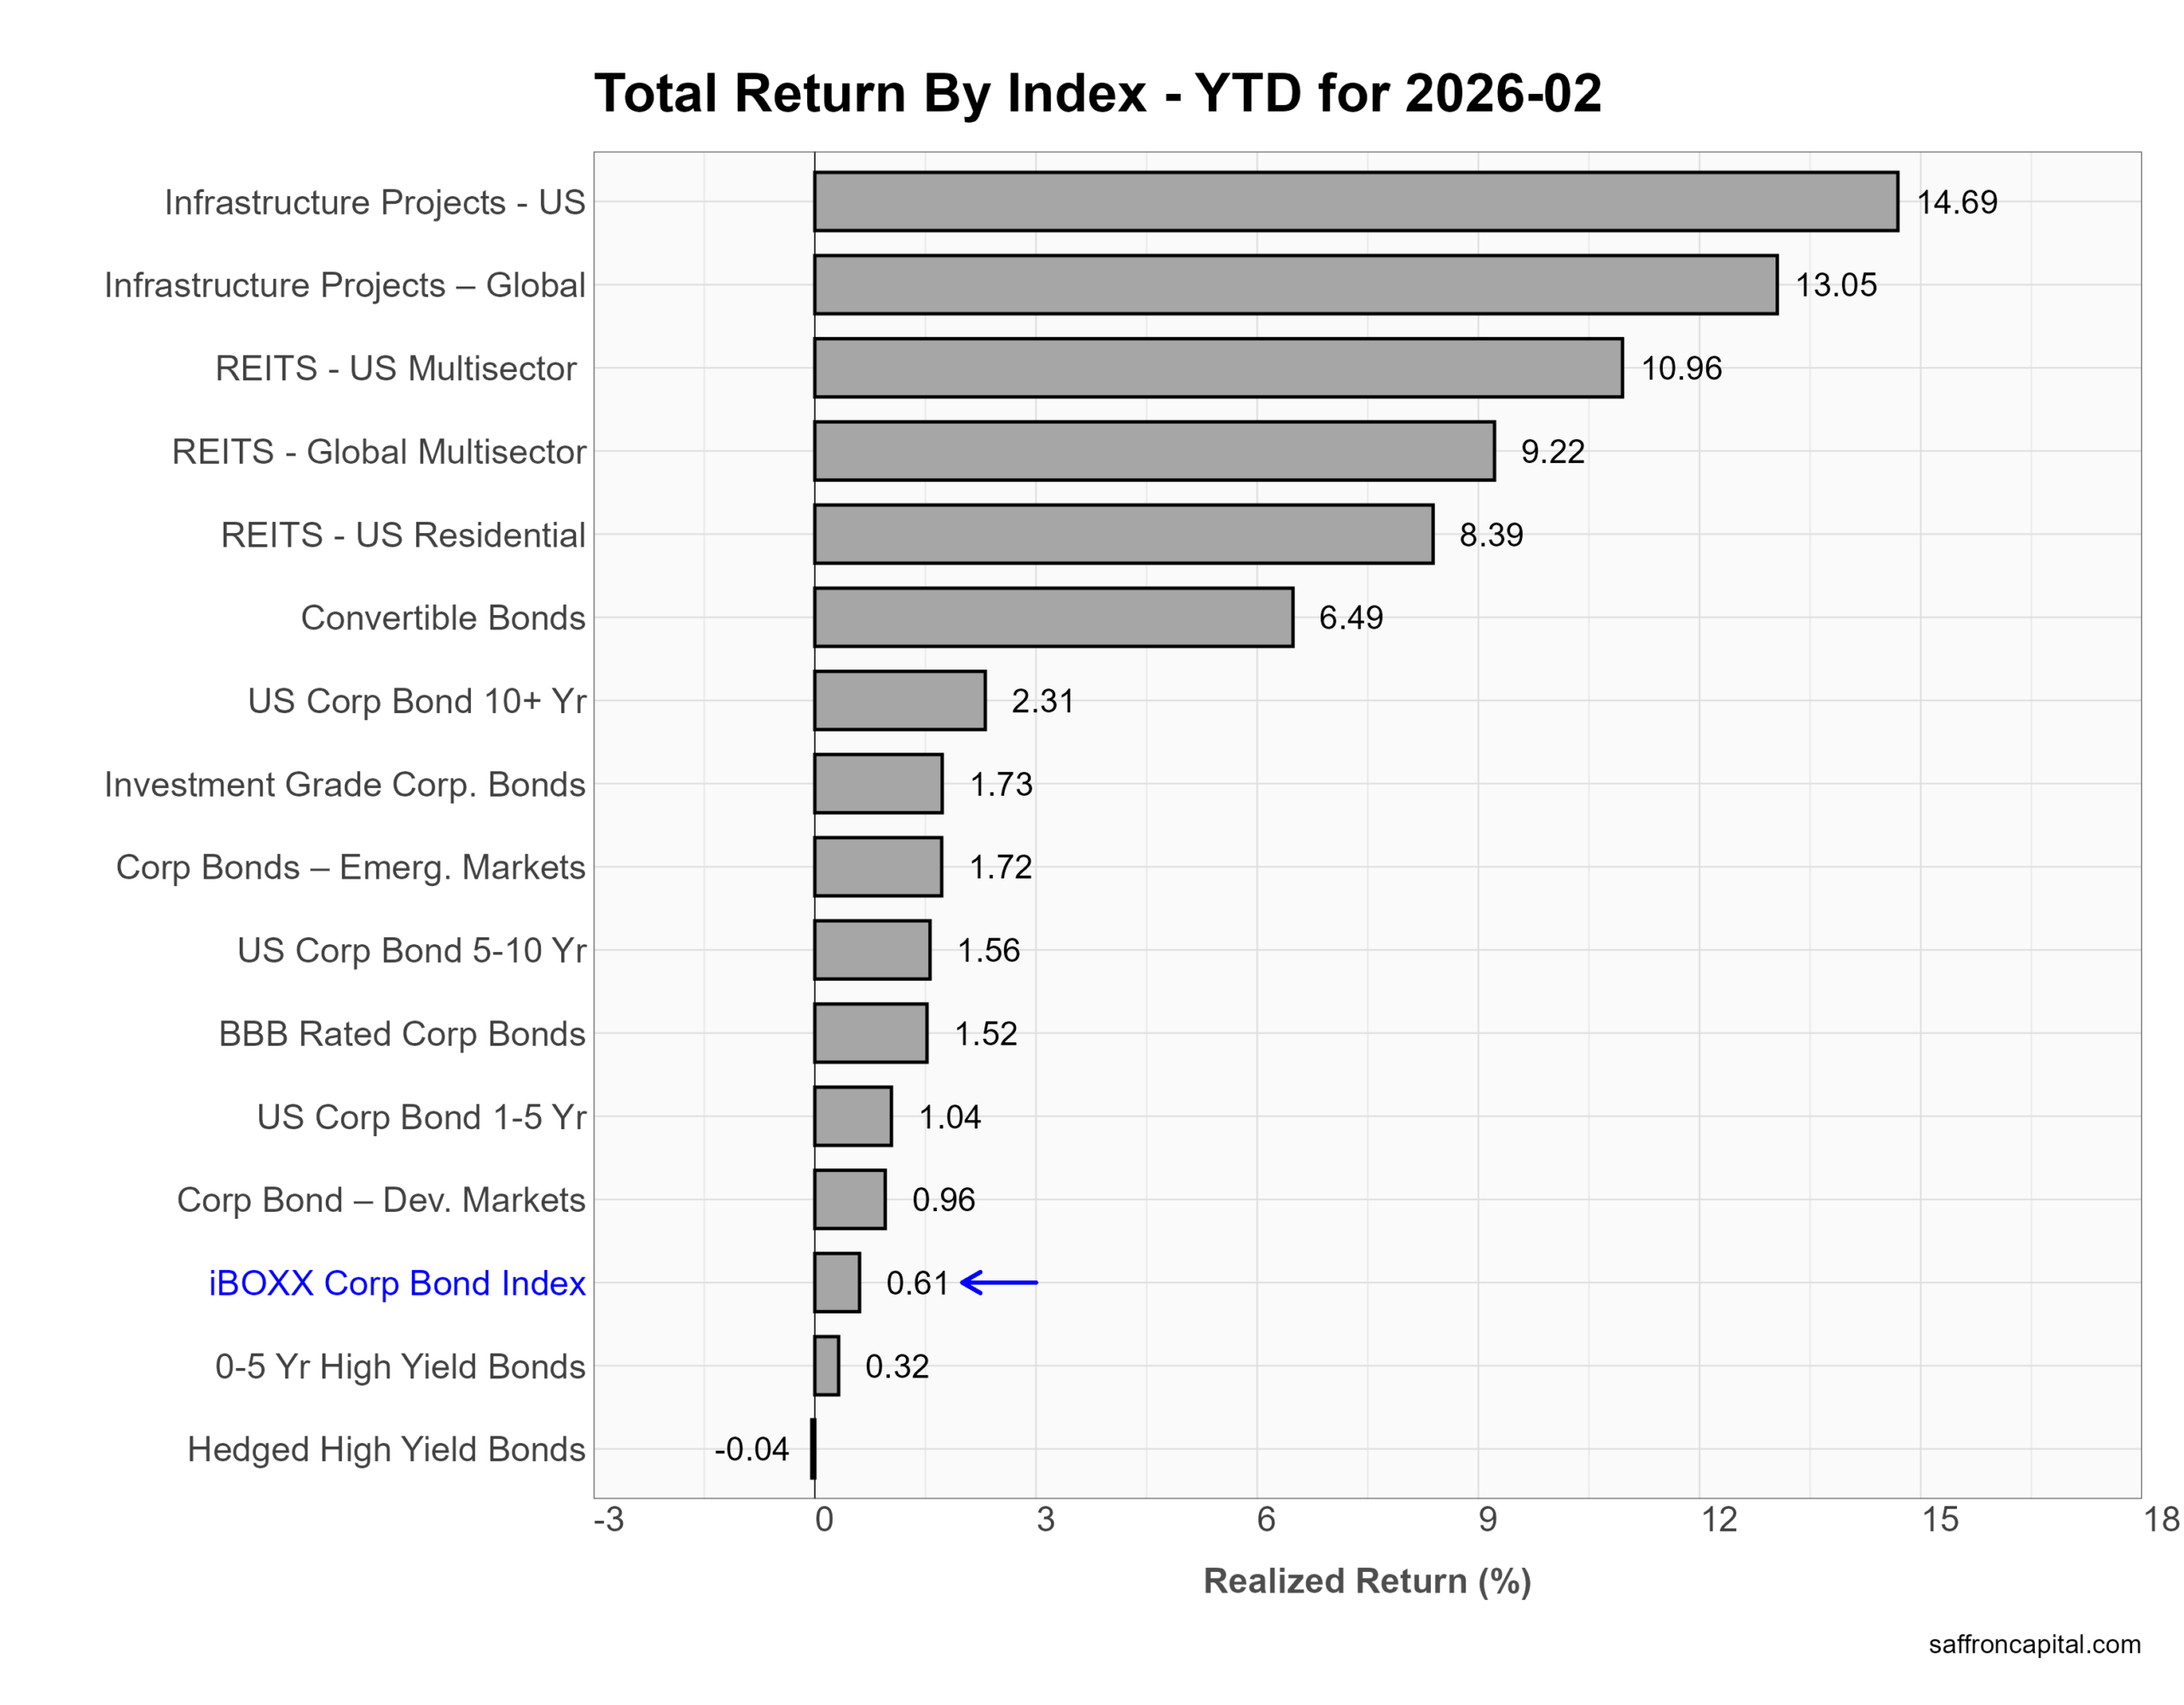
Corporate & Infrastructure Bonds
In February, income assets tied to real estate and infrastructure led corporate portfolios. US Multisector REITs gained 7.72%, while Global Infrastructure Projects rose 7.7% and US Infrastructure Projects added 7.69%. Residential REITs returned 6.59% and Global REITs climbed 6.16%. Traditional credit delivered modest gains. US Corporate Bonds 10+ Year advanced 1.85%, Investment Grade Corporates rose 1.38%, and BBB-rated bonds gained 1.21%. The broad iBOXX Corporate Bond Index was flat for the month (0.0%). High yield lagged, with 0–5 Year High Yield down -0.21% and Hedged High Yield off -0.66%. Lower Treasury yields helped rate-sensitive sectors, while tighter spreads supported longer-duration credit.
Year to date, infrastructure remains the leader. US Infrastructure Projects are up 14.69%, and Global Infrastructure Projects have gained 13.05%. US Multisector REITs are ahead 10.96%, followed by Global REITs at 9.22% and US Residential REITs at 8.39%. Convertible Bonds have returned 6.49%, benefiting from equity volatility and selective growth exposure. Core credit is positive but modest. The iBOXX Corporate Bond Index is up 0.61%, Investment Grade Corporates 1.73%, and Emerging Market Corporate Bonds 1.72%. High yield remains muted, with 0–5 Year High Yield up 0.32% and Hedged High Yield slightly negative at -0.04%. Overall, 2026 favors duration and asset-backed income over lower-quality credit.
Click to enlarge
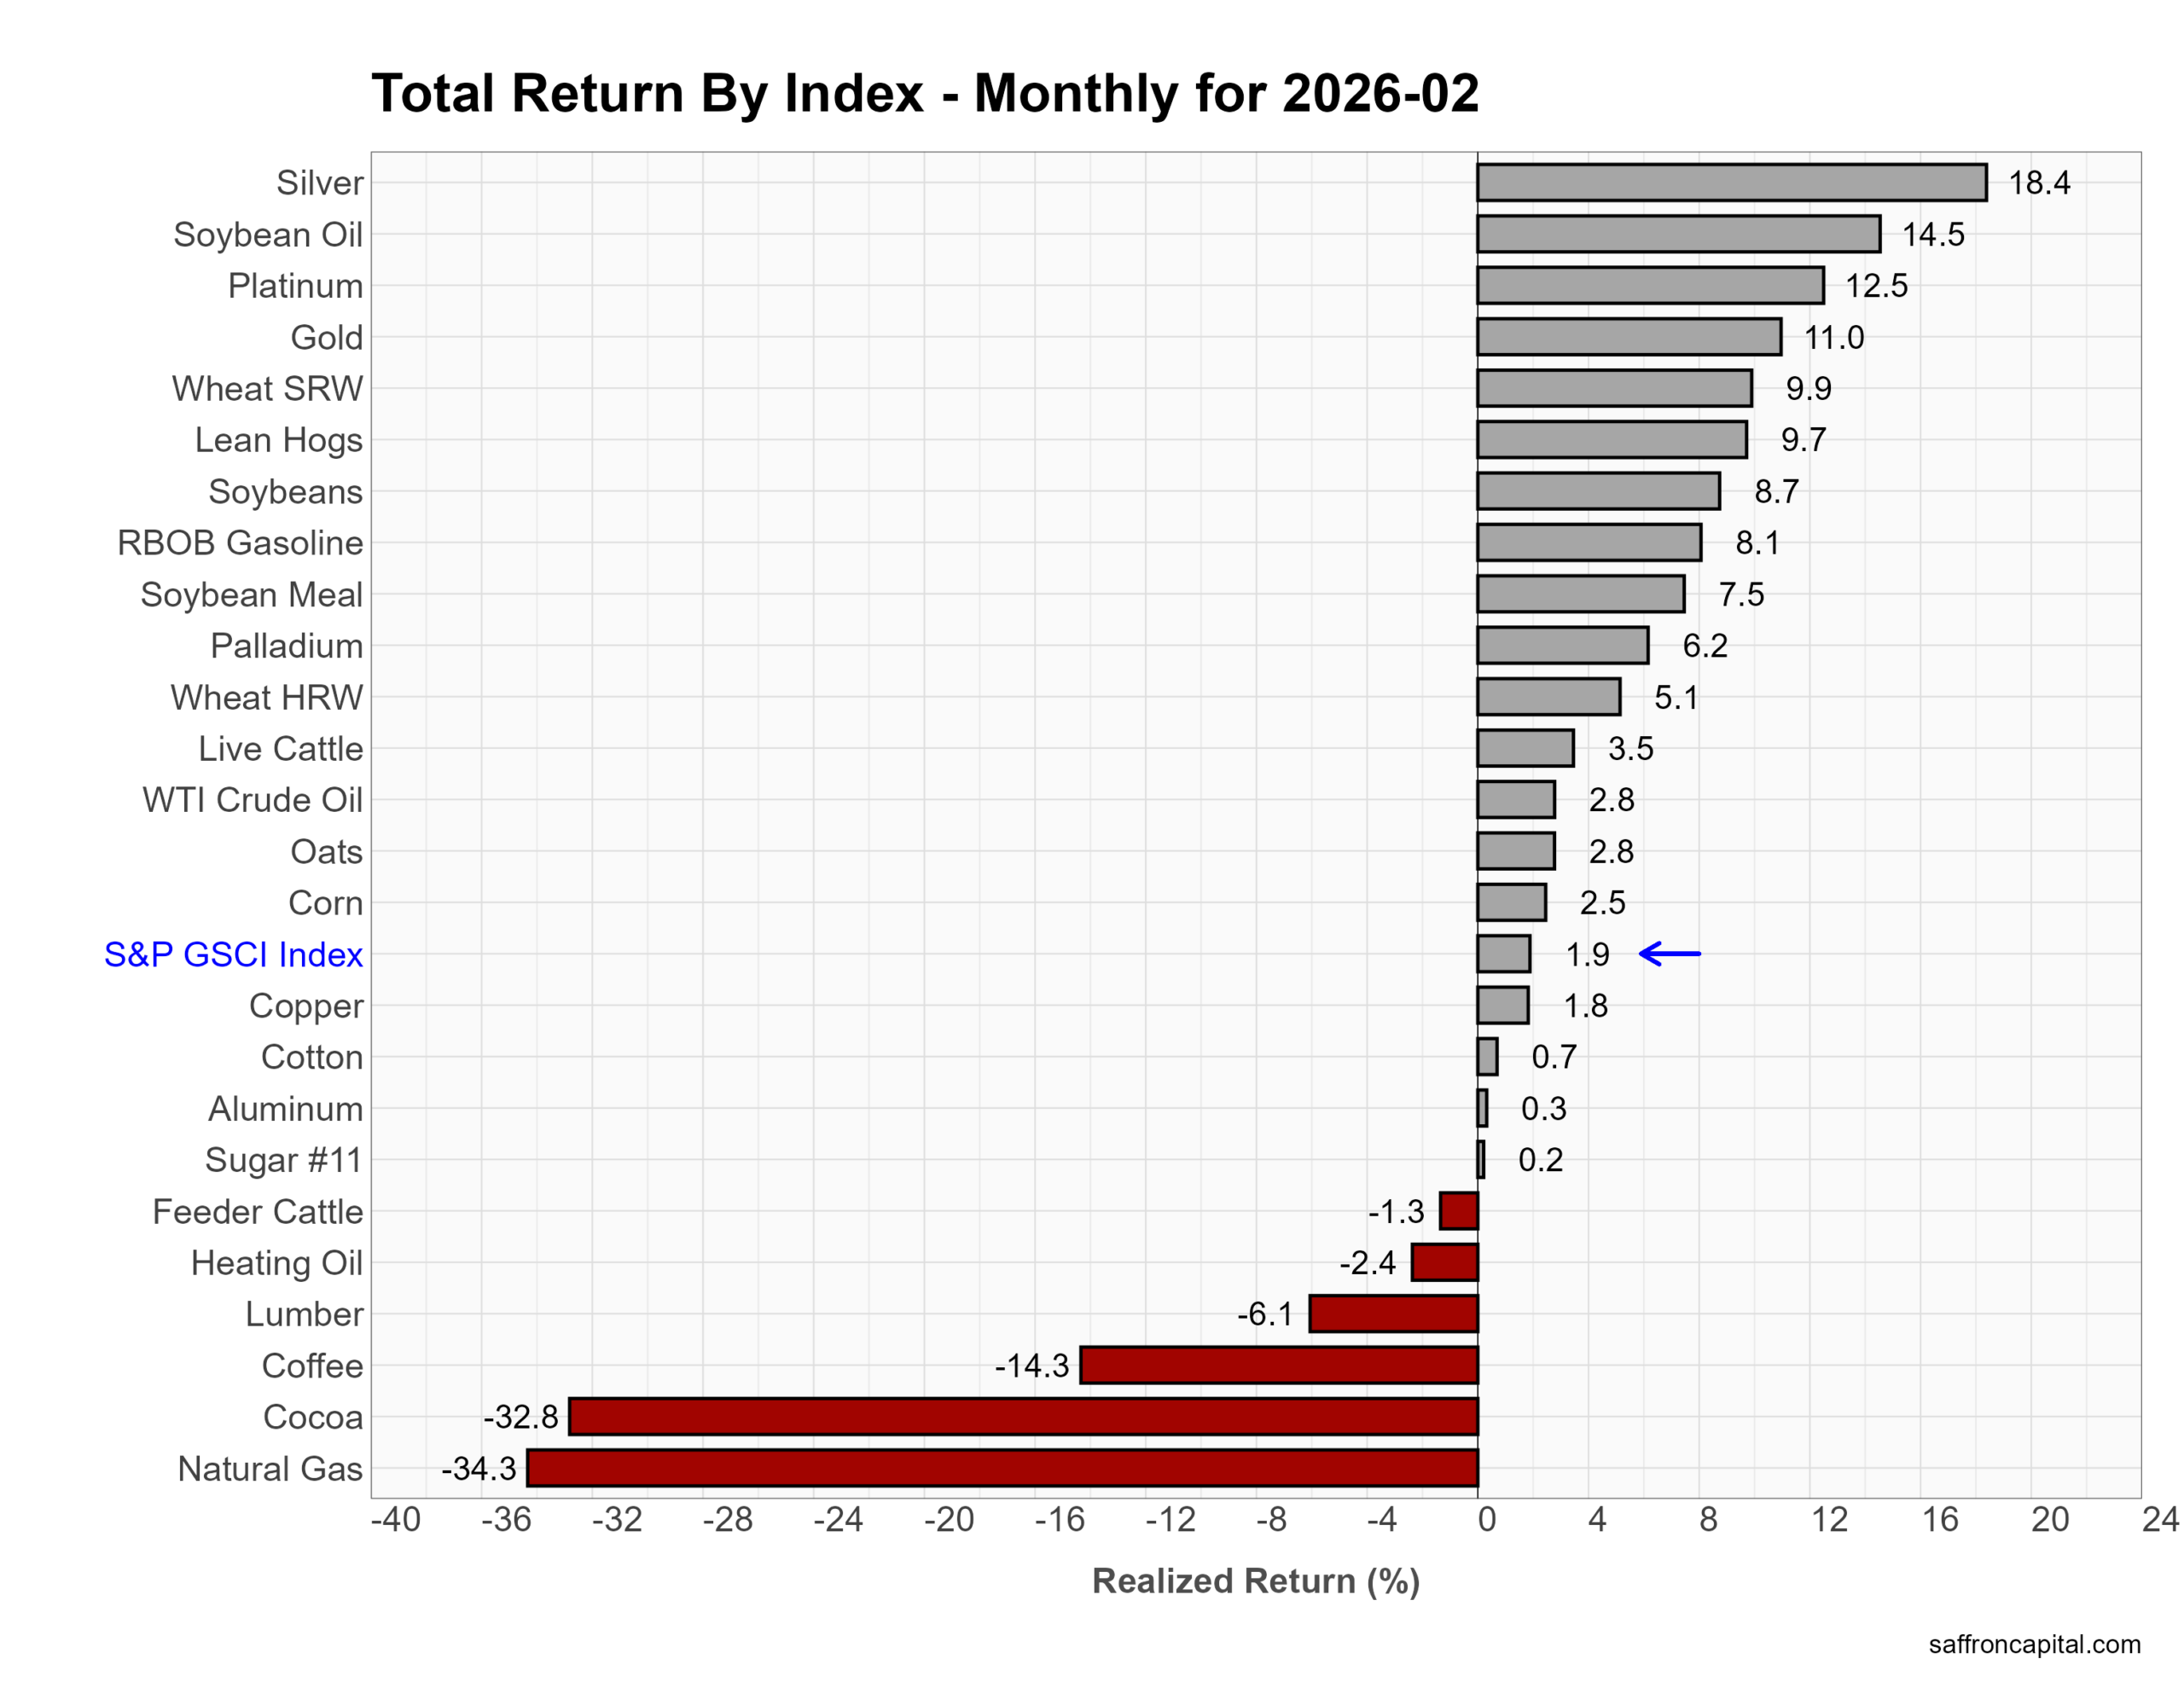
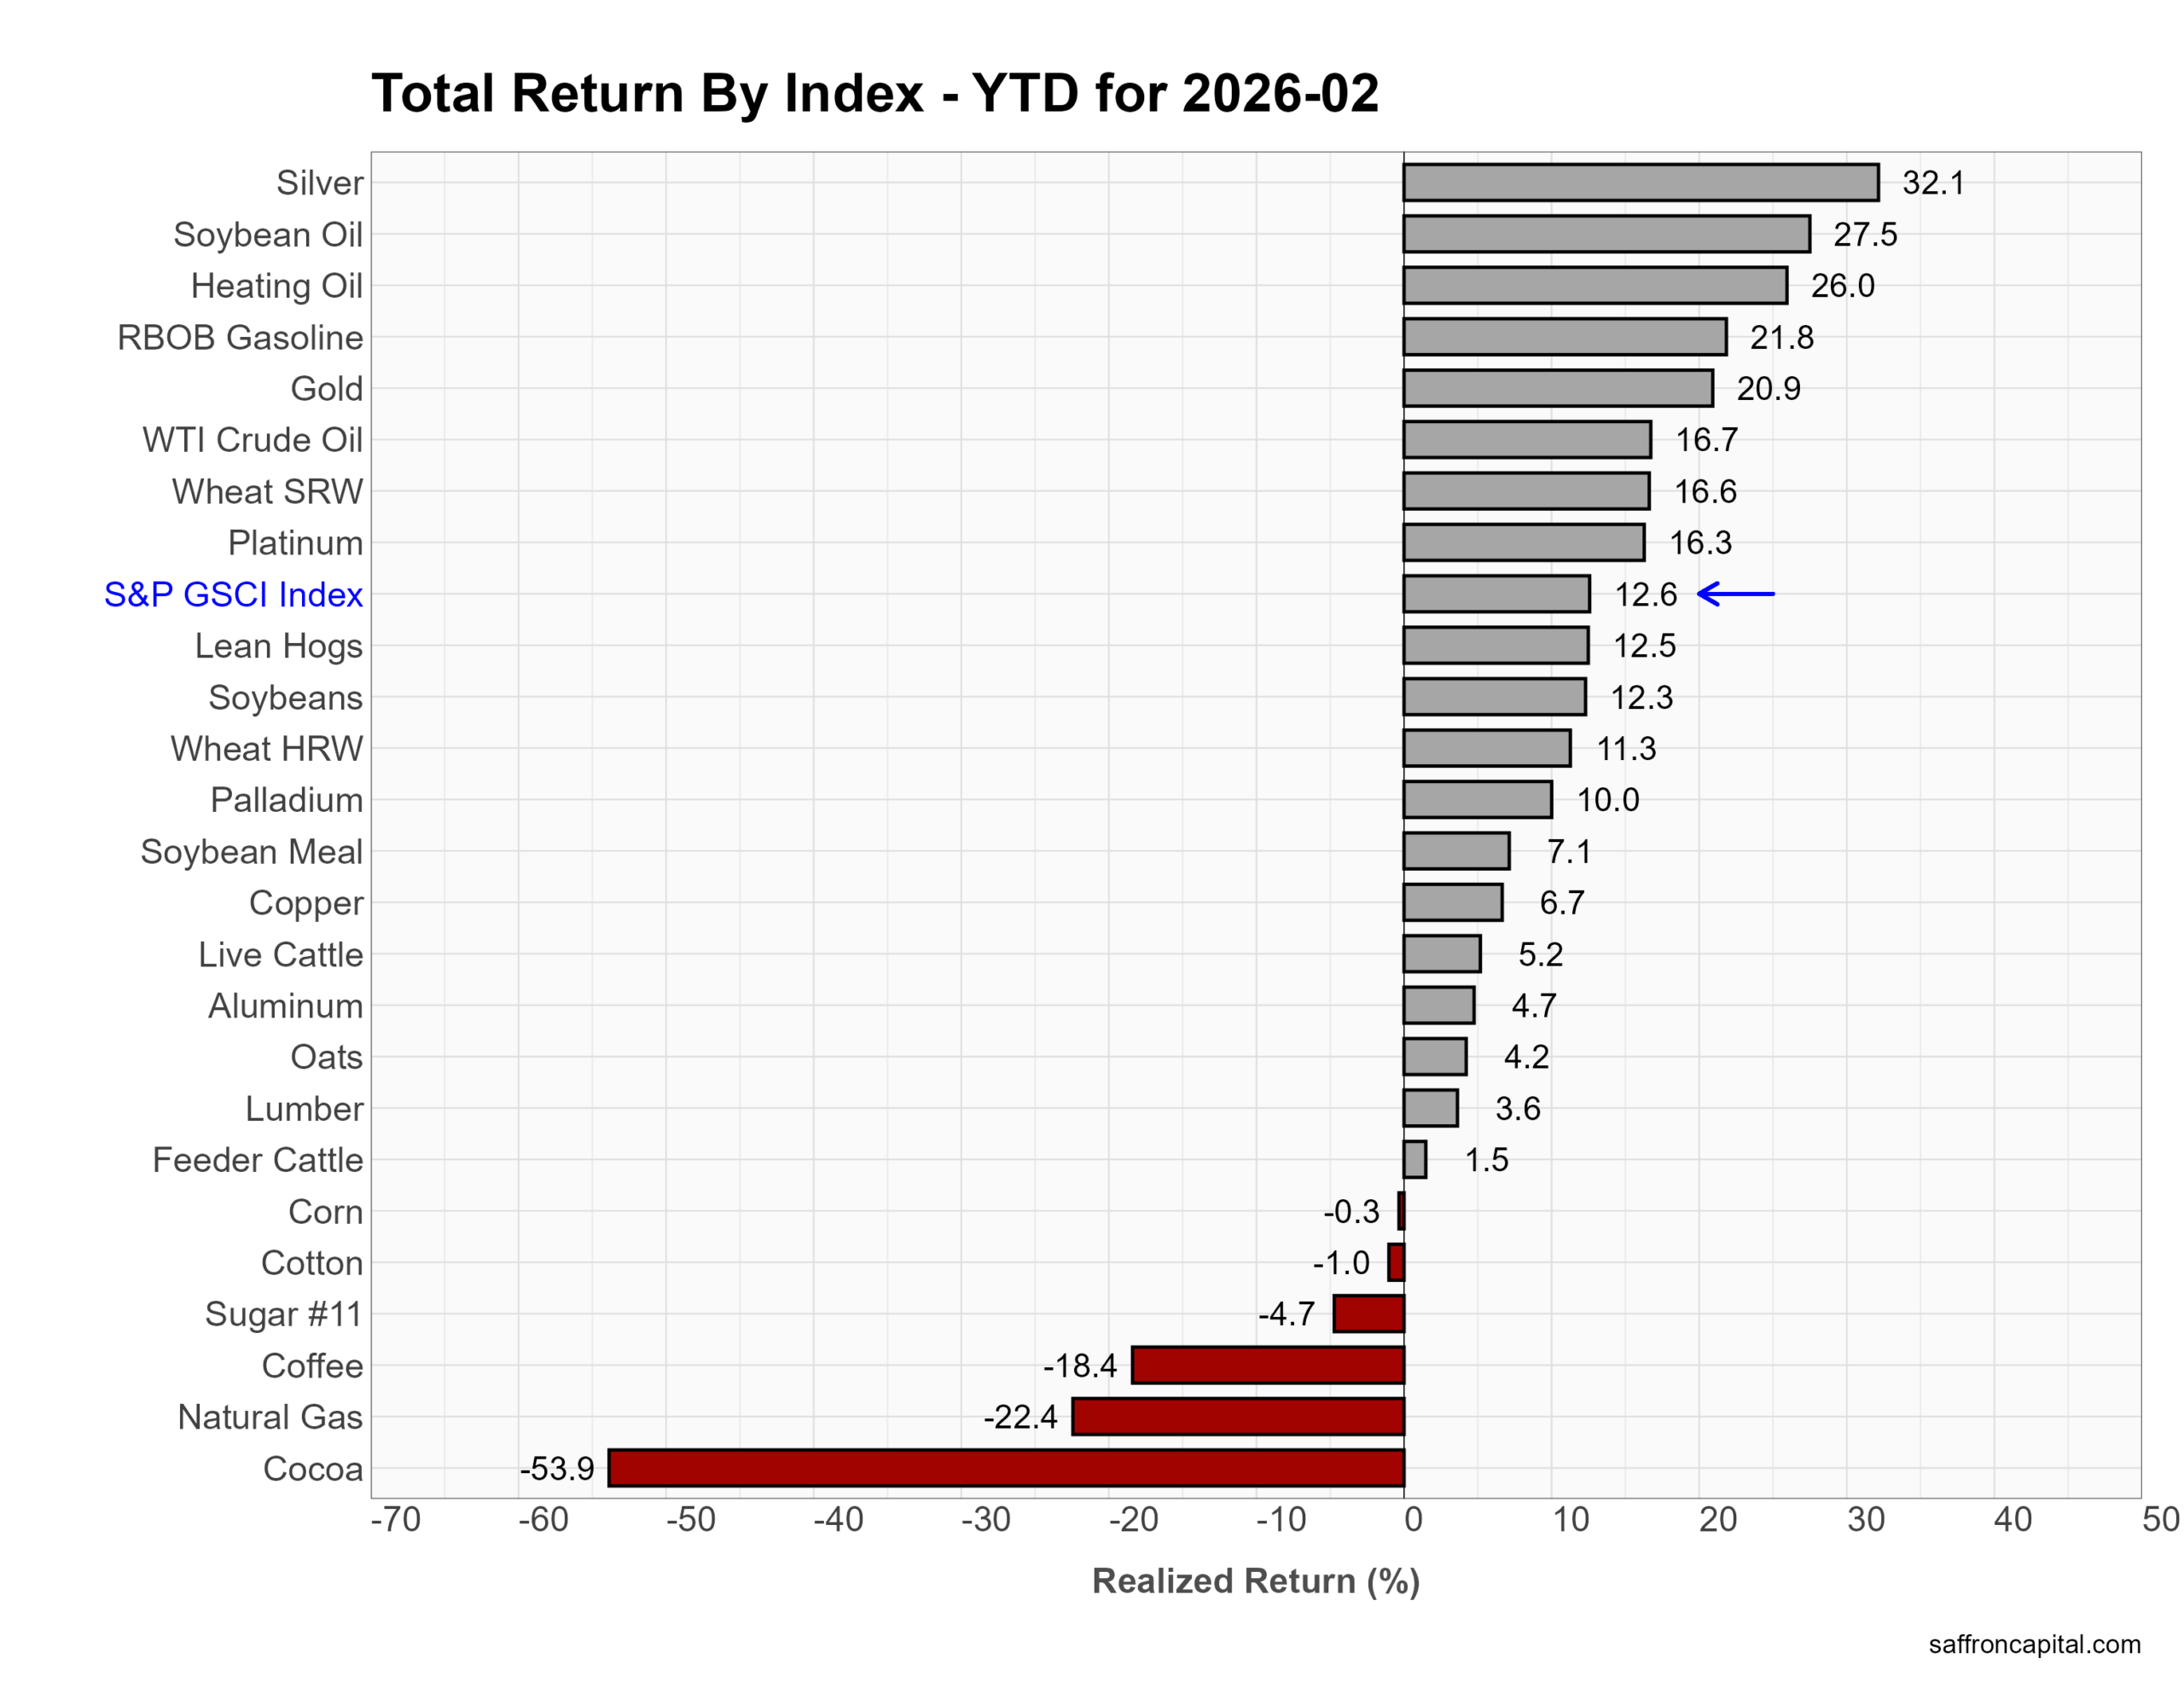
Commodities
In February, commodities rebounded. The S&P GSCI Index gained 1.9% for the month. Precious metals led. Silver surged 18.4%, platinum rose 12.5%, and gold advanced 11.0%. Energy was mixed. RBOB gasoline gained 8.1% and WTI crude added 2.8%, but natural gas plunged 34.3% as warmer weather and high storage levels pressured prices. Agricultural markets were volatile. Soybean oil jumped 14.5%, wheat (SRW) gained 9.9%, and lean hogs rose 9.7%. In contrast, coffee fell 14.3% and cocoa dropped 32.8% after sharp prior gains and signs of easing supply fears. Overall, metals strength offset weakness in soft commodities and gas.
Year to date, the complex remains firmly positive. The S&P GSCI is up 12.6%. Silver leads at 32.1%, followed by soybean oil at 27.5%, heating oil at 26.0%, and gasoline at 21.8%. Gold has gained 20.9%, supported by central bank buying, geopolitical tensions, and lower real yields. Industrial metals and grains show steady advances, with copper up 6.7% and wheat (SRW) up 16.6%. The laggards are cocoa (-53.9%), natural gas (-22.4%), and coffee (-18.4%), reflecting supply normalization and shifting weather patterns. In 2026, leadership has shifted toward precious metals and refined fuels, while soft commodities correct earlier extremes.
Click to enlarge
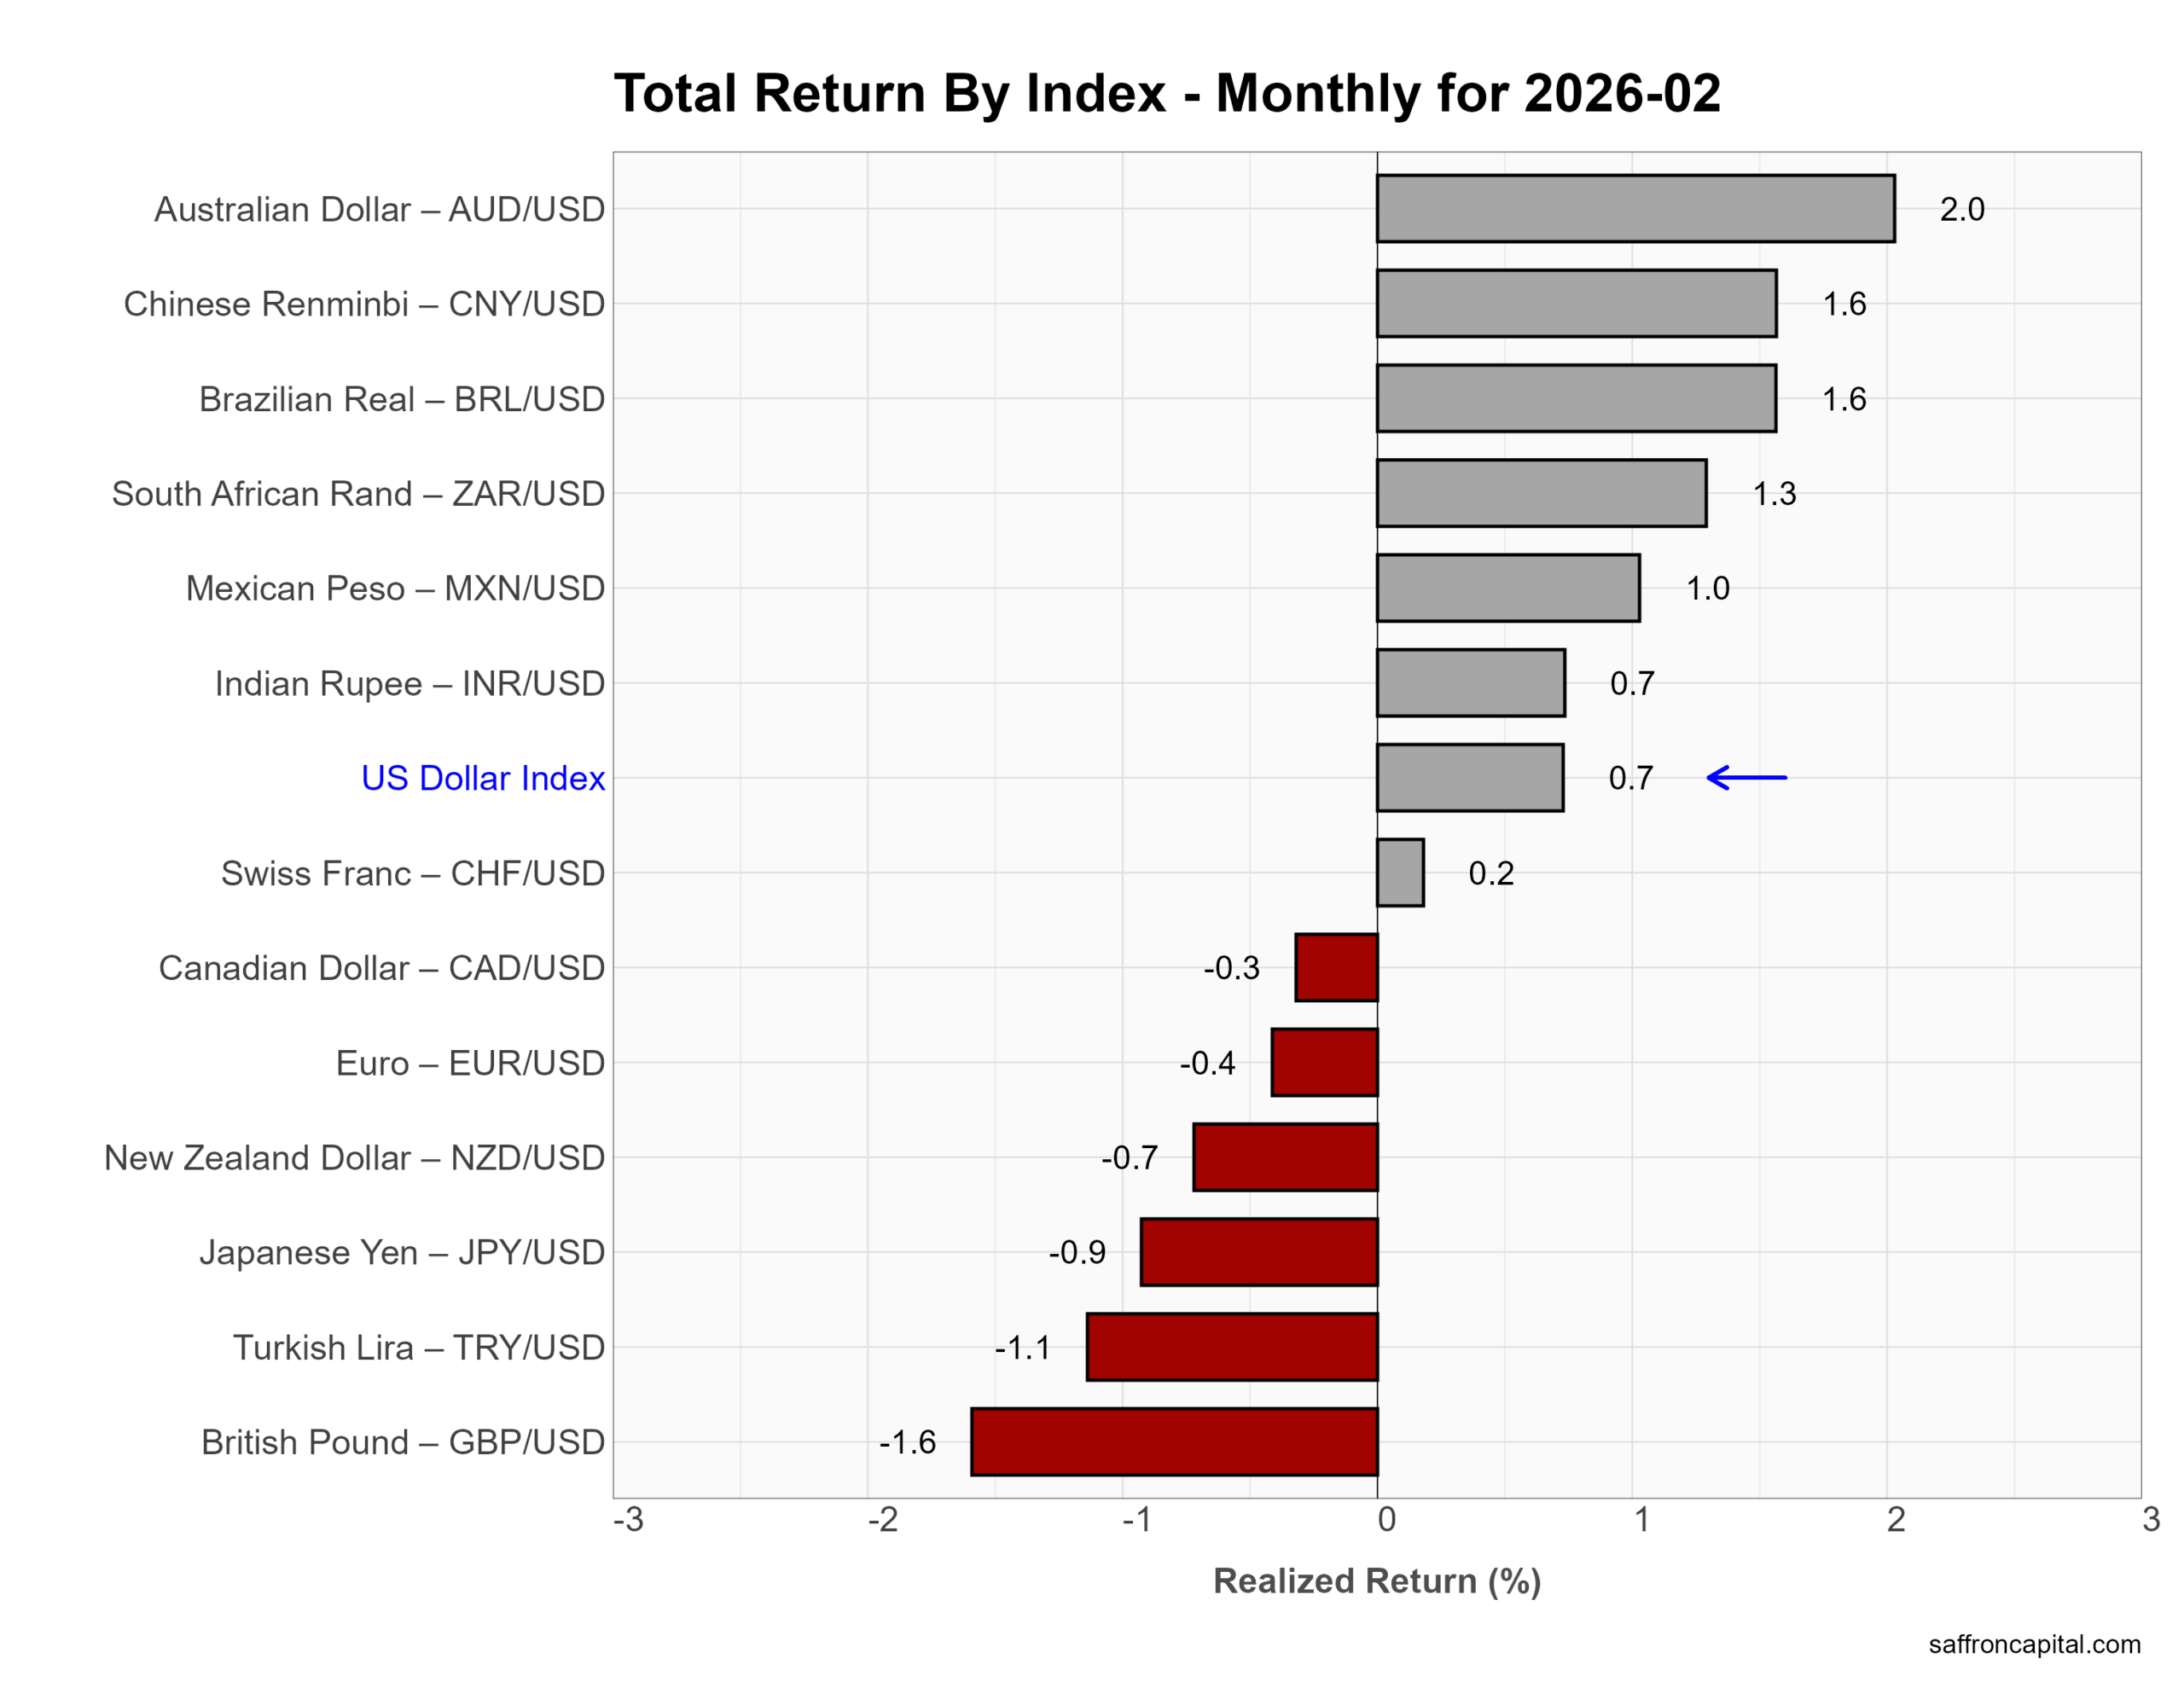
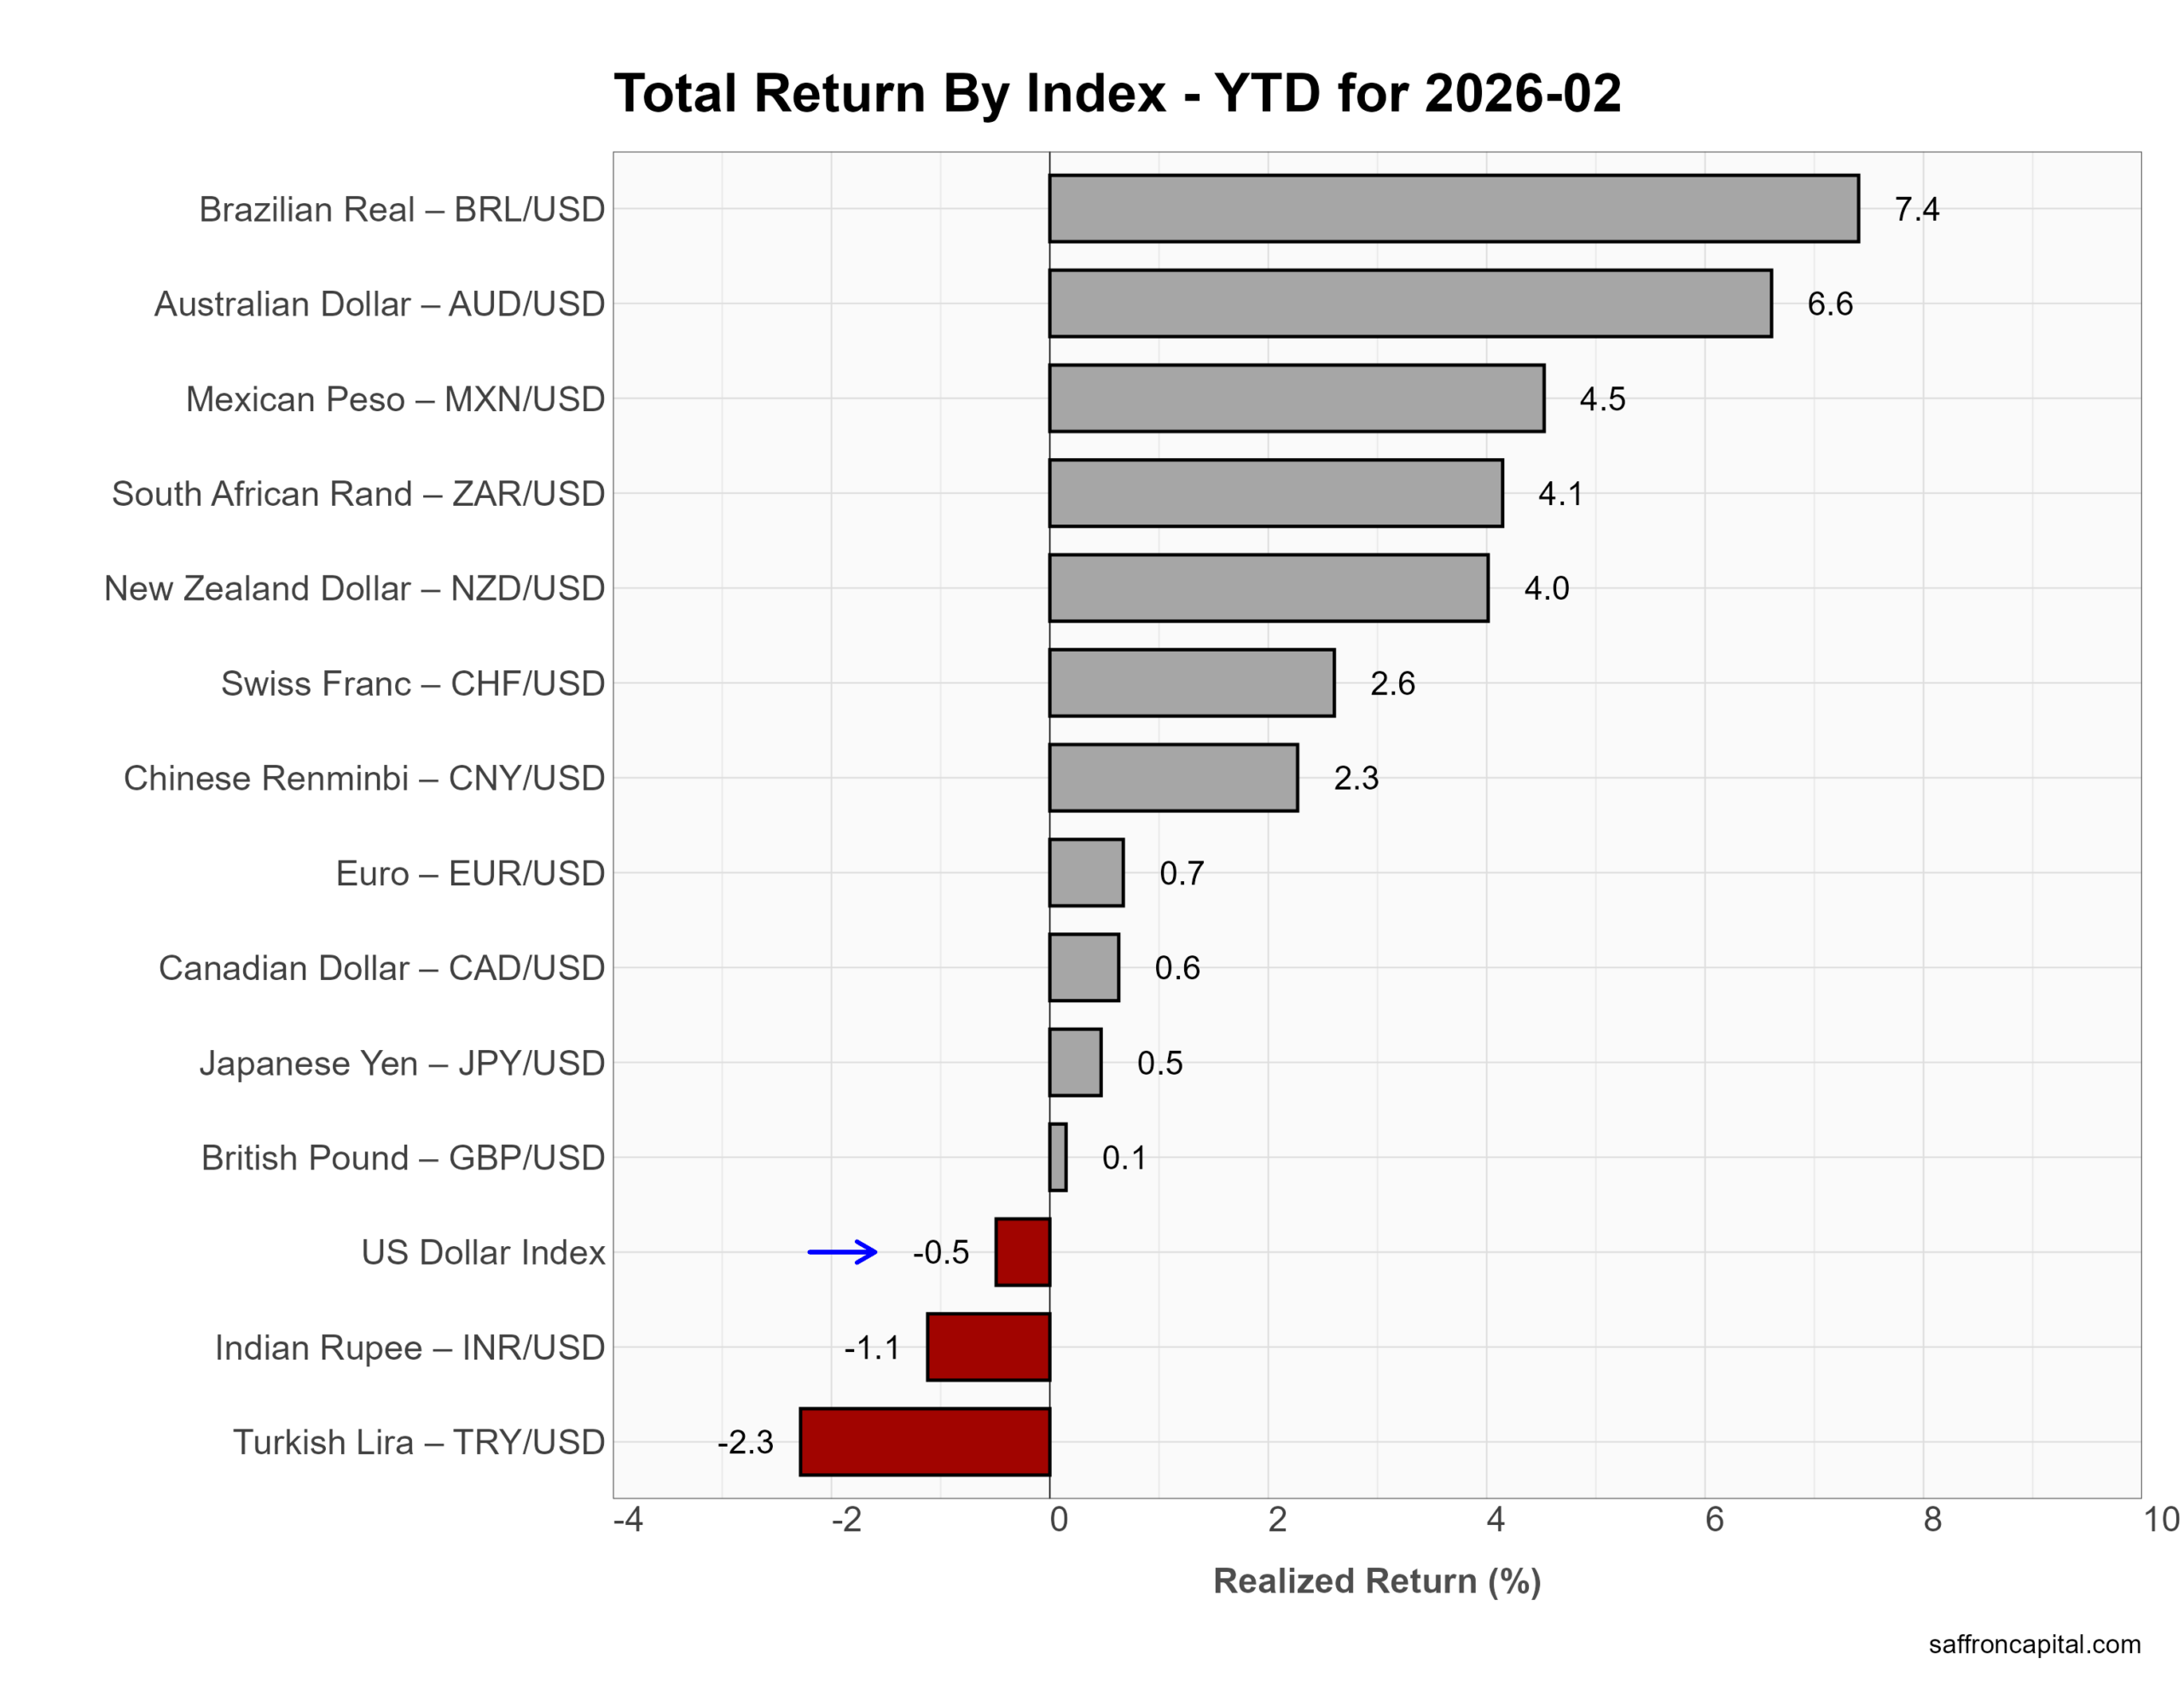
Currencies
In February, the US Dollar firmed modestly. The US Dollar Index rose 0.7% for the month. Commodity-linked and emerging market currencies led gains. The Australian dollar advanced 2.0%, while the Brazilian real and Chinese renminbi each gained 1.6%. The South African rand rose 1.3% and the Mexican peso added 1.0%. In contrast, developed European currencies lagged. The British pound fell 1.6%, the Japanese yen declined 0.9%, and the euro slipped 0.4%. The move reflects steady US yields and relative growth resilience in the US compared with Europe and Japan.
Year to date, the dollar has softened. The US Dollar Index is down 0.5% in 2026. The strongest performers are the Brazilian real (+7.4%) and Australian dollar (+6.6%), followed by the Mexican peso (+4.5%) and South African rand (+4.1%). The New Zealand dollar is up 4.0%, and the Chinese renminbi has gained 2.3%. Among developed currencies, the euro (+0.7%), Canadian dollar (+0.6%), yen (+0.5%), and pound (+0.1%) show modest gains. The weakest currencies this year are the Turkish lira (-2.3%) and Indian rupee (-1.1%). Overall, 2026 shows selective dollar weakness against higher-yielding and commodity-sensitive currencies.
Cryptocurrencies
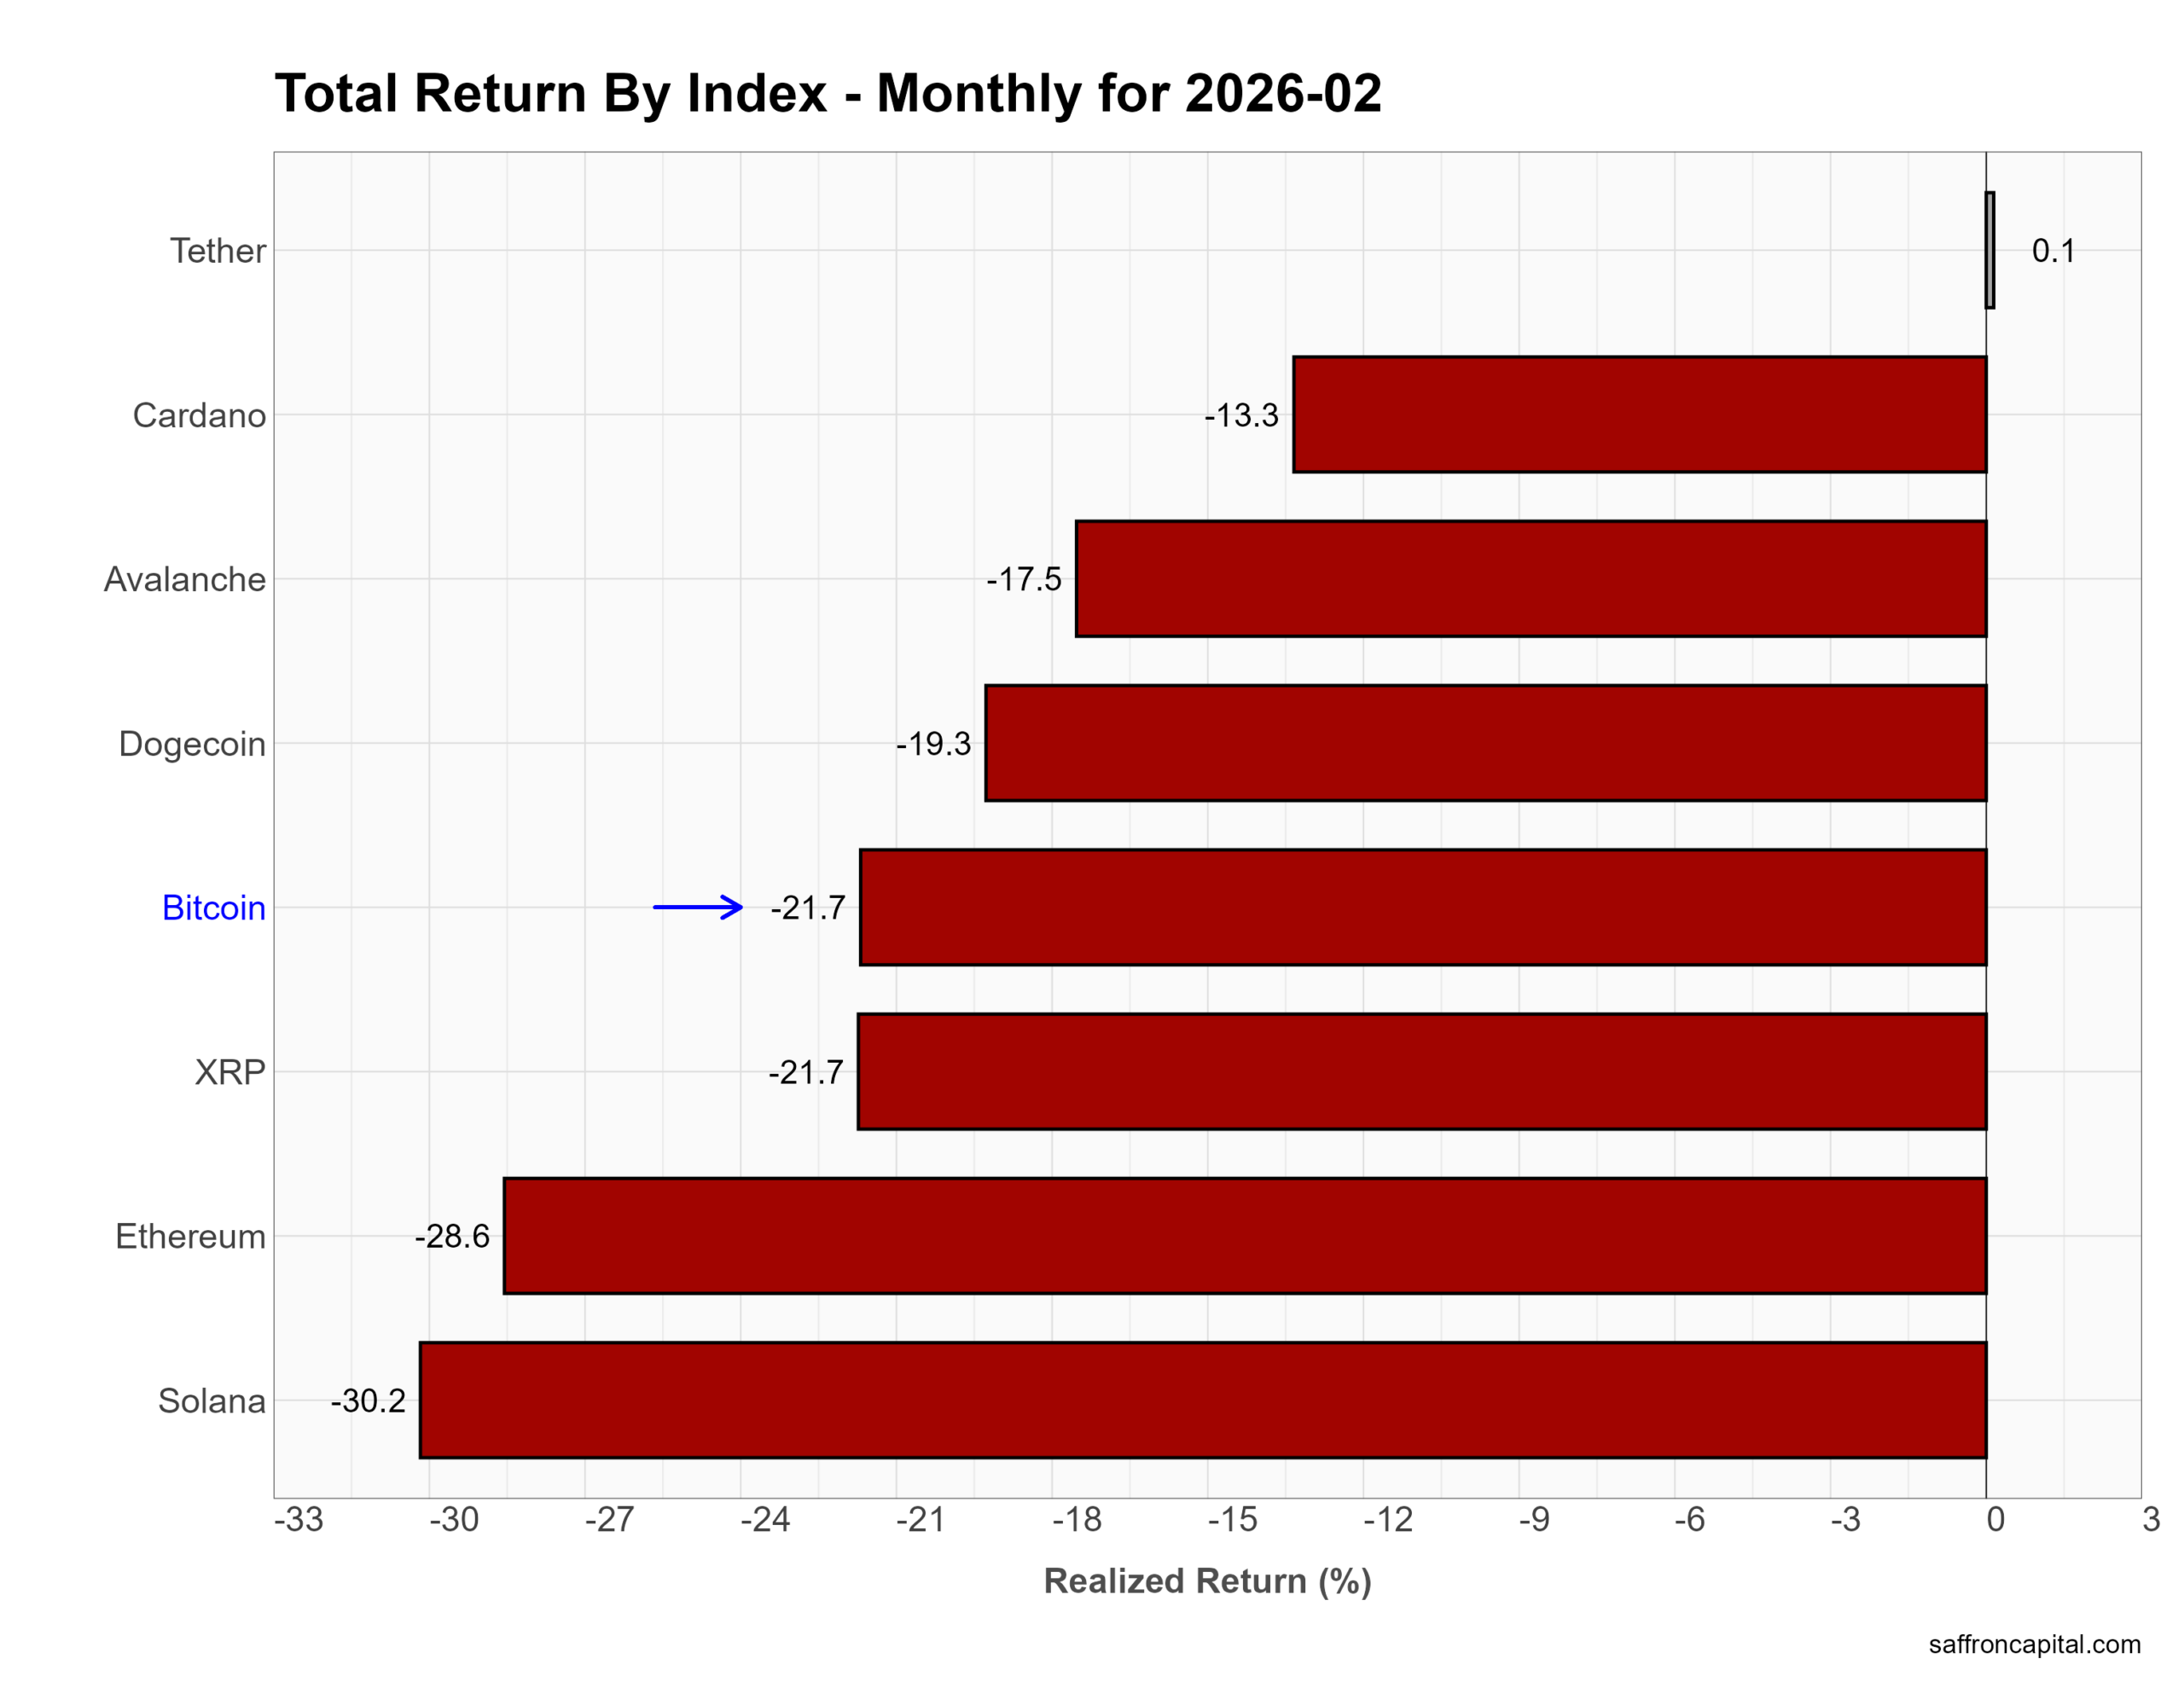
Crypto markets sold off sharply in February. Bitcoin fell 21.7% for the month, while Ethereum dropped 28.6%. Solana declined 30.2%, and XRP also lost 21.7%. Dogecoin fell 19.3%, and Avalanche dropped 17.5%. Cardano declined 13.3%. Tether was flat at 0.1%, reflecting its stablecoin structure. The pullback came as risk appetite weakened, volatility rose across equities, and traders reduced exposure to speculative assets. Higher real yields and tighter liquidity conditions also weighed on digital assets.
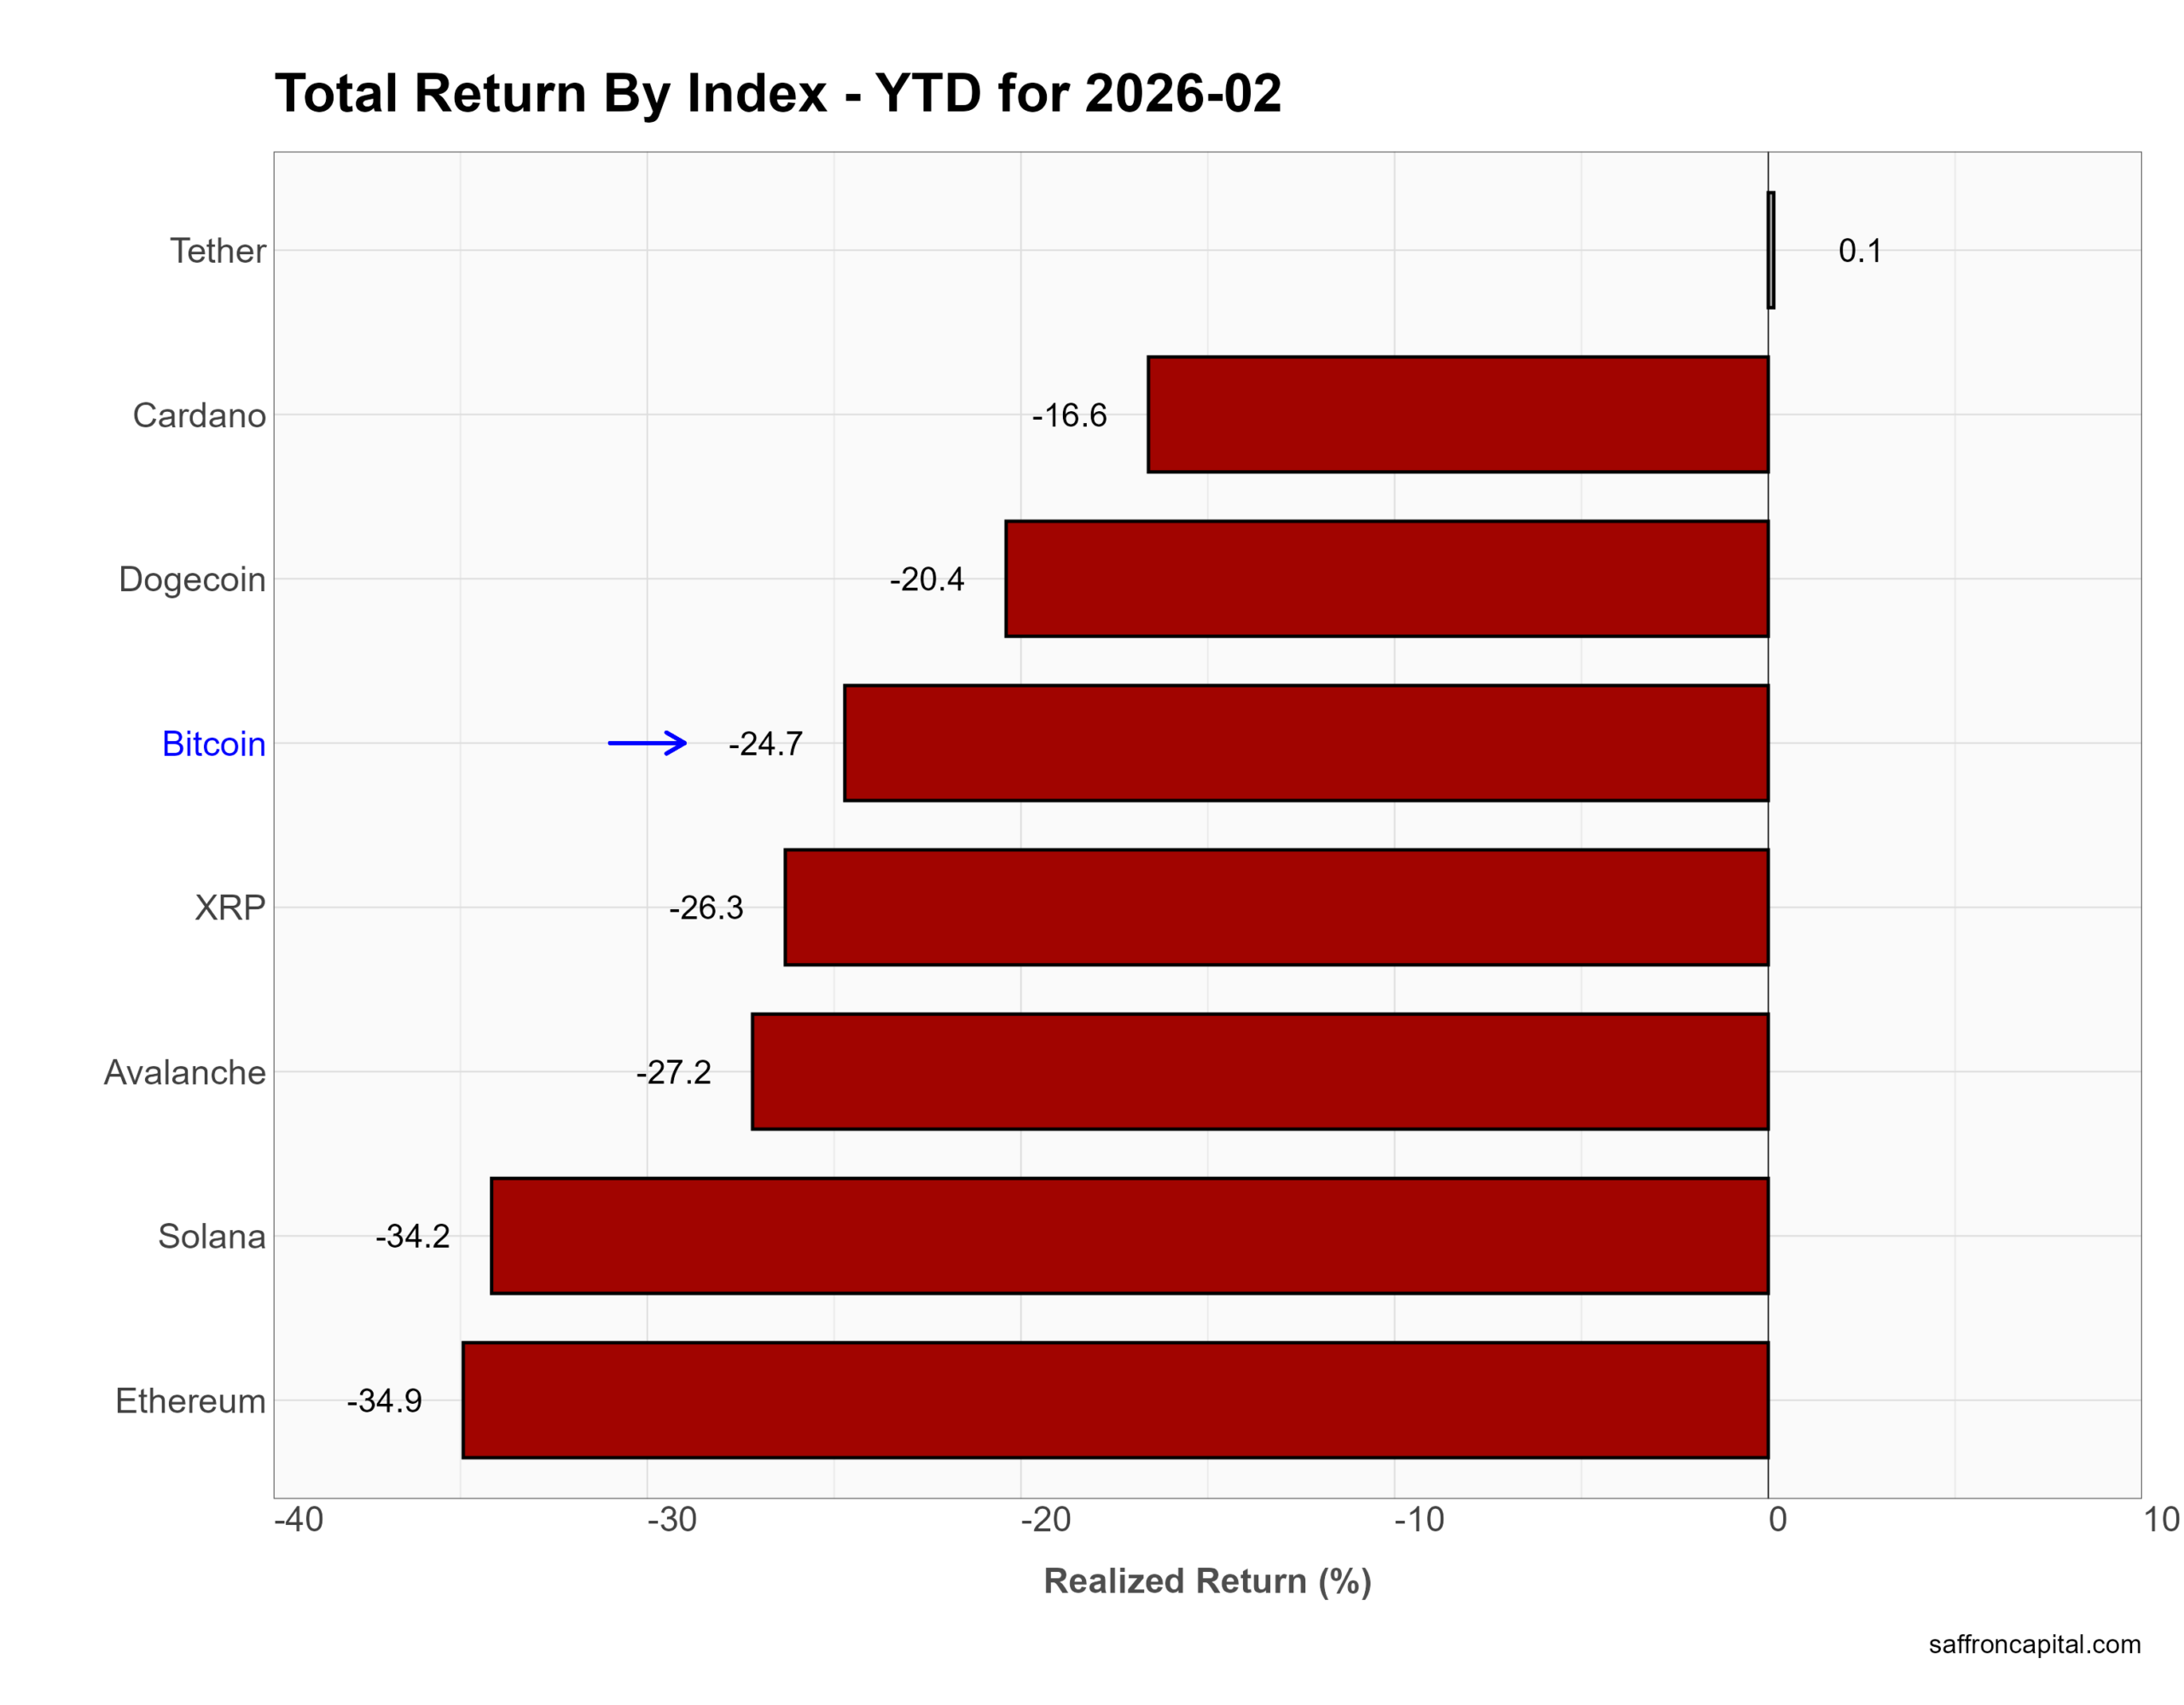
Year to date, losses remain deep. Bitcoin is down 24.7% in 2026. Ethereum has fallen 34.9%, and Solana is down 34.2%. Avalanche (-27.2%), XRP (-26.3%), and Dogecoin (-20.4%) show similar declines. Cardano is lower by 16.6%. Tether remains stable at 0.1%. In short, crypto continues to lag stocks, bonds, gold, and most commodities in 2026, reflecting a defensive shift in global capital flows.
Click to enlarge
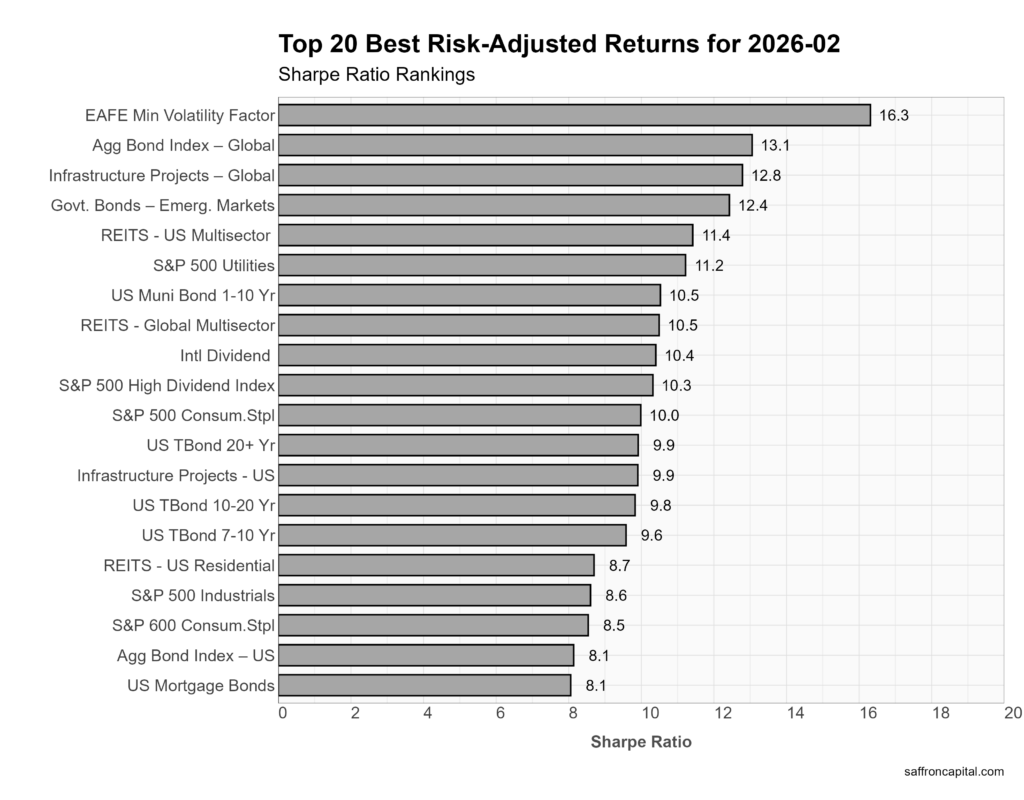
Risk-Adjusted Royalty
Returns alone don’t tell the story. This ranking shows which assets delivered the most reward for every unit of risk taken.
Have questions or concerns about the performance of your portfolio? Could you benefit from a capital preservation strategy or a custom portfolio formulation that better aligns to your return goals and risk appetite? Whatever your needs, we are here to listen and to help. Contact us here.
Saffron Capital LLC is a registered investment advisor that provides guided growth and risk-managed portfolios. The company is employee-owned and Minnesota-based.


