March returns reflected a broad risk-off reset driven by geopolitical shock, rising inflation expectations, and higher rates. First, U.S. equities sold off across the board. The S&P 500 fell -5.1%, with equal-weight even weaker at -6.0%, confirming broad participation in the drawdown. Moreover, cyclicals and growth both lagged, while Energy stood out as the lone bright spot, gaining roughly +10% on the back of surging oil prices. Abroad, losses deepened. Developed markets struggled, with most MSCI country indices down -6% to -11%, while the S&P Developed Markets Index fell -7.8%. Emerging markets fared even worse. The S&P EM Index dropped -9.1%, with Korea (-18.7%) and South Africa (-16.9%) leading declines as global growth fears intensified. Meanwhile, bonds failed to provide protection. Rising yields pushed the U.S. Aggregate Bond Index down -1.79%, while long-duration Treasuries lost over -4%. In contrast, commodities surged. Energy led with triple-digit annualized momentum, and gasoline, heating oil, and crude all gained 50%+ on the month, lifting the S&P GSCI Index +24.2%. Finally, the U.S. dollar strengthened (+2.4%), while crypto showed mixed resilience, with Bitcoin up +3.6% and Ethereum gaining +9.0%.
The following analysis is a visual summary of monthly and annual returns by asset group. The goal is to help investors benchmark portfolio performance and identify emerging cross-asset trends shaping market leadership.
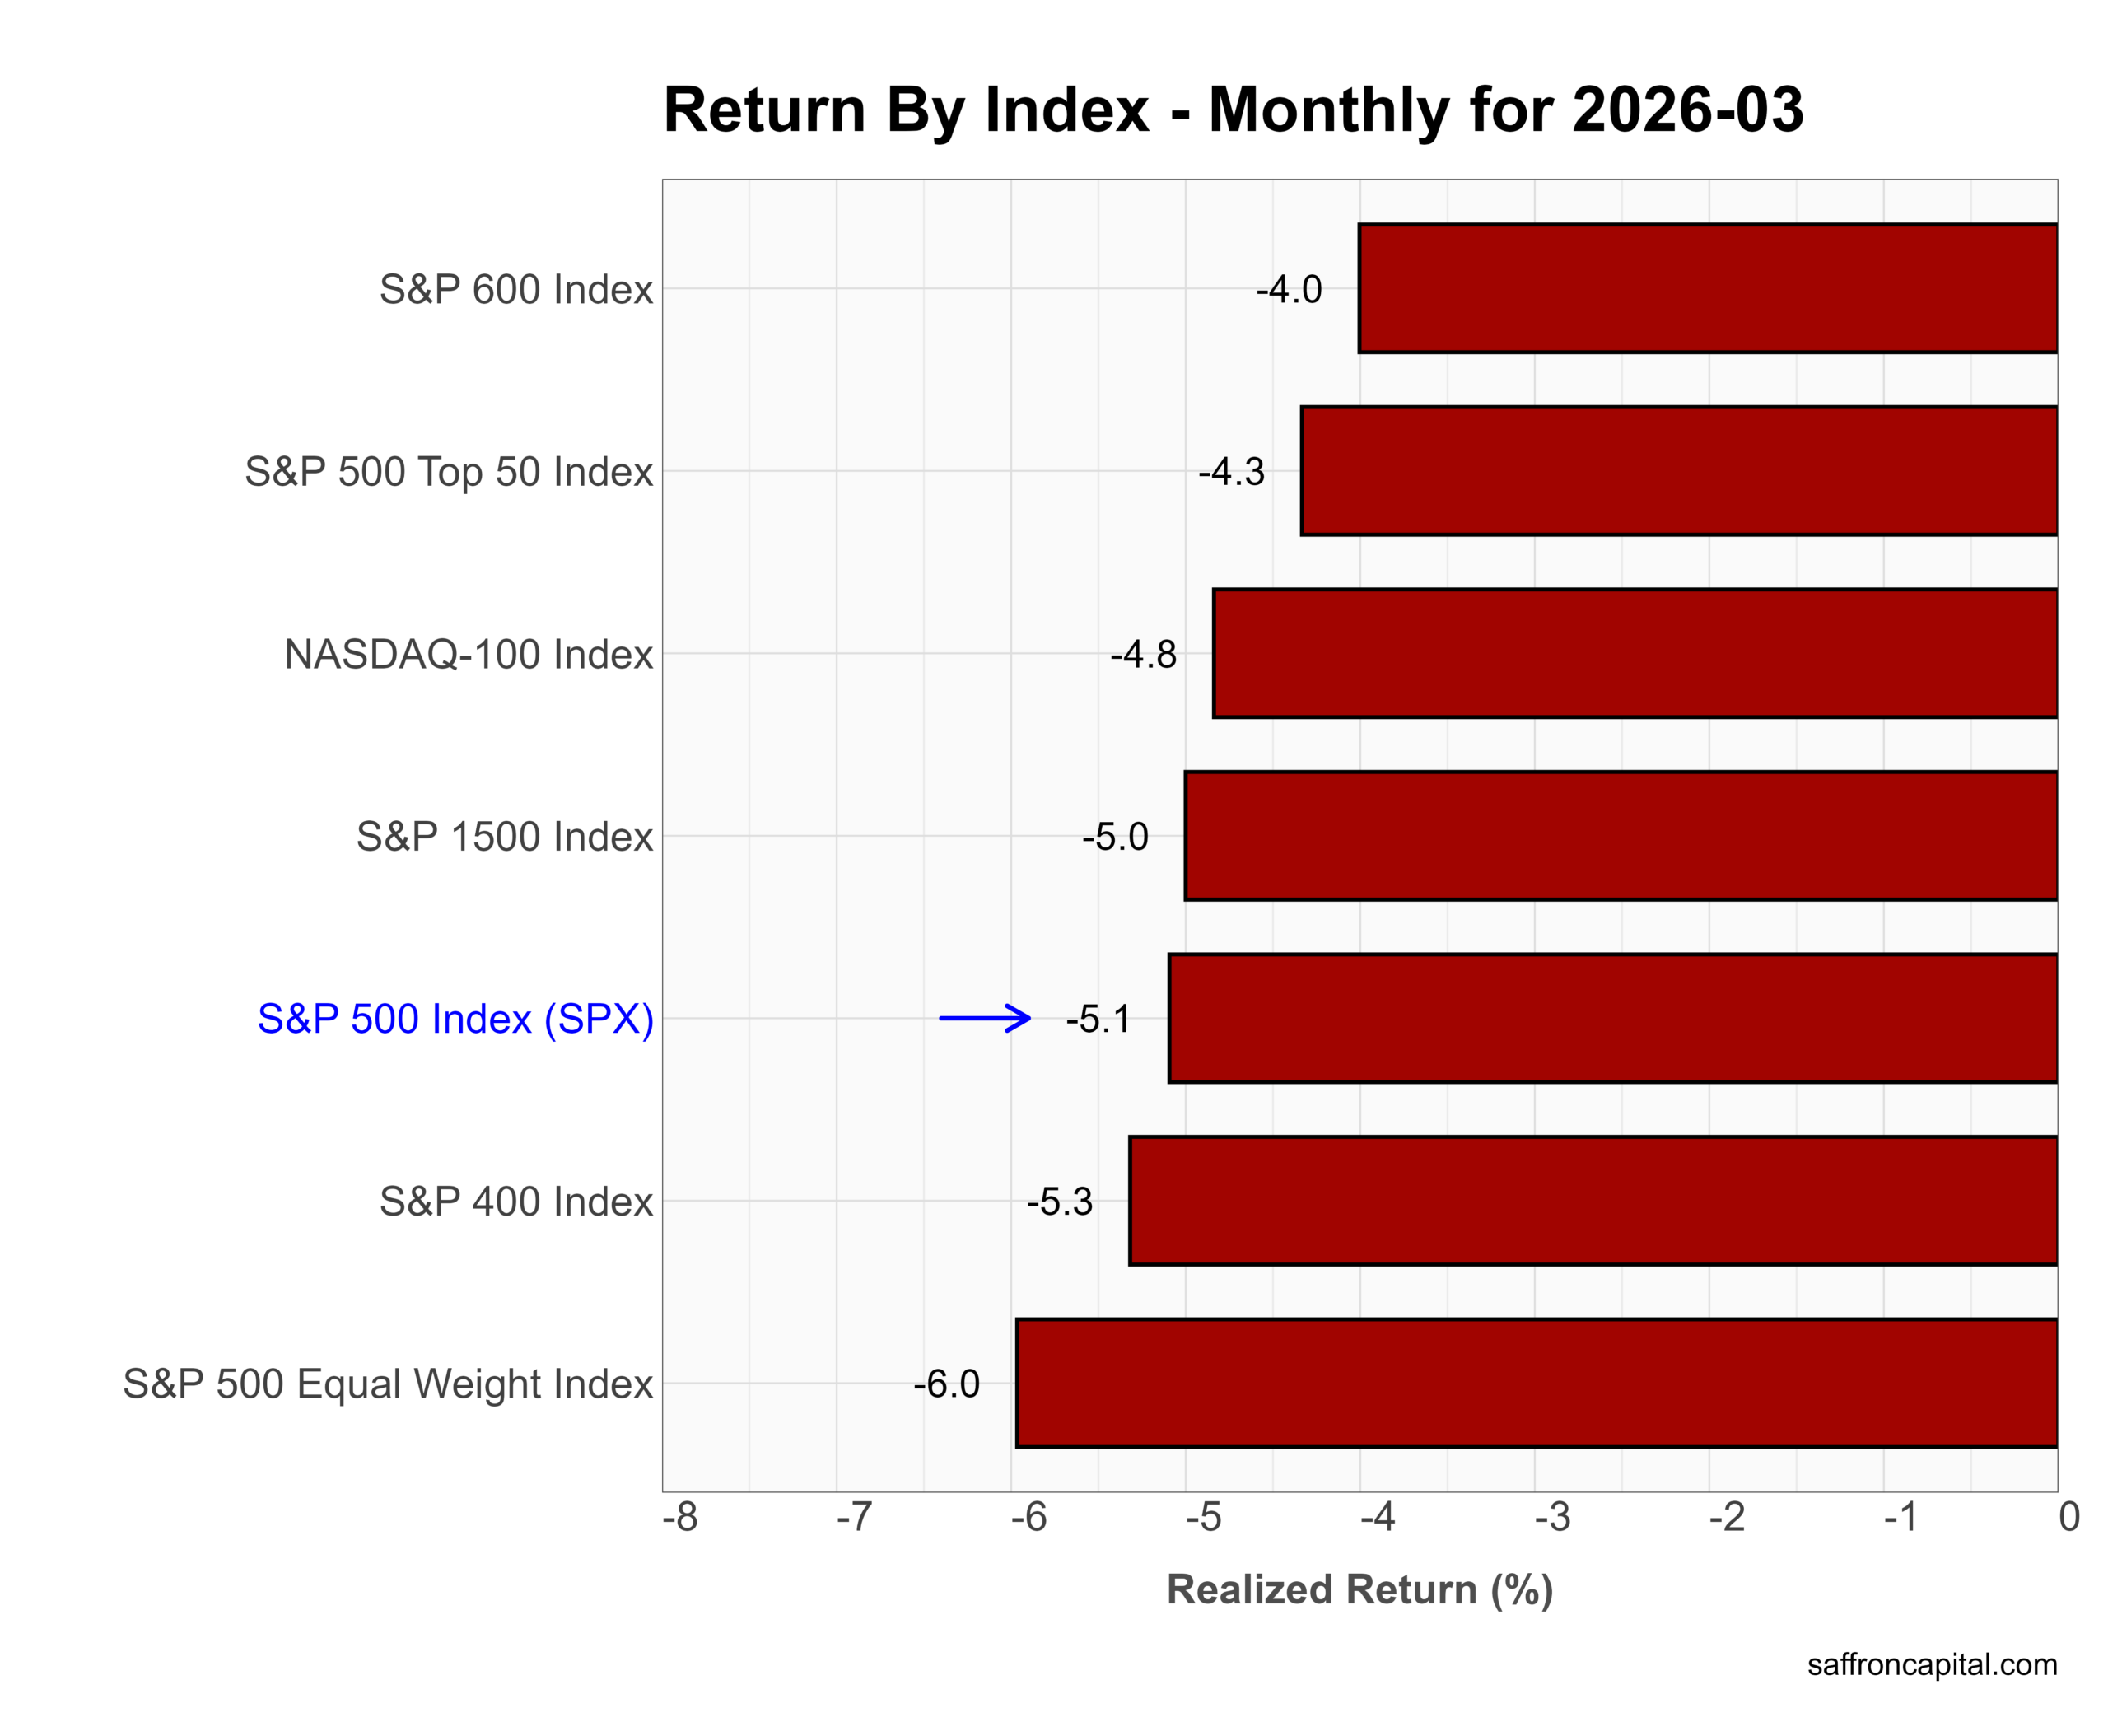
Core US Indices
March delivered a broad-based equity selloff with no place to hide. First, mega caps led to the downside as the NASDAQ-100 fell -4.8% and the S&P 500 Top 50 dropped -4.3%. Meanwhile, the S&P 500 declined -5.1%, and broader indices performed even worse. The S&P 400 lost -5.3%, the S&P 600 fell -4.0%, and the Equal Weight S&P 500 dropped -6.0%, which confirms that weakness extended well beyond Big Tech. In short, March erased the prior rotation into breadth and reset risk across the entire equity complex.
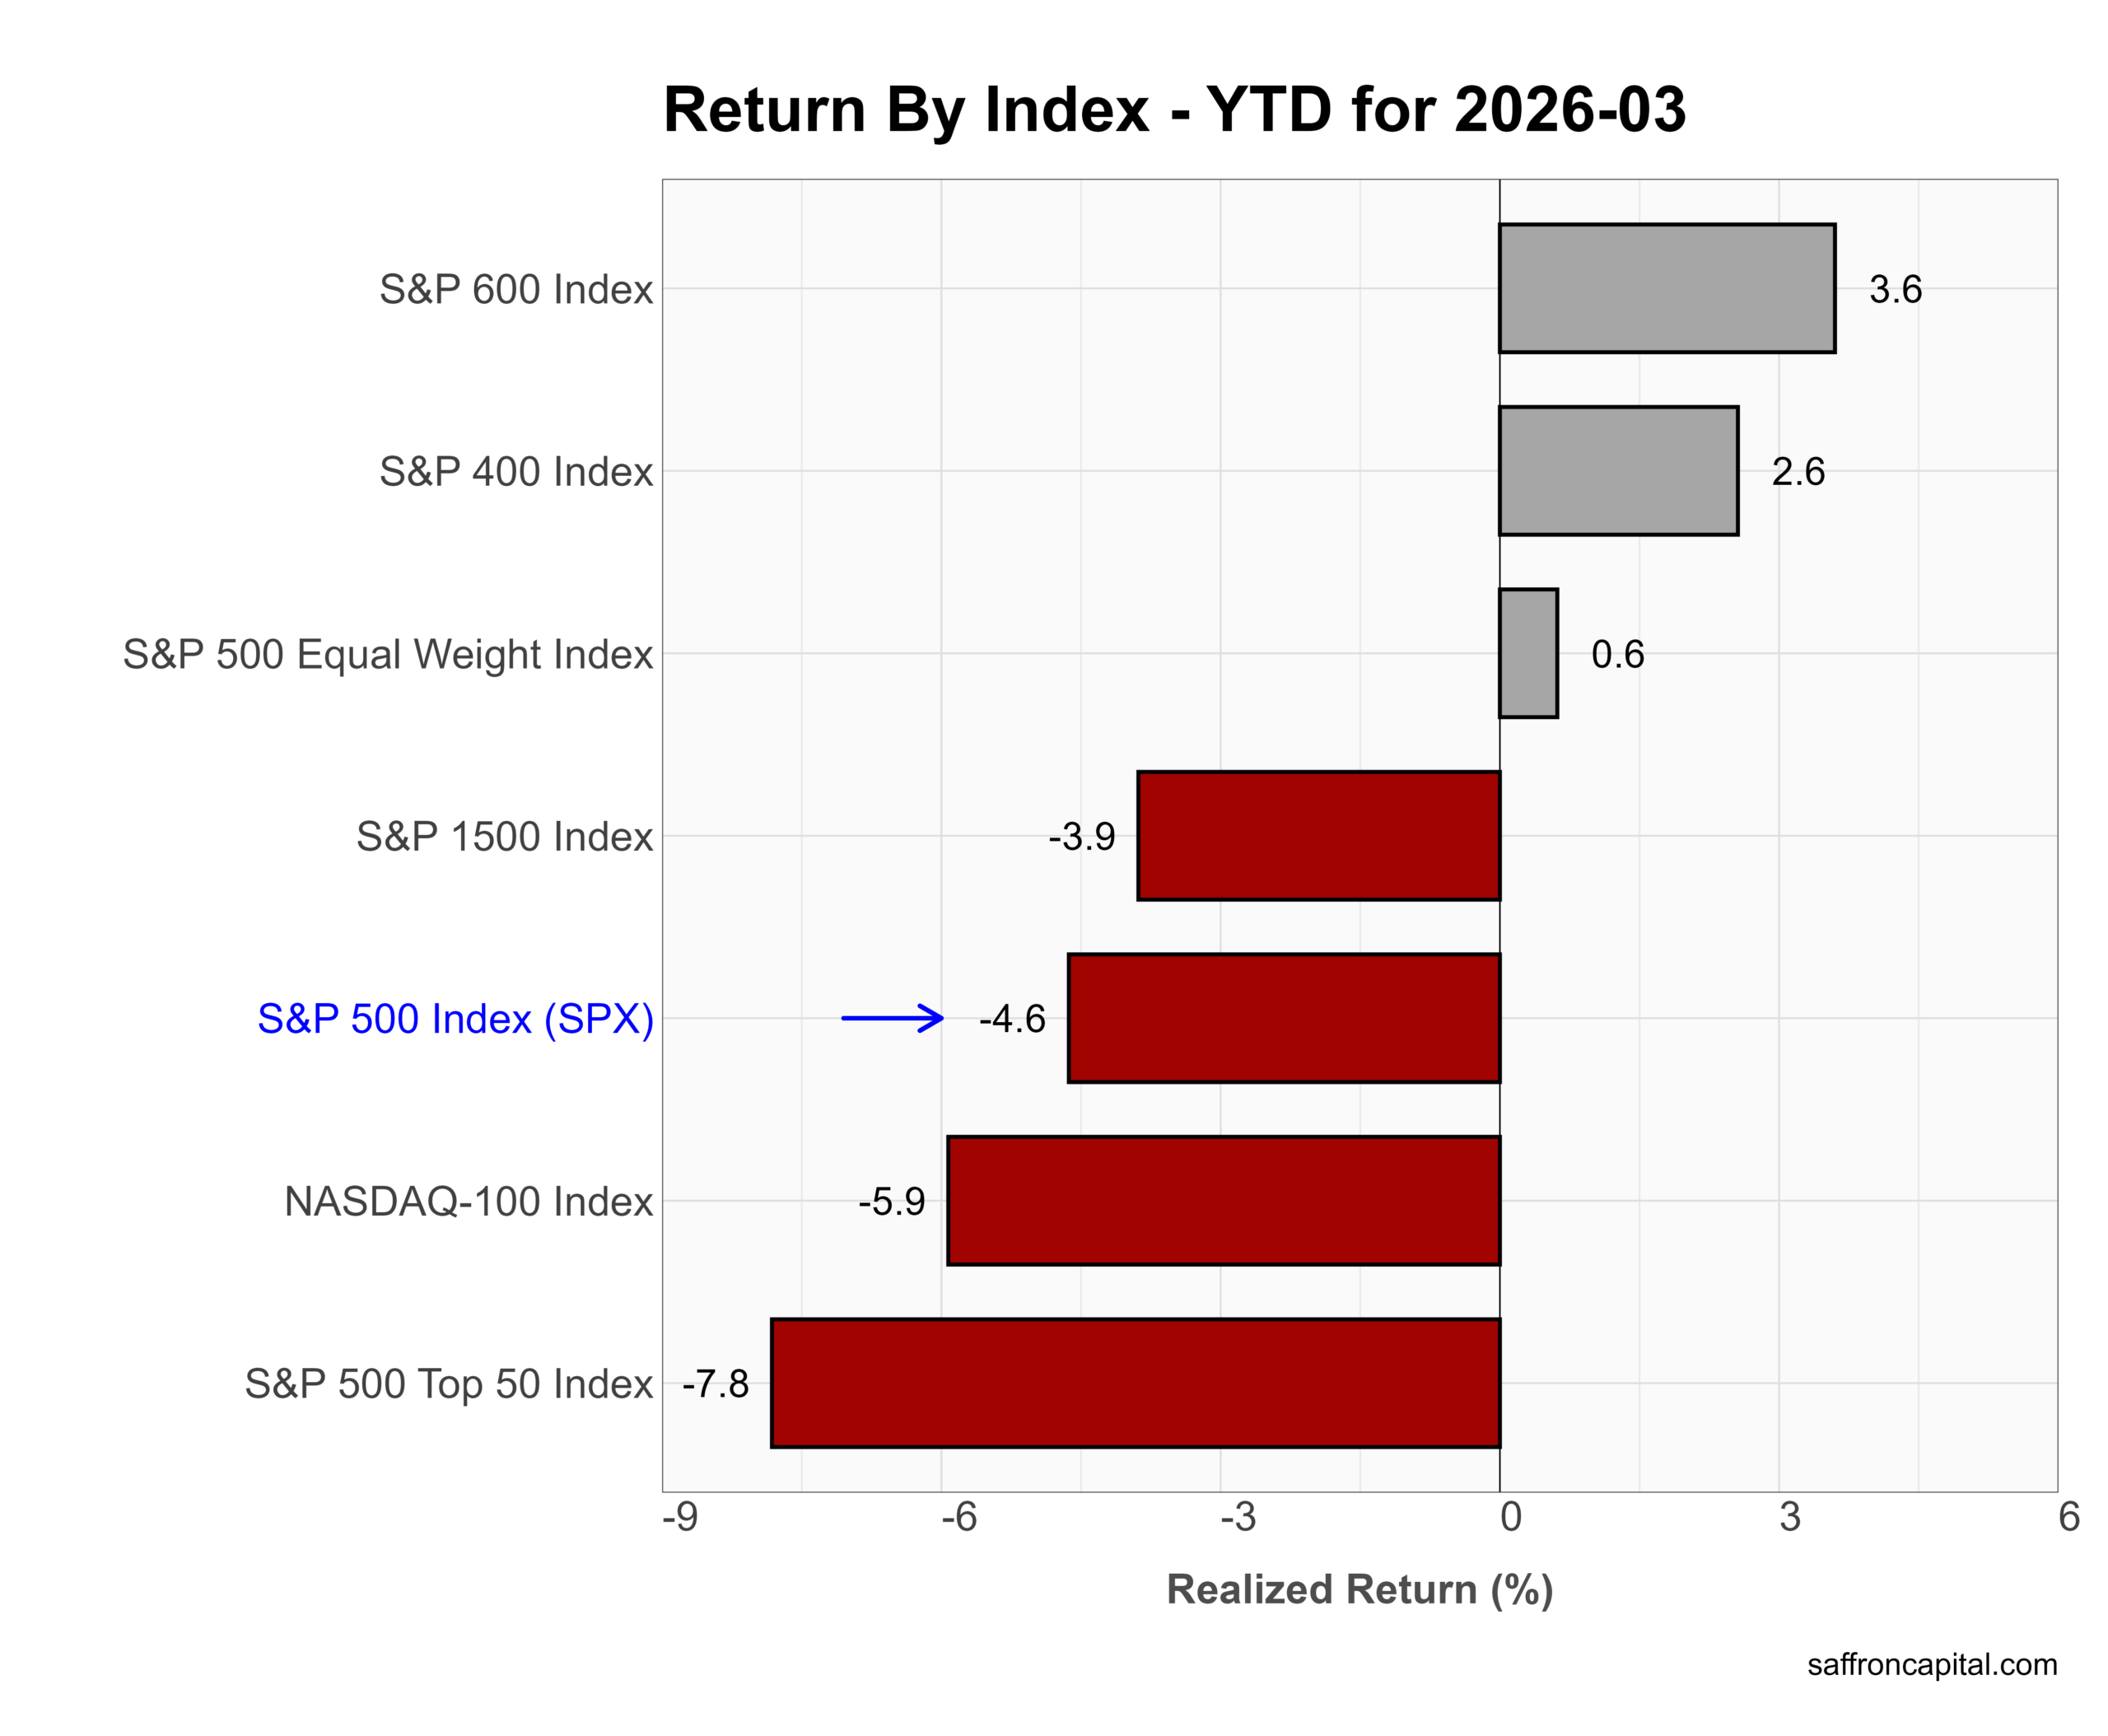
Year to date, leadership still leans toward smaller caps despite the March drawdown. The S&P 600 leads at +3.6%, followed by the S&P 400 at +2.6%, while the Equal Weight S&P 500 remains positive at +0.6%. In contrast, large-cap benchmarks lag. The S&P 500 sits at -4.6%, the NASDAQ-100 at -5.9%, and the S&P 500 Top 50 trails at -7.8%. Overall, 2026 still reflects a shift away from mega-cap concentration toward broader, more balanced market participation—even after March’s reset.
Click to enlarge
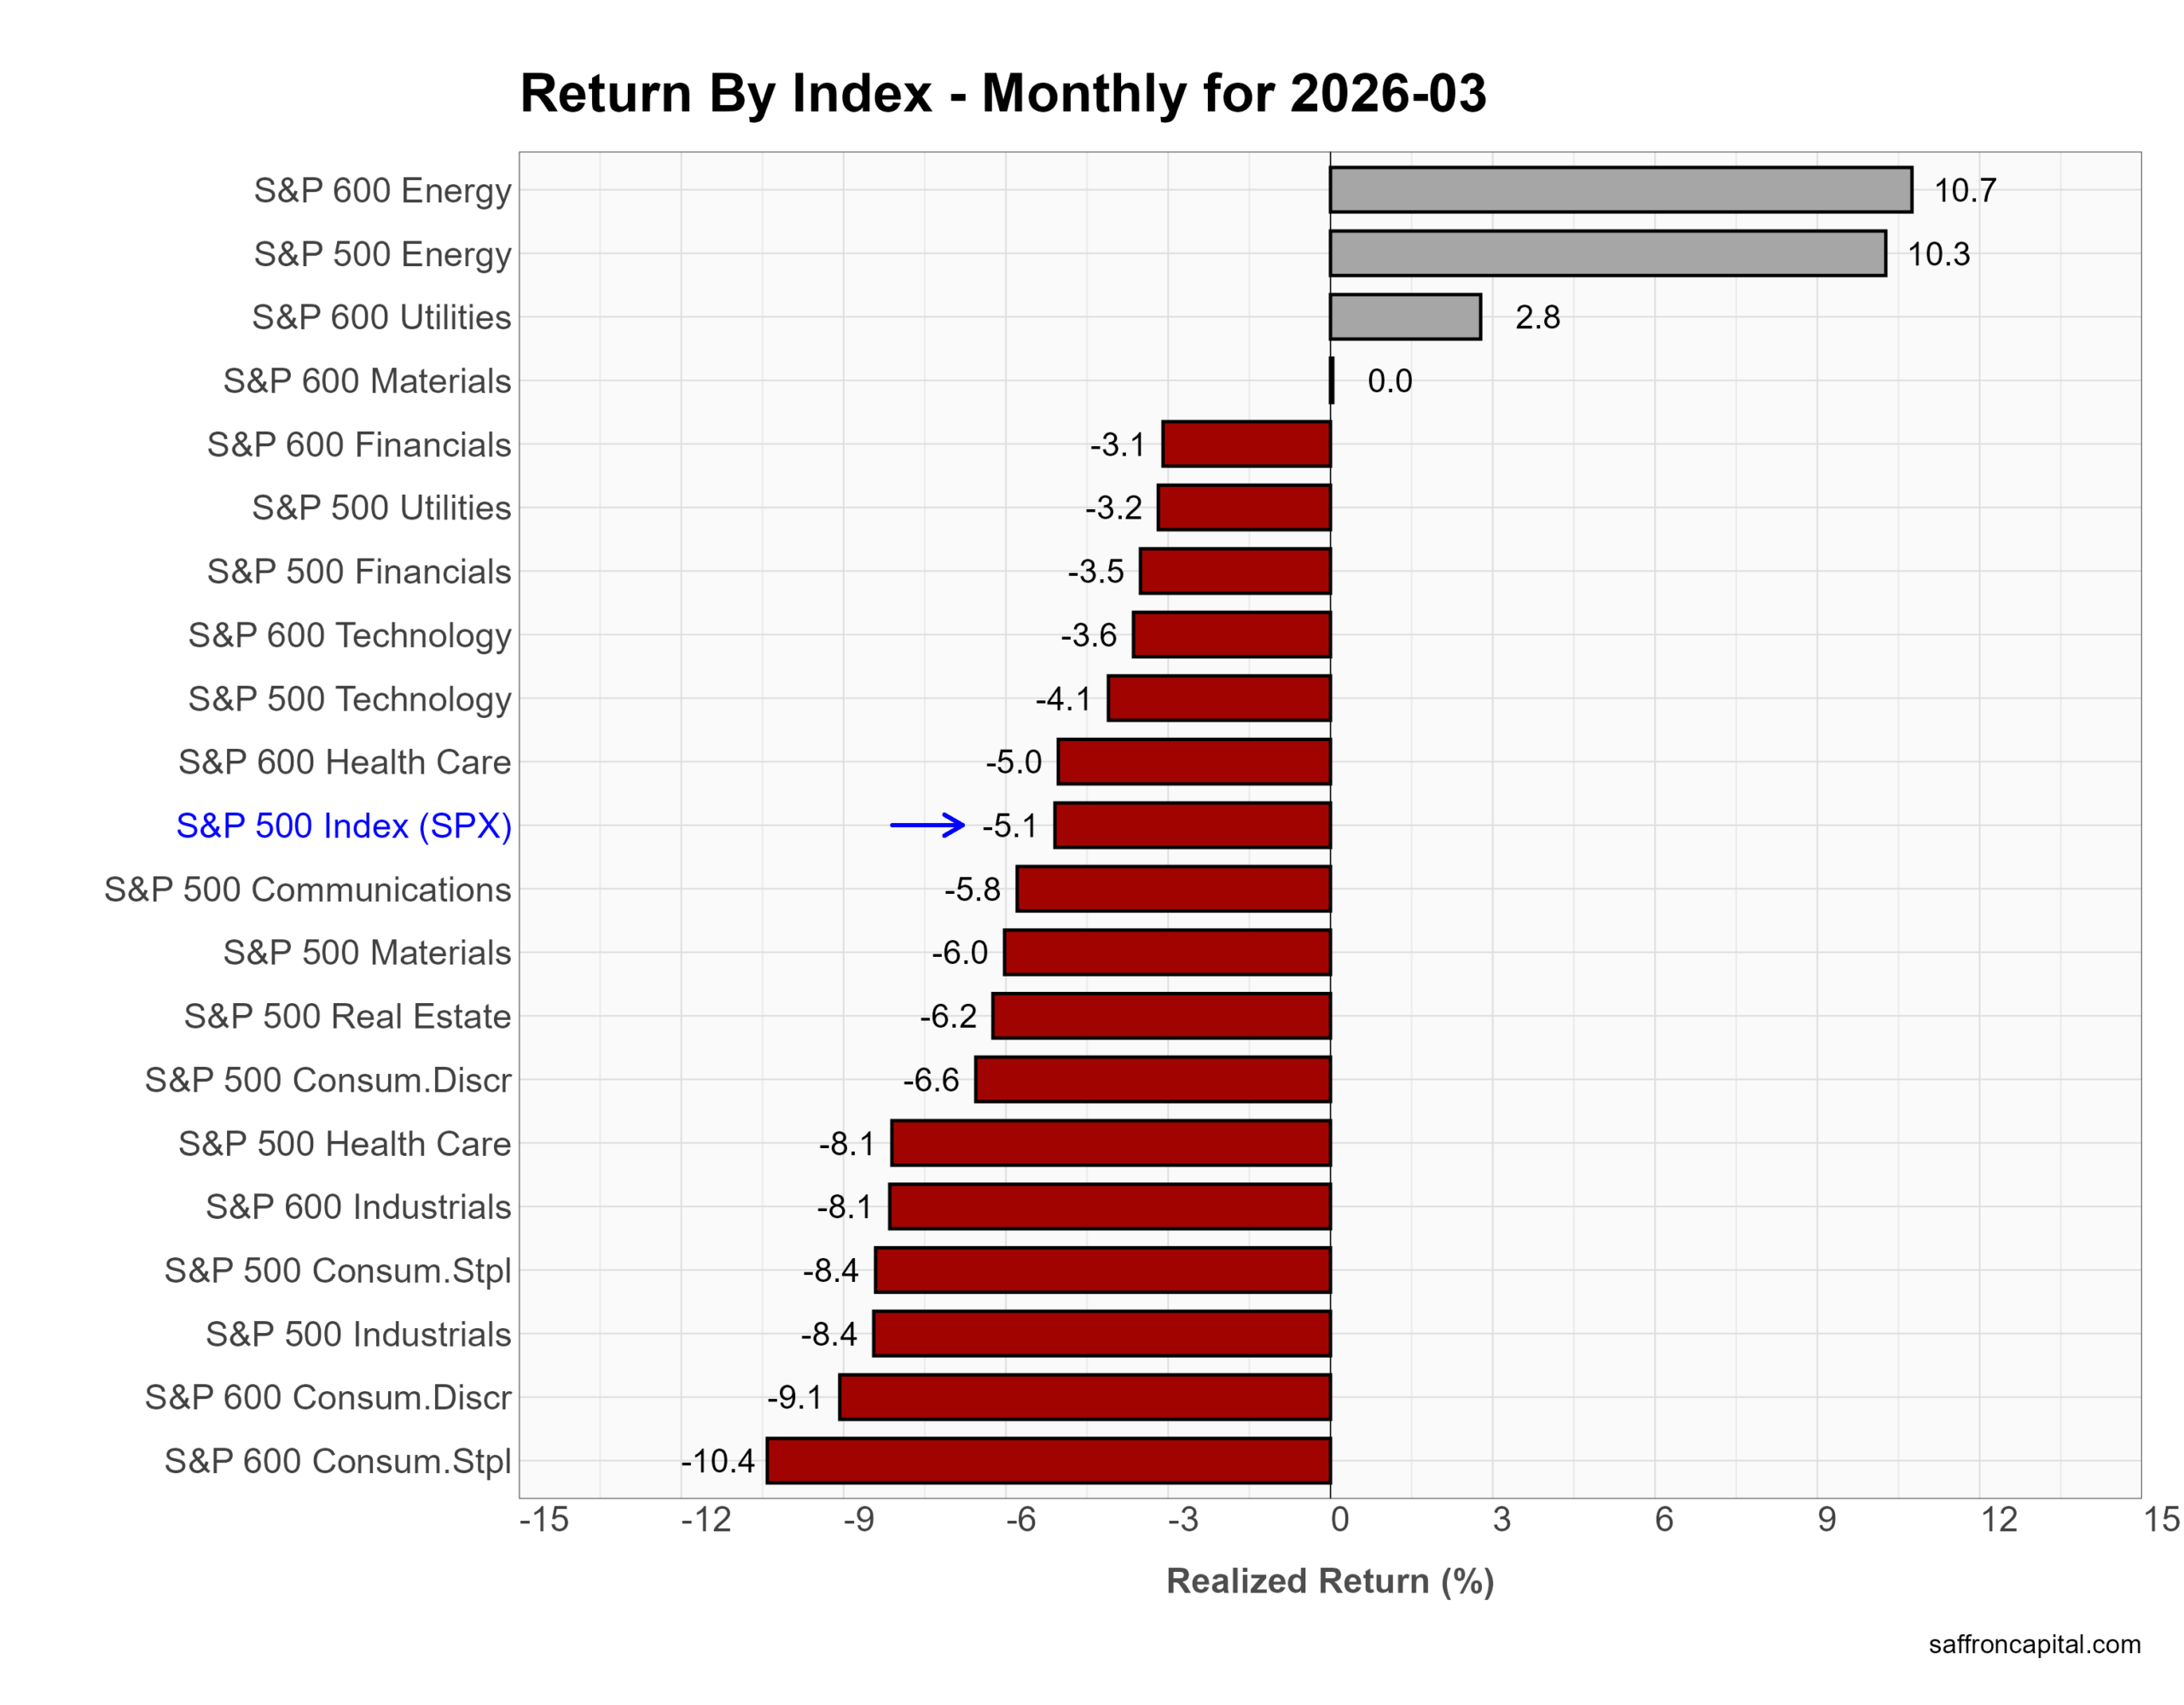
US Sector Indices
March reinforced a hard rotation into energy and away from growth. First, Energy led decisively, with S&P 500 Energy up +10.3% and small-cap Energy gaining +10.7% as crude prices surged. Utilities followed with modest gains (+2.8% in small caps), reflecting a partial defensive bid. However, the rest of the market sold off sharply. Cyclicals lagged, with Industrials down -8.4% and Consumer Staples off -8.4% in large caps. Growth sectors also struggled. Technology fell -4.1%, Communication Services dropped -5.8%, and Consumer Discretionary declined -6.6%. Financials weakened (-3.5%) as rate volatility and credit concerns pressured sentiment. Overall, March showed a narrow leadership profile dominated by energy, with broad weakness elsewhere.
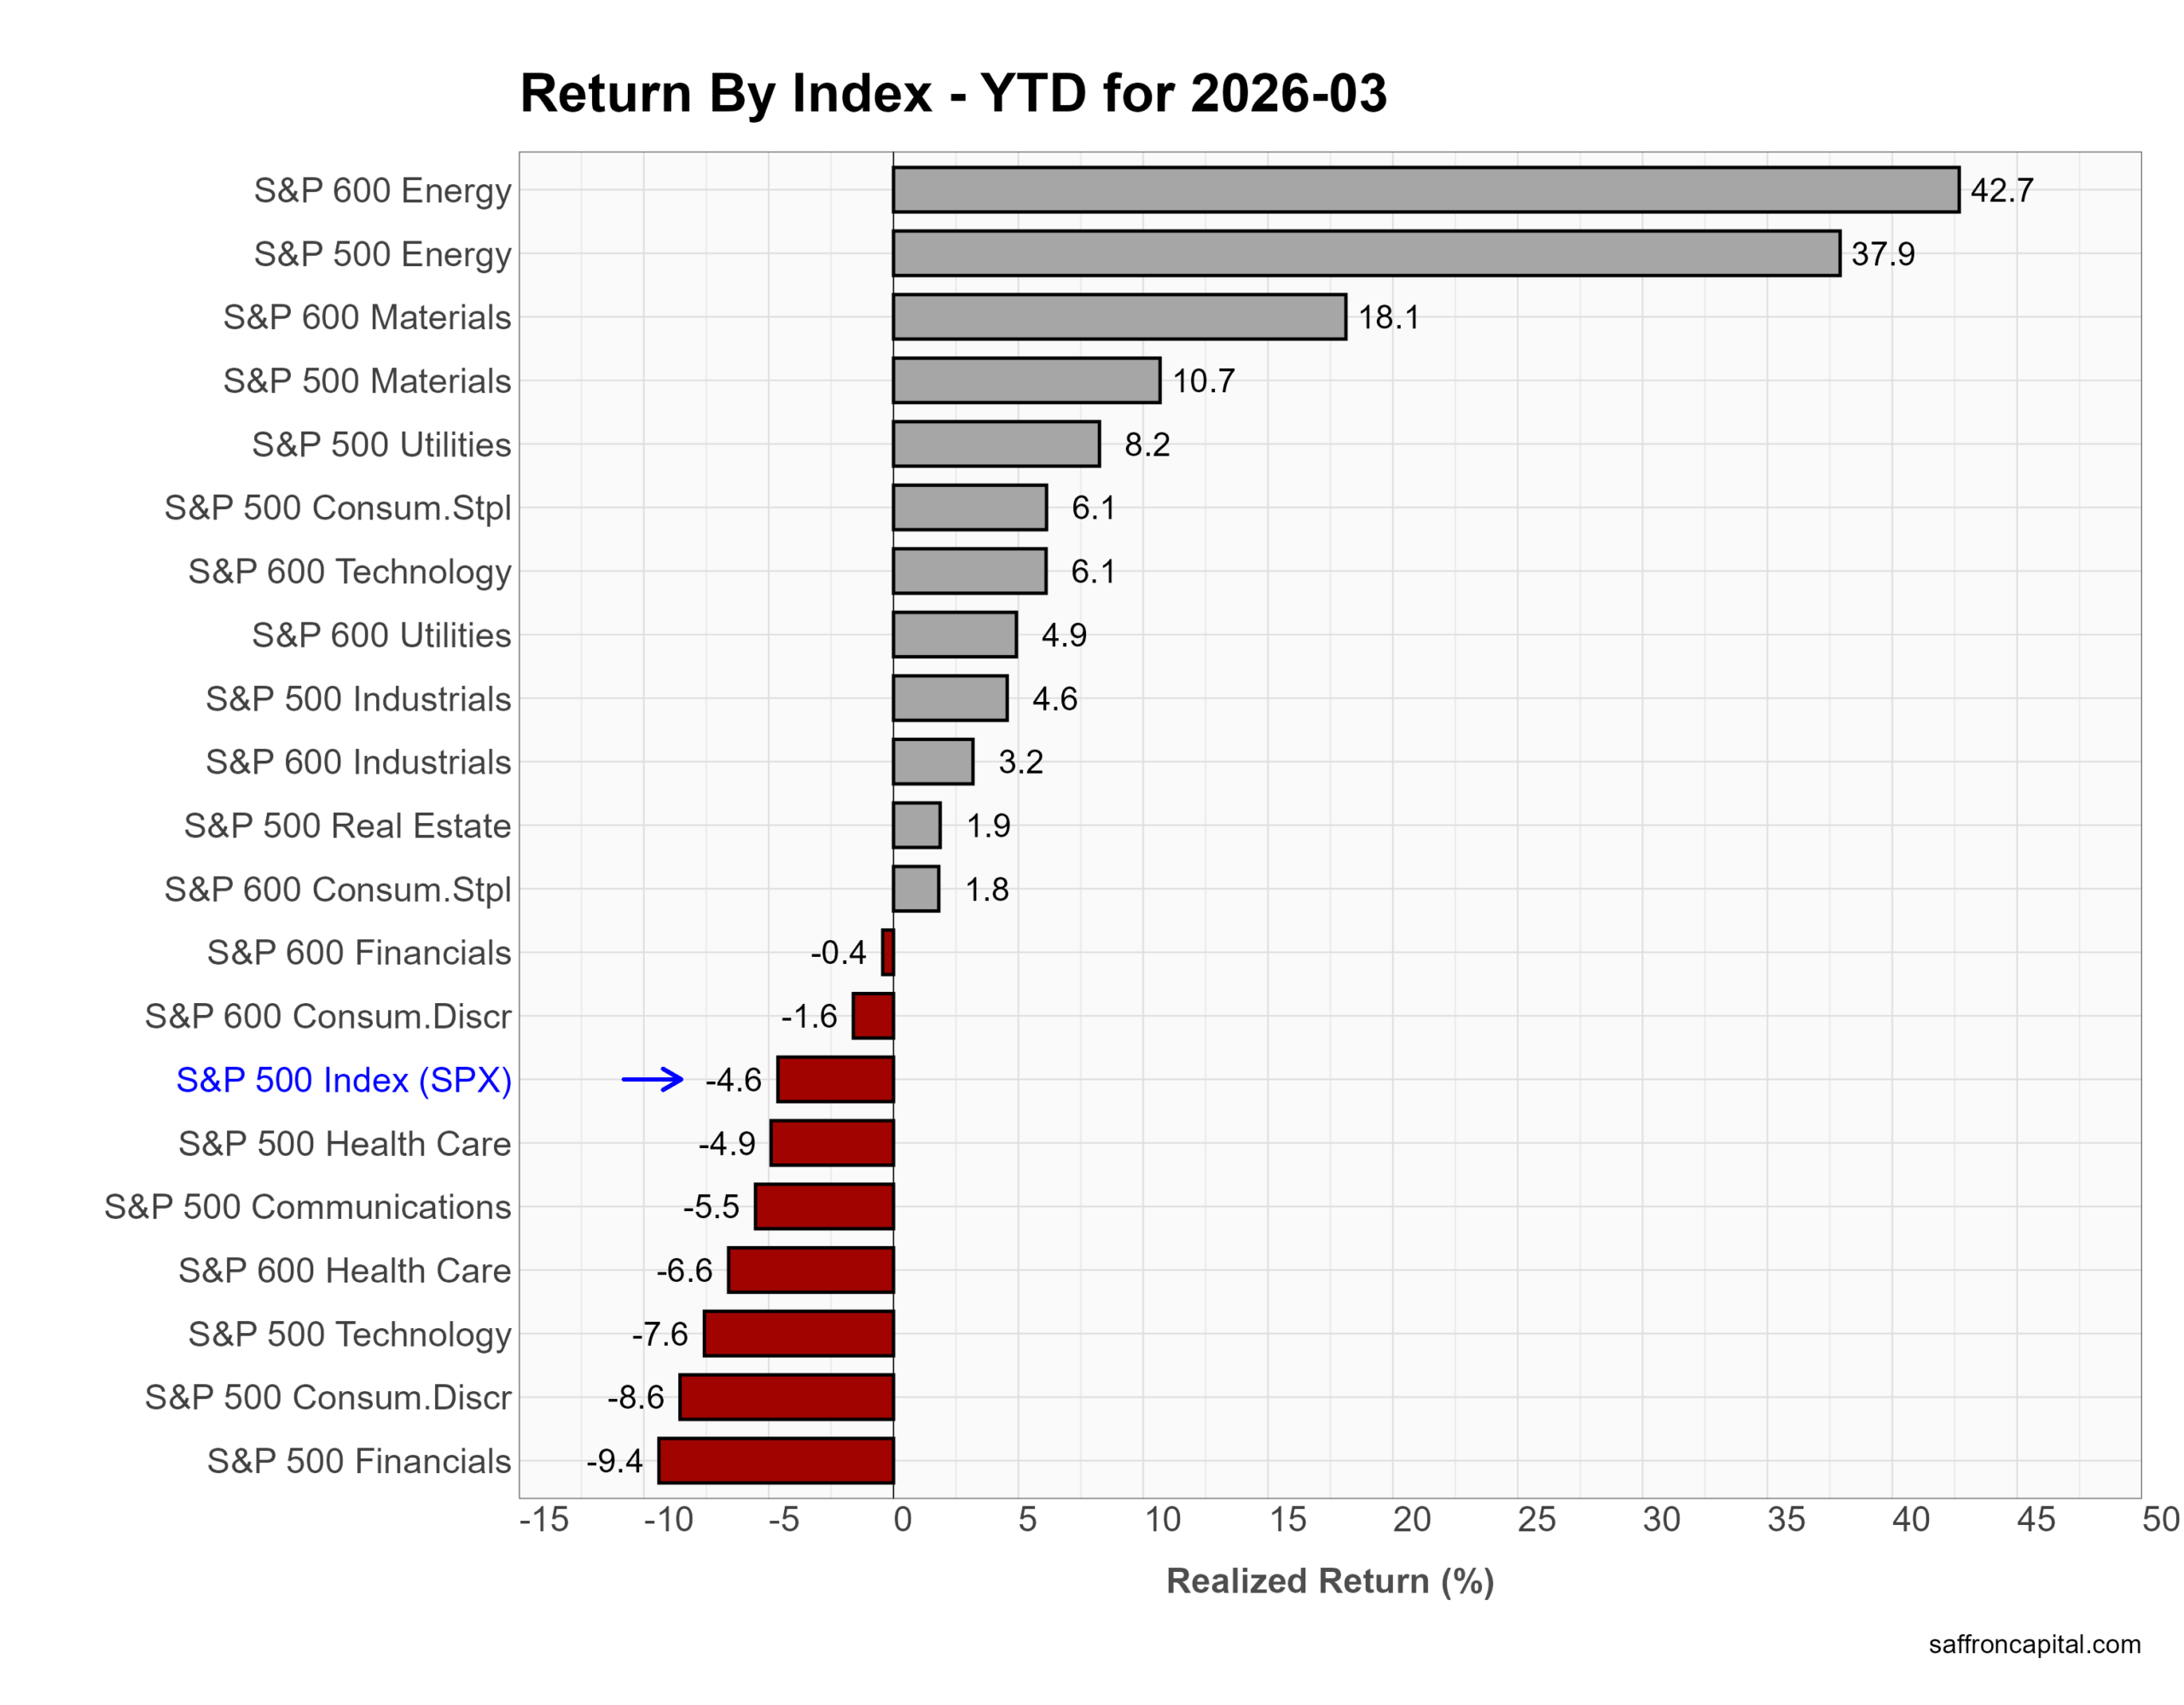
Year to date, the trend is even clearer. Energy dominates across the board, with +37.9% (S&P 500) and +42.7% (S&P 600) returns. Materials follow with solid gains (+10–18%), while Utilities and Industrials post mid-single-digit advances. In contrast, growth sectors remain under pressure. Technology is down -7.6%, Consumer Discretionary -8.6%, and Financials -9.4%. Overall, 2026 continues to favor real assets and inflation beneficiaries over rate-sensitive and credit-exposed sectors.
Click to enlarge
US Factor Indices
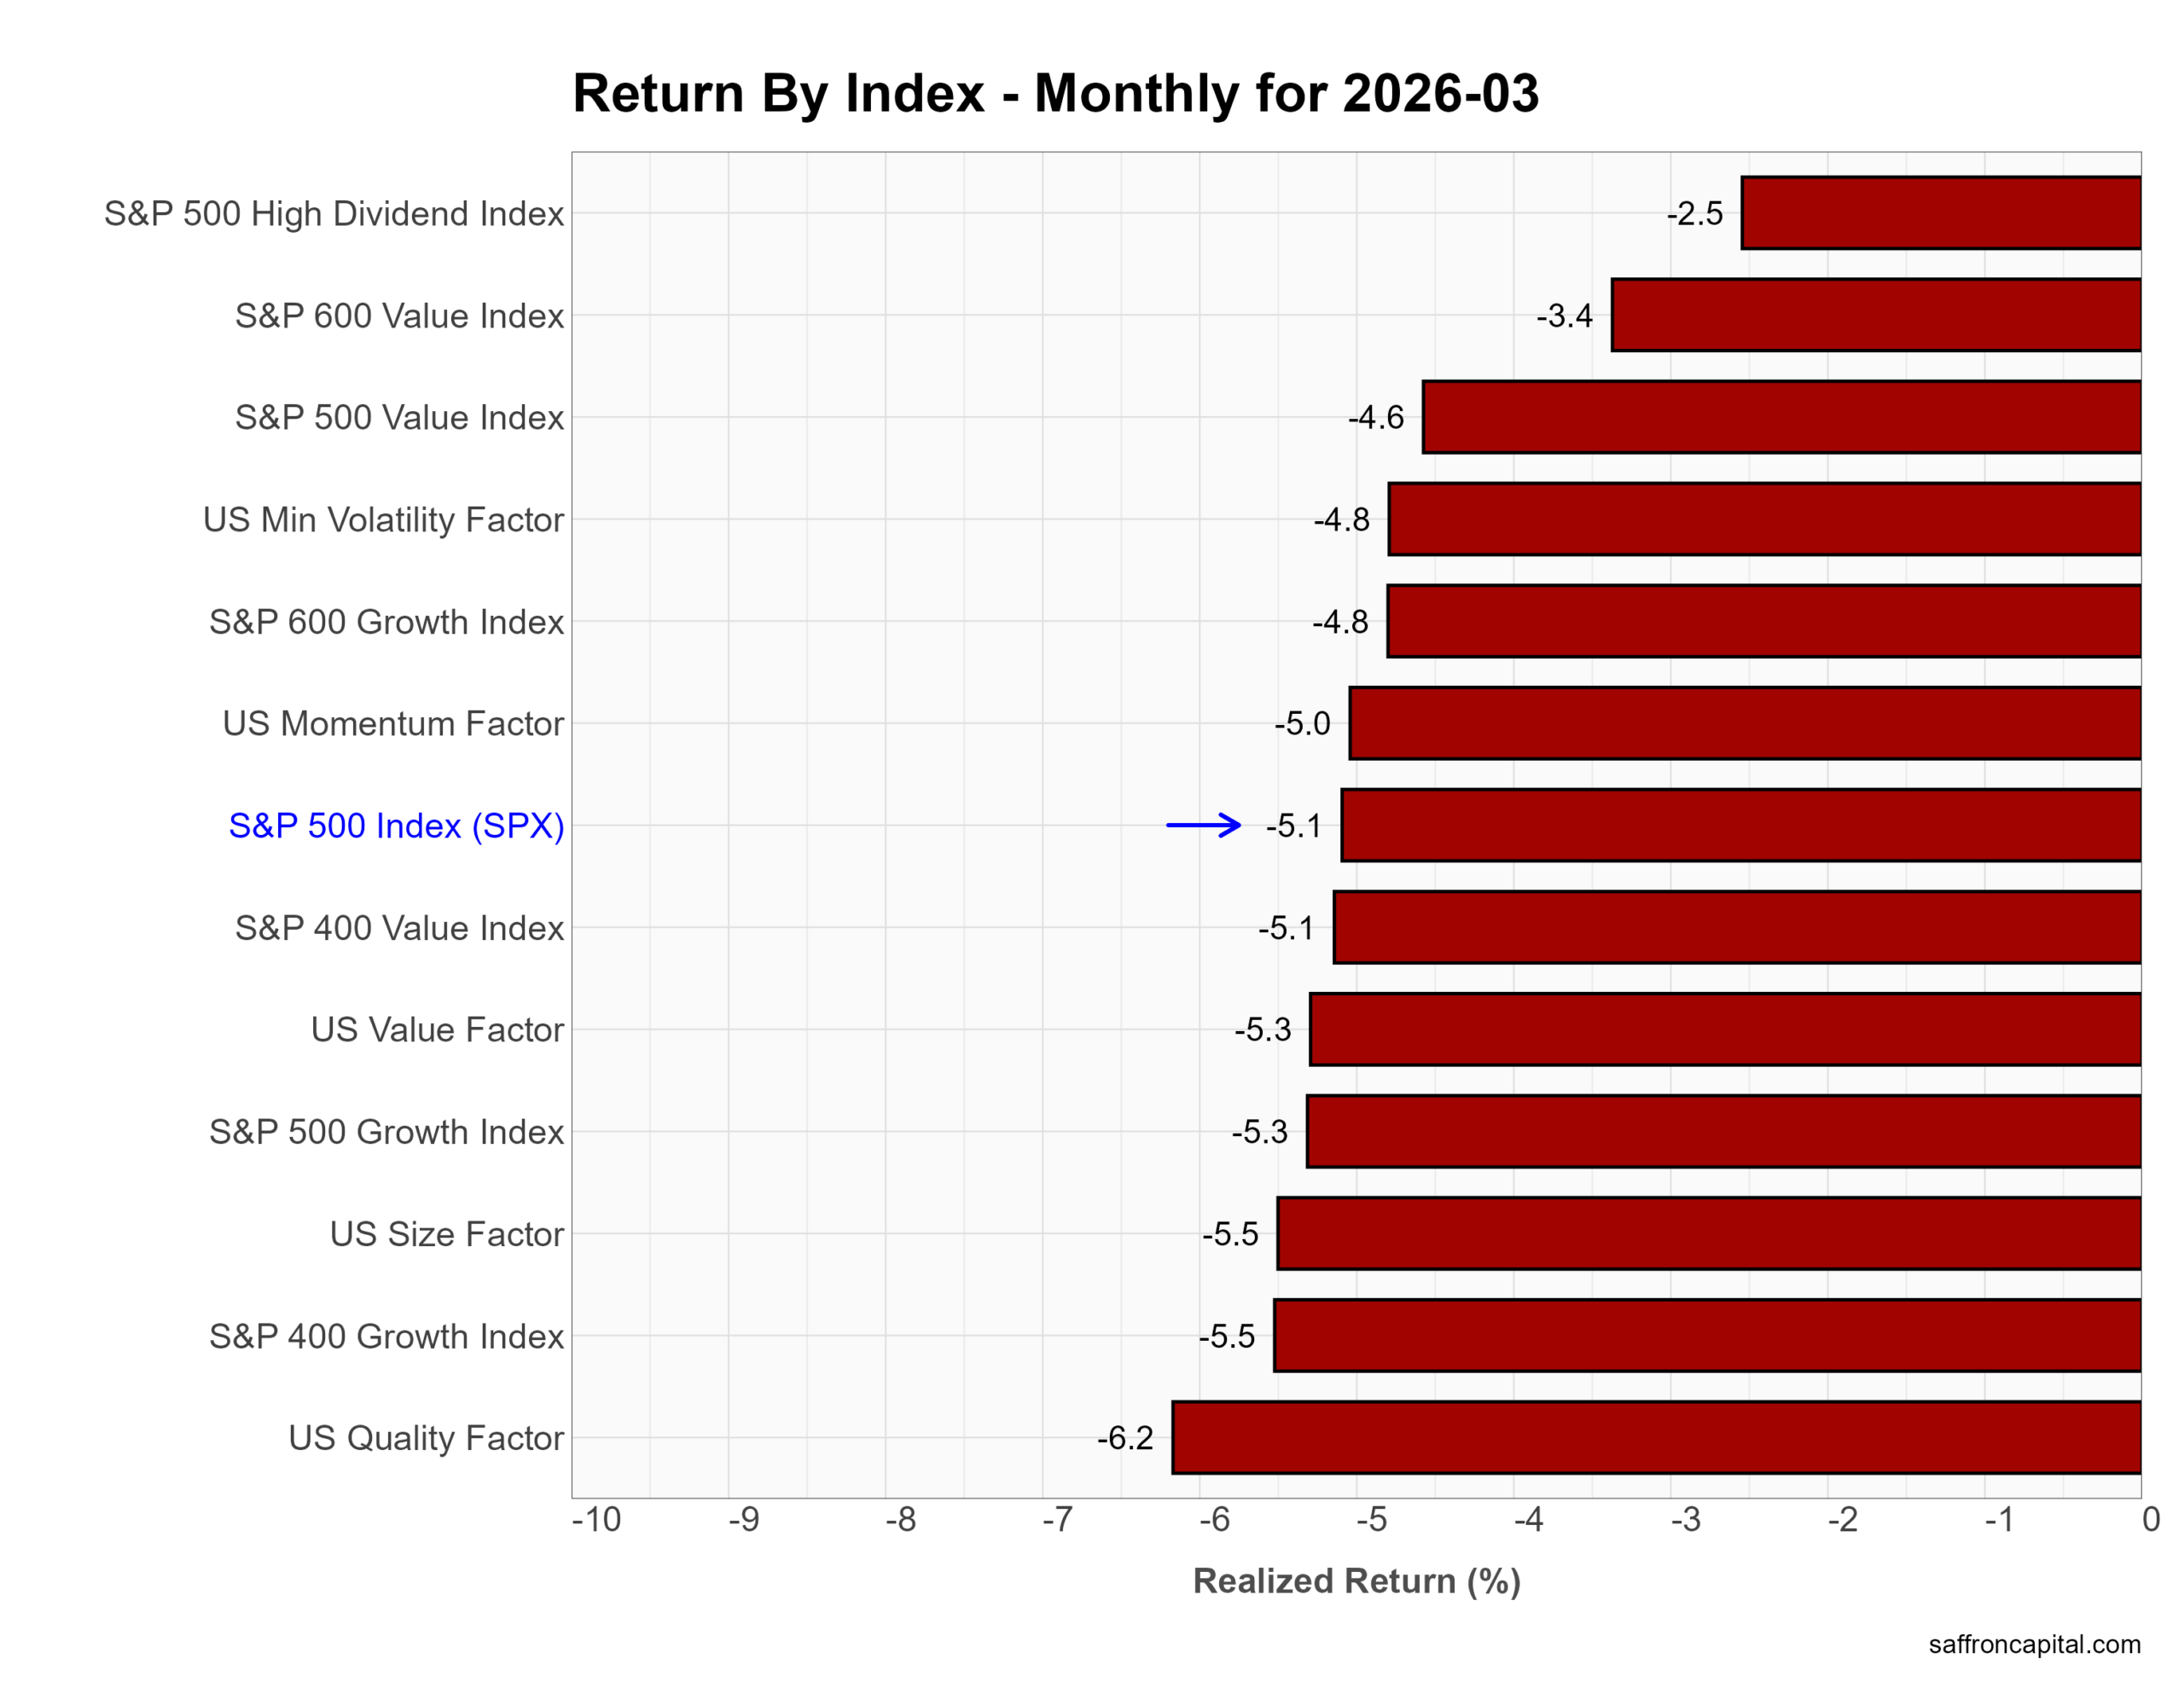
Factor portfolios group stocks by shared characteristics such as value, growth, momentum, or income to isolate specific return drivers. In March, all major factors declined, which signals broad de-risking rather than rotation. First, defensive strategies held up best. The S&P 500 High Dividend Index fell just -2.5%, outperforming the broader market. Meanwhile, Value showed relative resilience, with large-cap Value down -4.6% versus -5.3% for Growth. However, higher-beta exposures lagged. Momentum dropped -5.0%, Size fell -5.5%, and Quality underperformed at -6.2%. In short, investors reduced risk across both growth and factor tilts, with only income strategies offering partial downside protection.
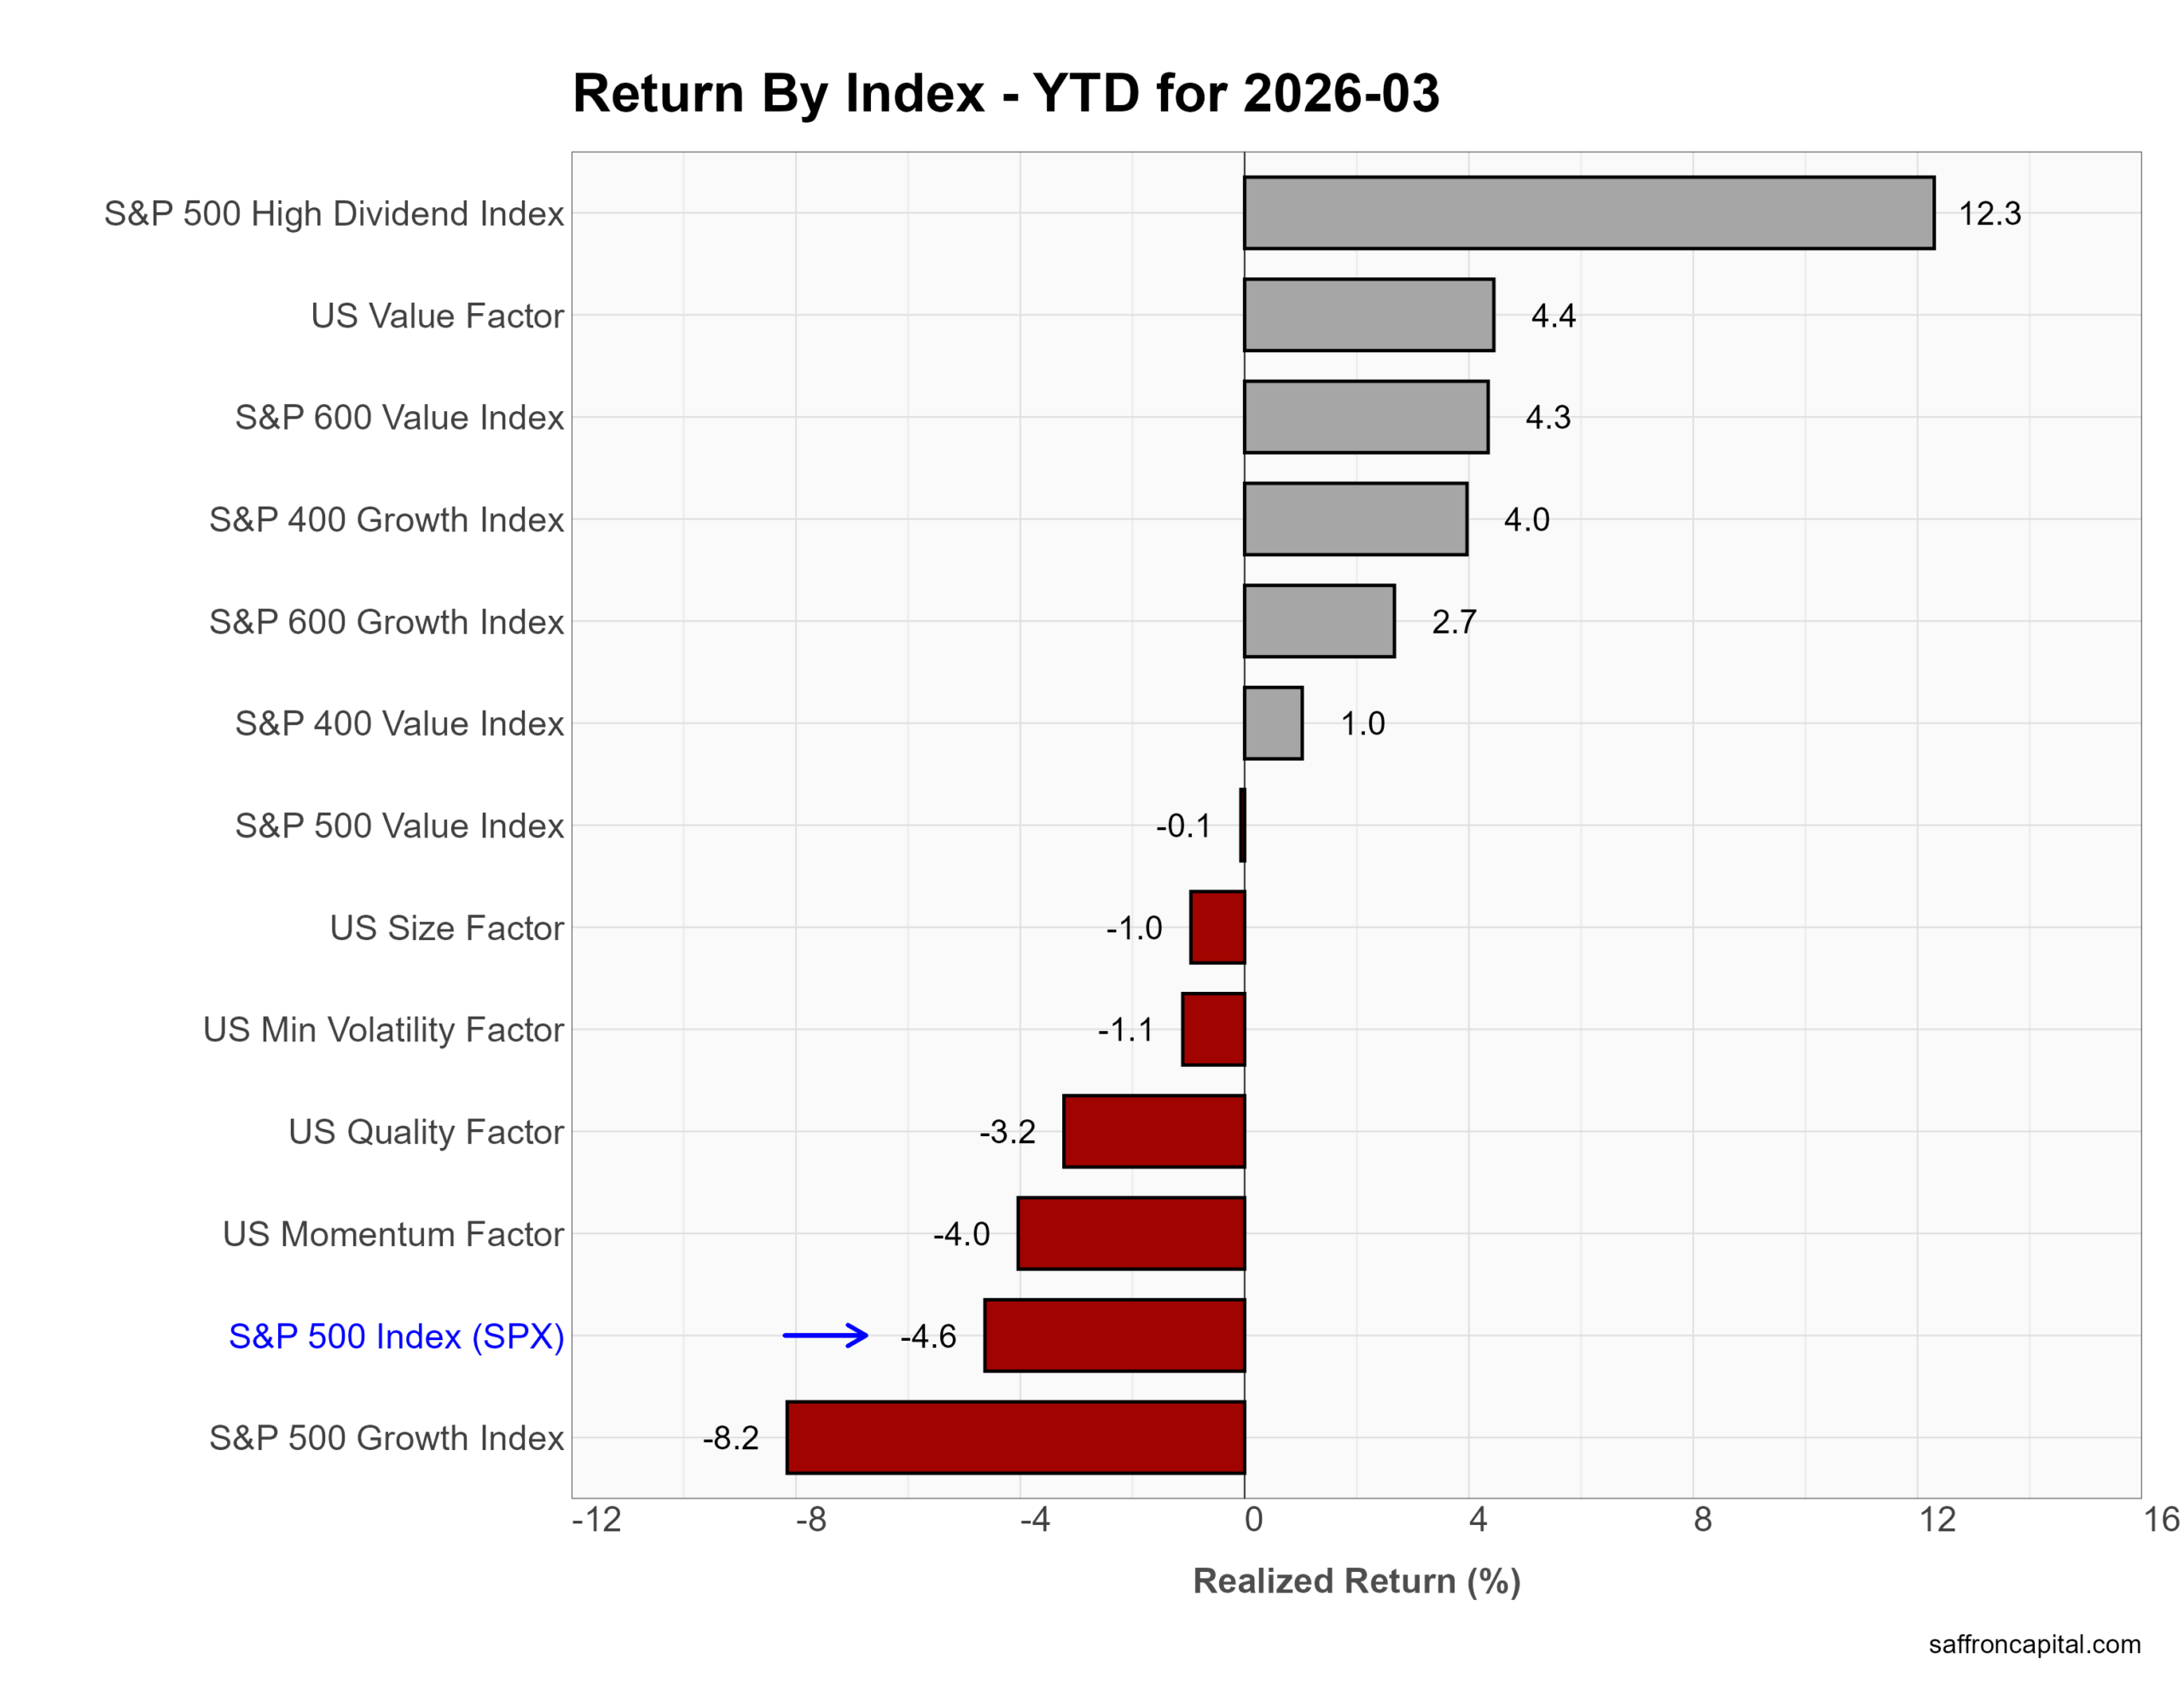
Year to date, leadership remains clear. Income and value dominate. The High Dividend Index leads at +12.3%, followed by the US Value factor at +4.4% and small-cap Value at +4.3%. In contrast, growth continues to lag. The S&P 500 Growth Index is down -8.2%, while Momentum (-4.0%) and Quality (-3.2%) also trail. Overall, 2026 continues to reward income and valuation discipline over growth and trend-following strategies.
Click to enlarge
US Thematic Portfolios
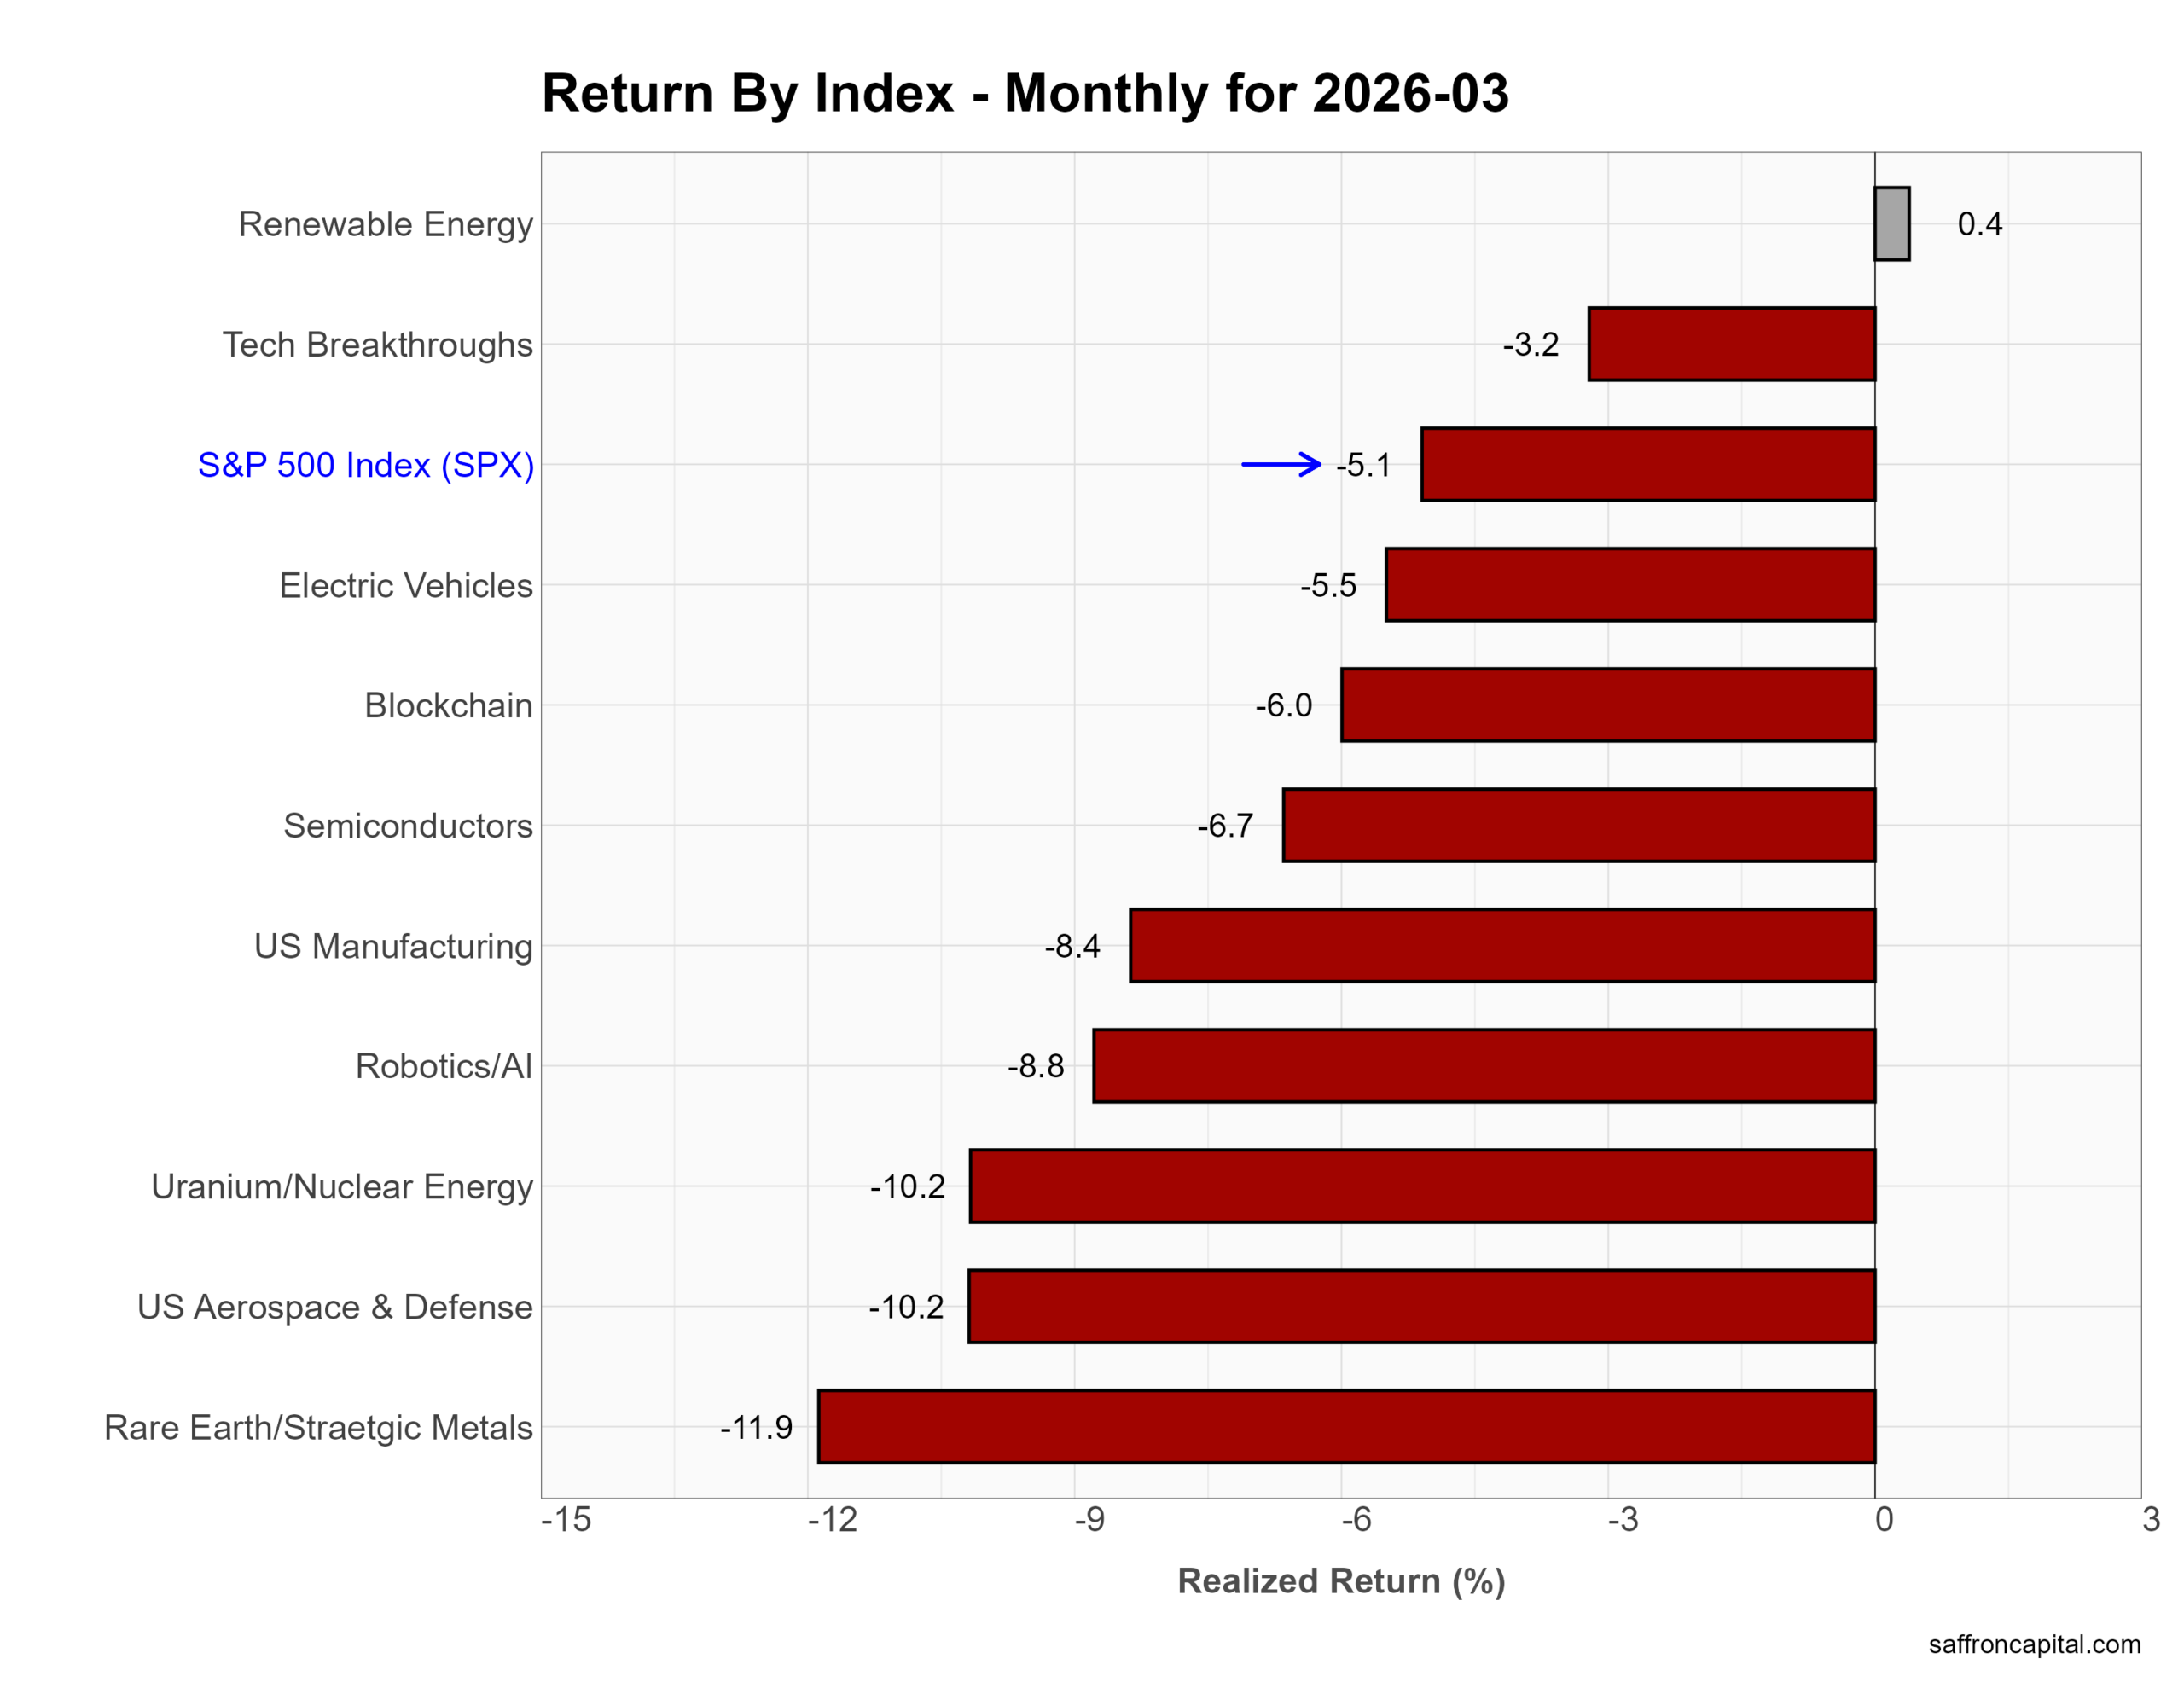
Thematic portfolios group stocks around structural trends—such as energy transition, AI, or supply chain security—rather than traditional sectors. In March, performance skewed defensive and commodity-linked. Renewable Energy held flat (+0.4%), outperforming a weak tape. However, most themes sold off sharply. Semiconductors fell -6.7%, Blockchain dropped -6.0%, and Electric Vehicles declined -5.5% as investors reduced exposure to growth and innovation trades. More cyclical and industrial themes lagged further. US Manufacturing lost -8.4%, Robotics/AI fell -8.8%, and Uranium/Nuclear Energy dropped -10.2%. Rare Earth/Strategic Metals led declines at -11.9%, reflecting profit-taking after strong prior gains.
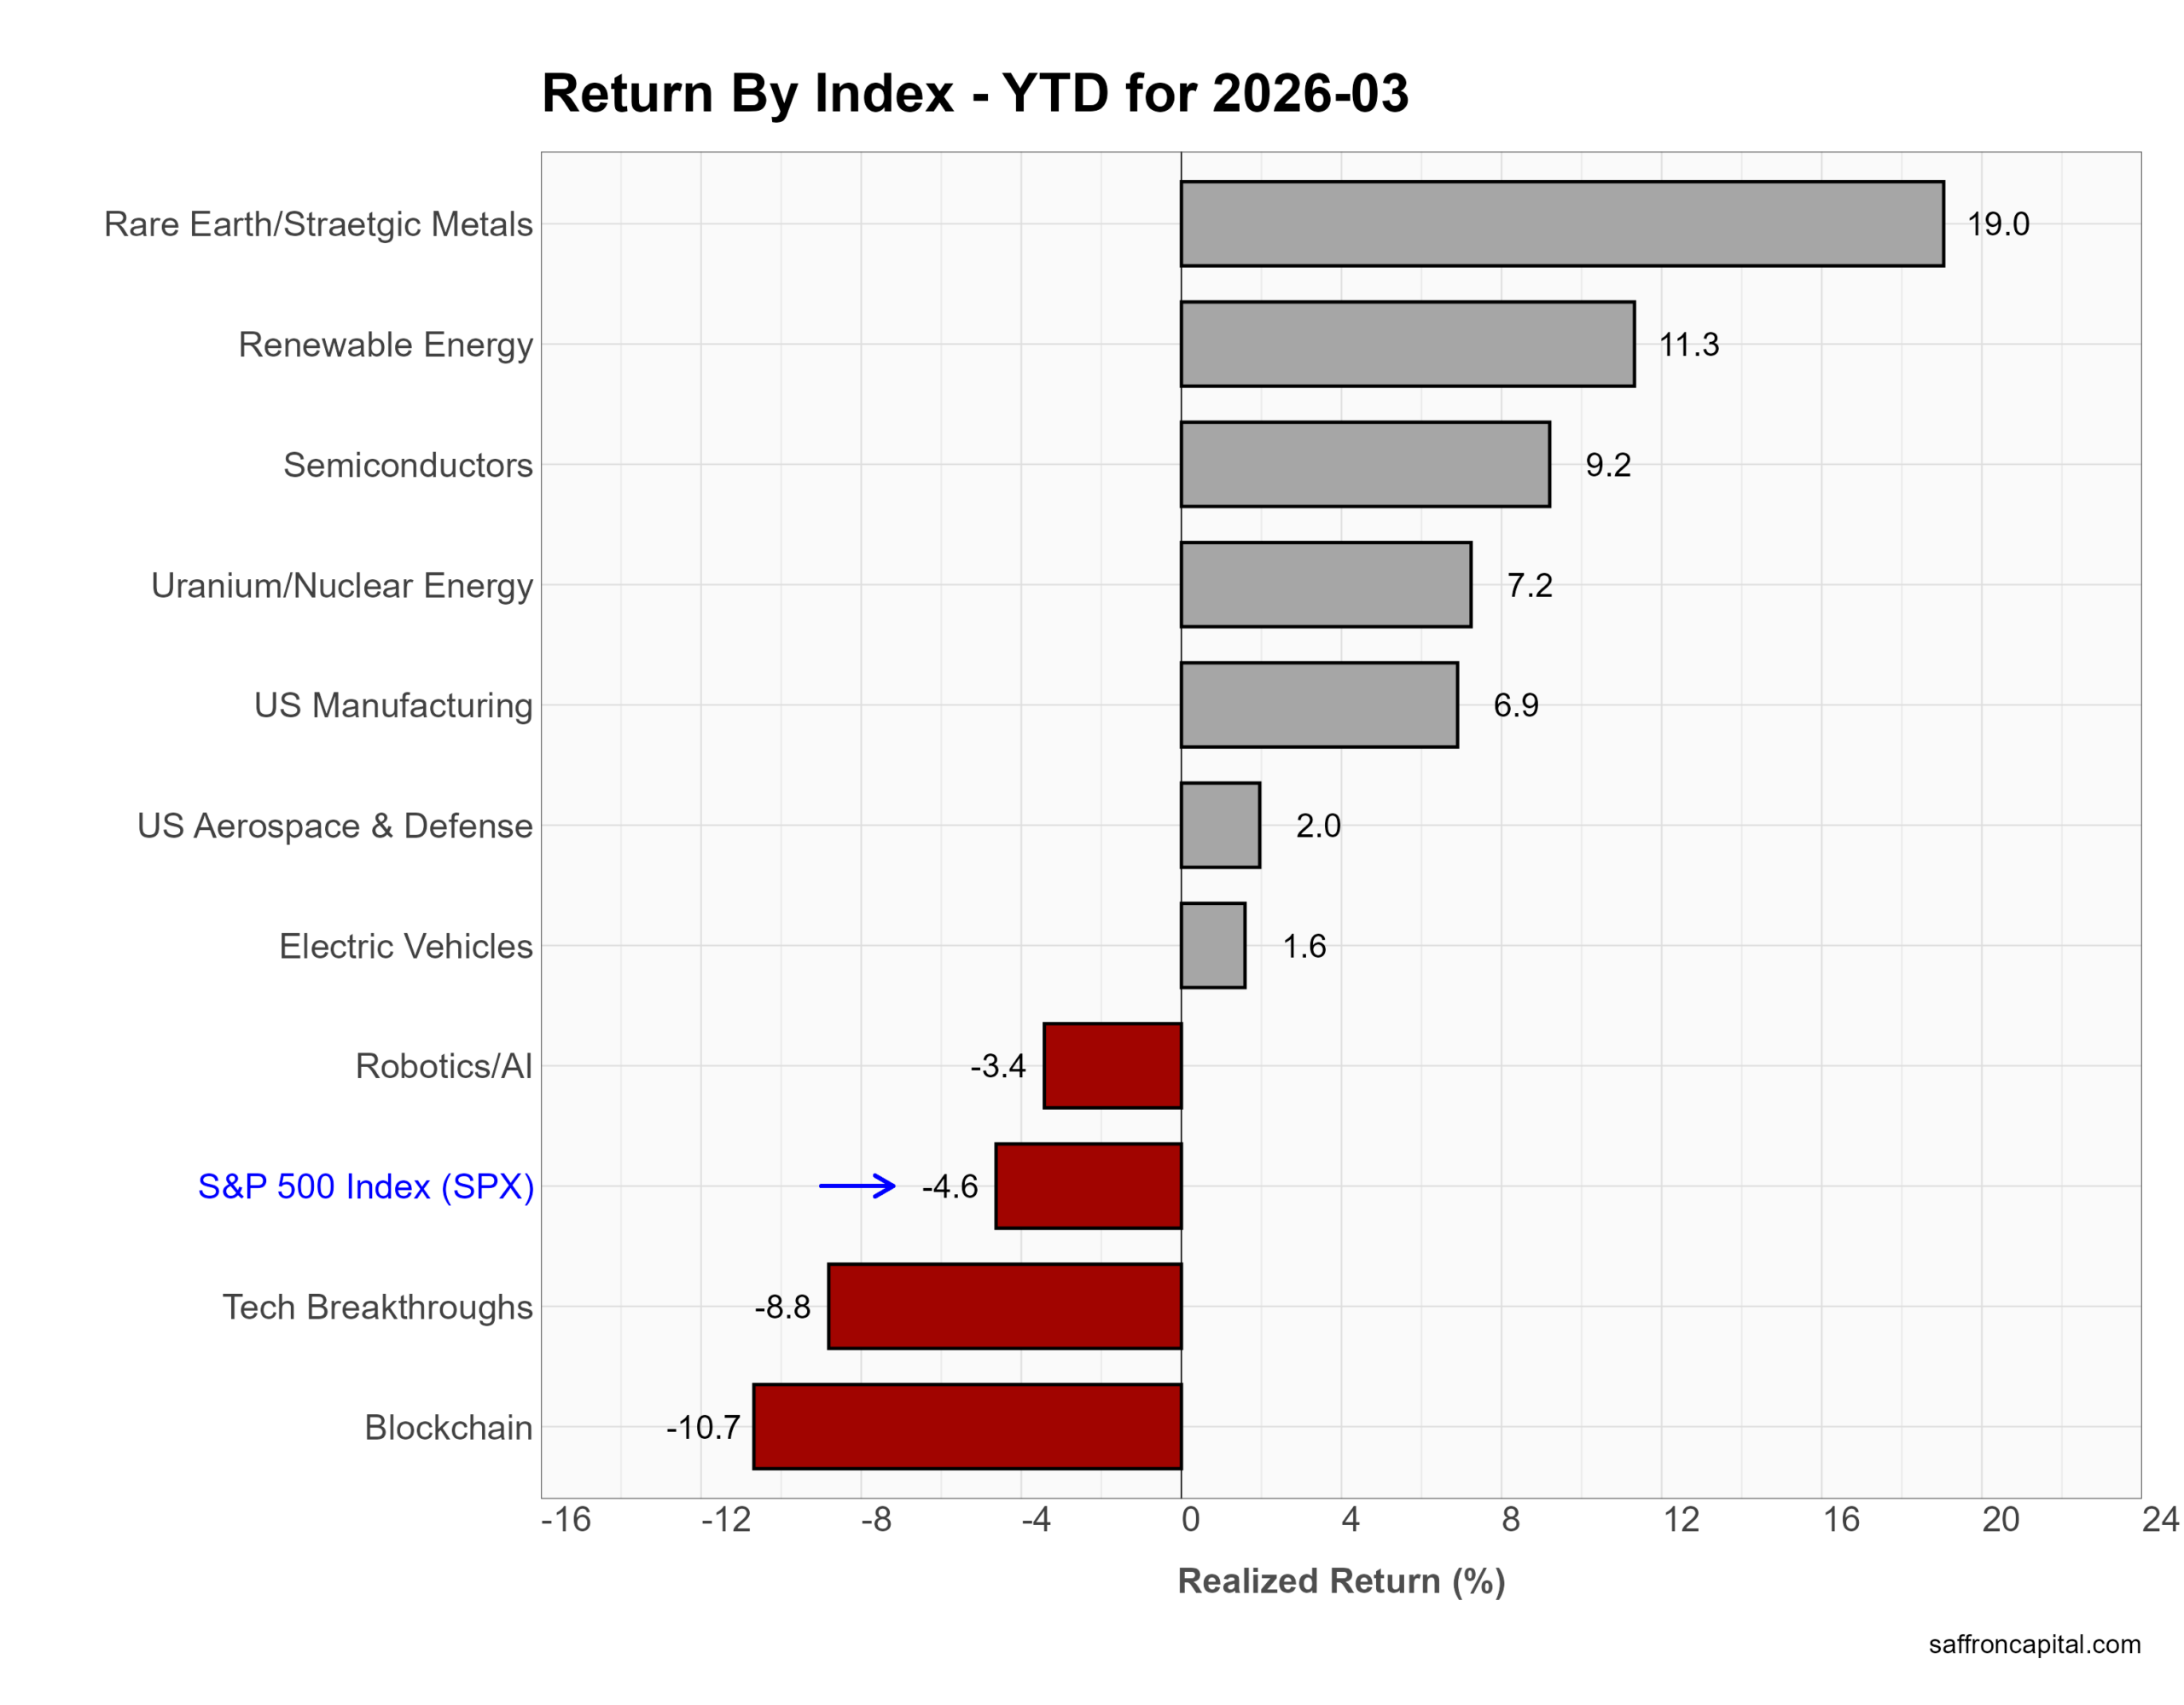
Year to date, leadership still favors real assets and strategic supply chains. Rare Earth/Strategic Metals lead at +19.0%, followed by Renewable Energy (+11.3%) and Semiconductors (+9.2%). Uranium/Nuclear Energy (+7.2%) and US Manufacturing (+6.9%) also show strength. In contrast, speculative tech themes lag. Blockchain is down -10.7%, and Tech Breakthroughs fell -8.8%. Overall, 2026 continues to reward tangible, policy-driven themes over high-beta innovation trades.
Click to enlarge
Developed Market Equities
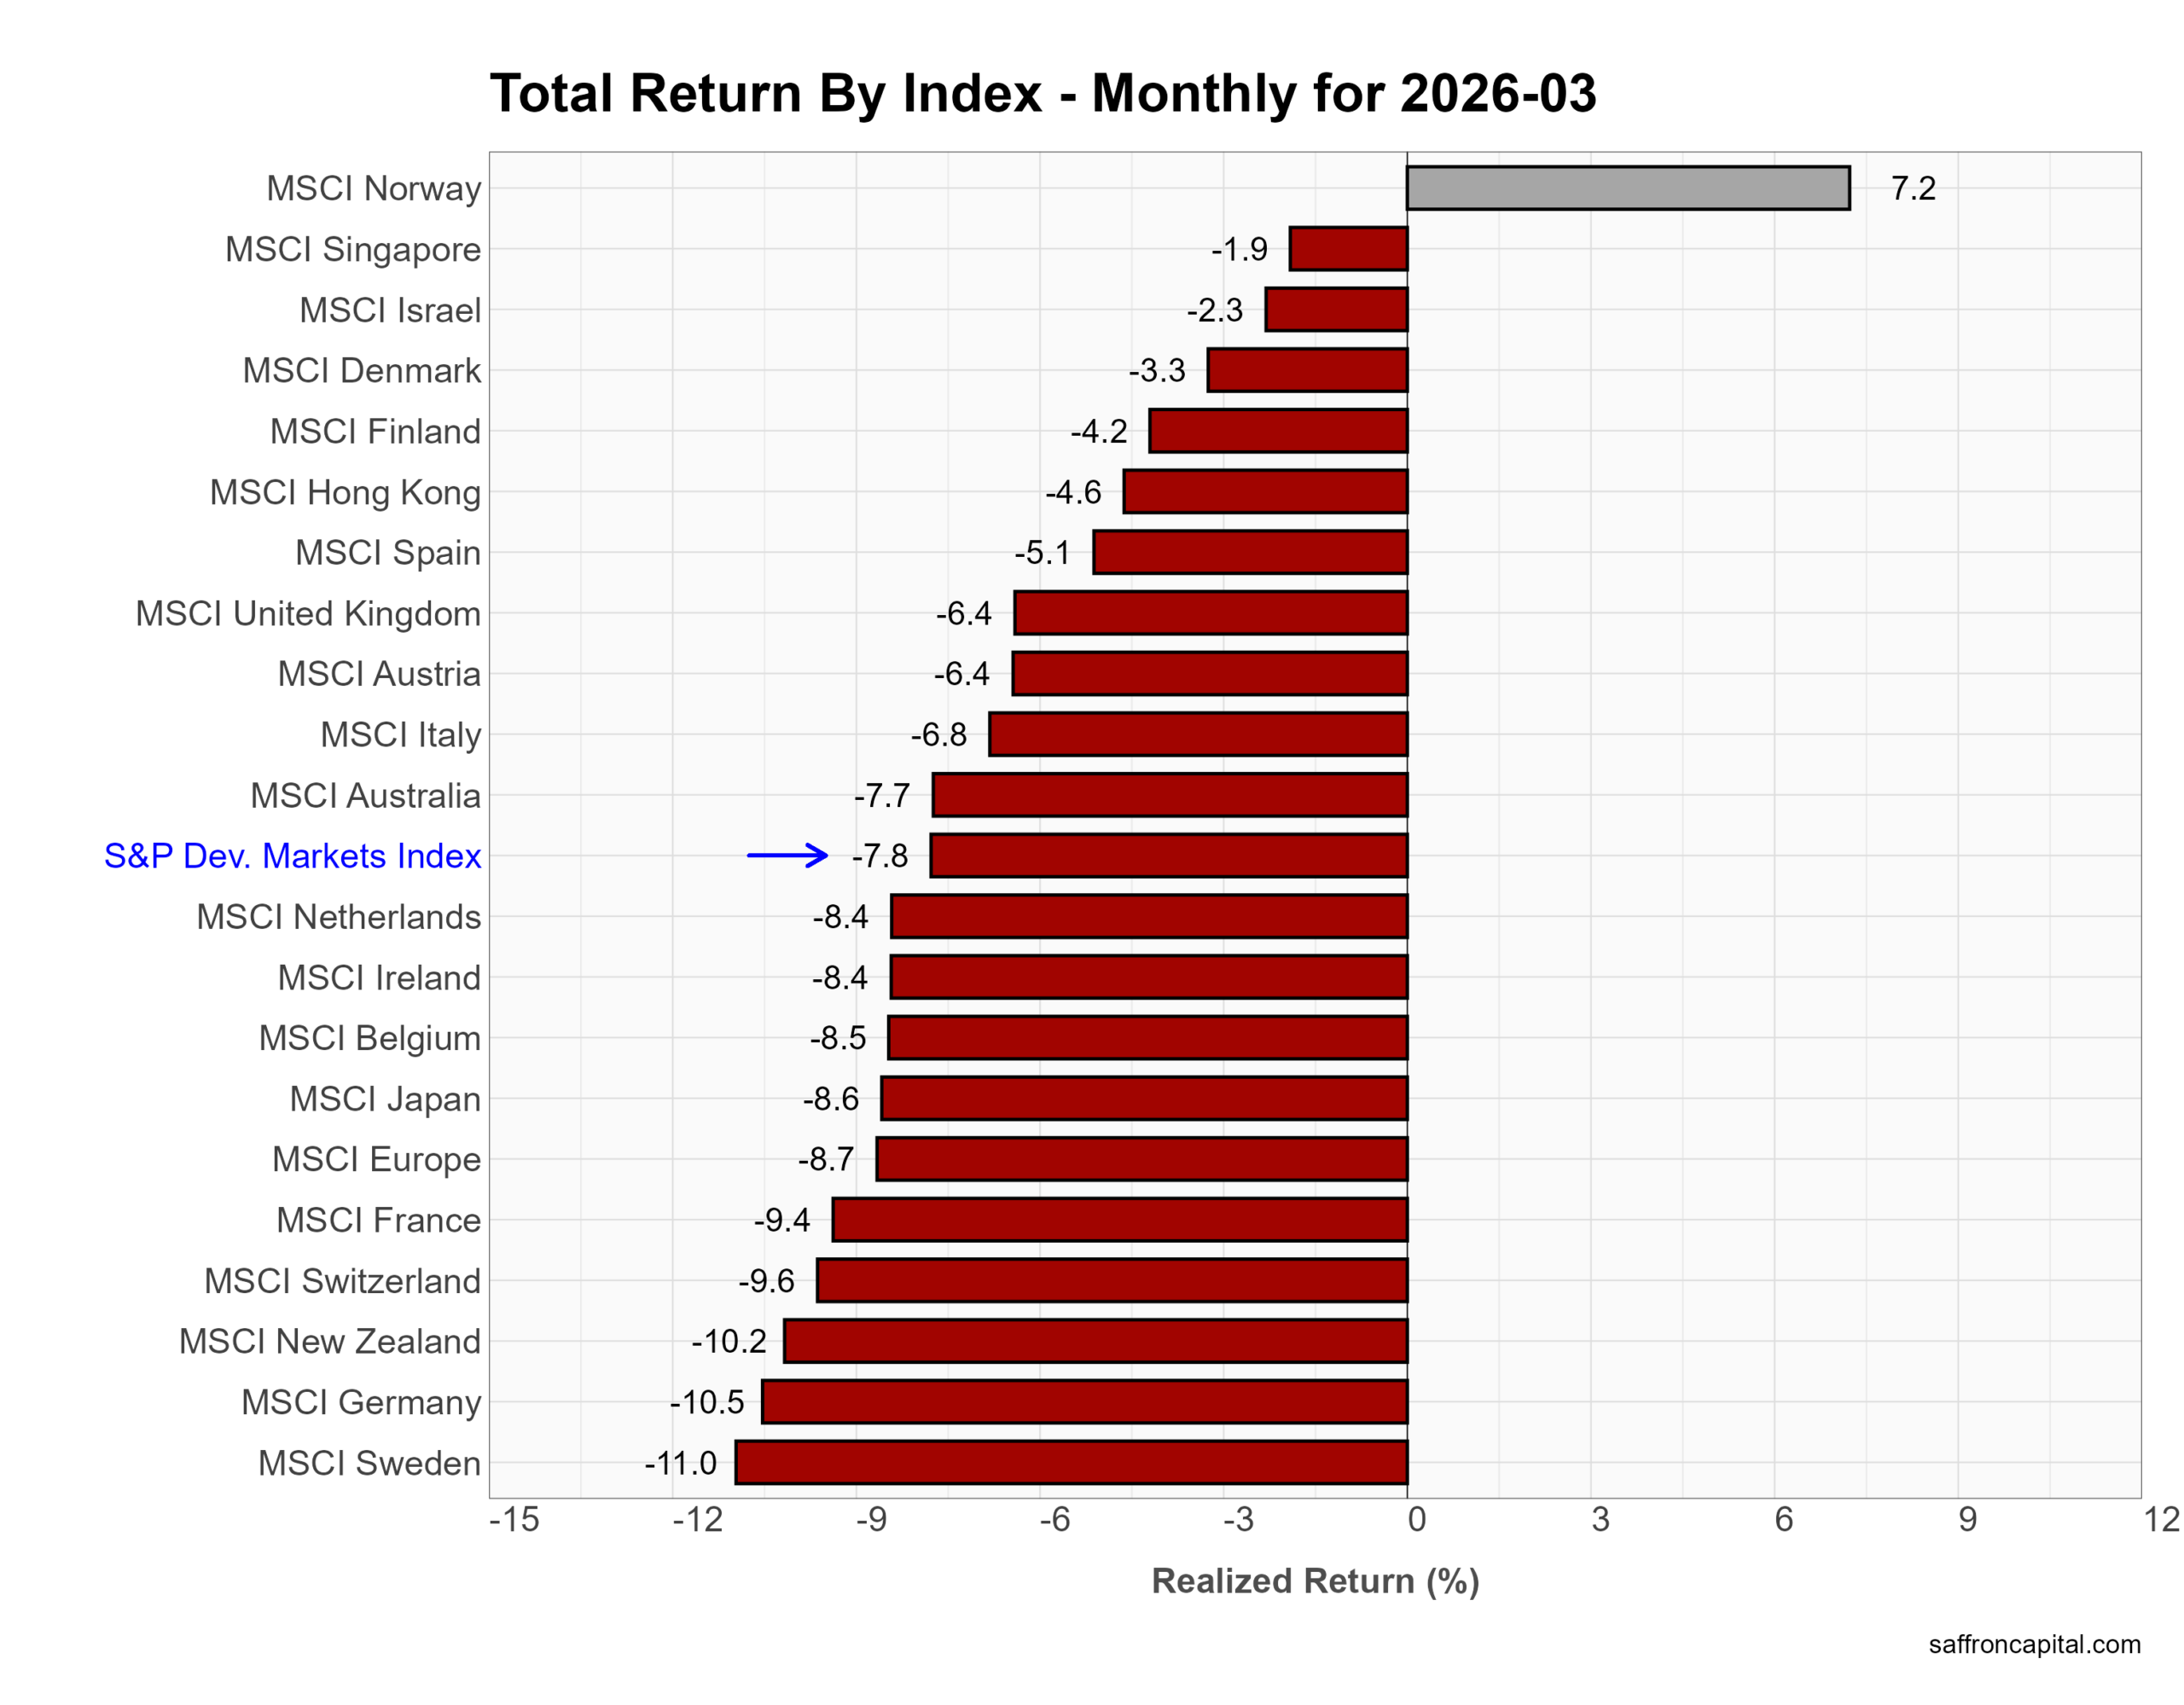
March returns show developed markets underperforming the U.S. First, the S&P Developed Markets Index fell -7.8%, lagging the S&P 500 at -5.1%. Losses were broad across Europe and Asia. Germany dropped -10.5%, France -9.4%, and Japan -8.6% as global growth fears and higher rates pressured equities. The U.K. declined -6.4%, while Australia fell -7.7%. Norway stood out as the lone gainer, rising +7.2% on energy strength. Overall, developed markets showed deeper downside sensitivity to the global macro shock than the U.S.
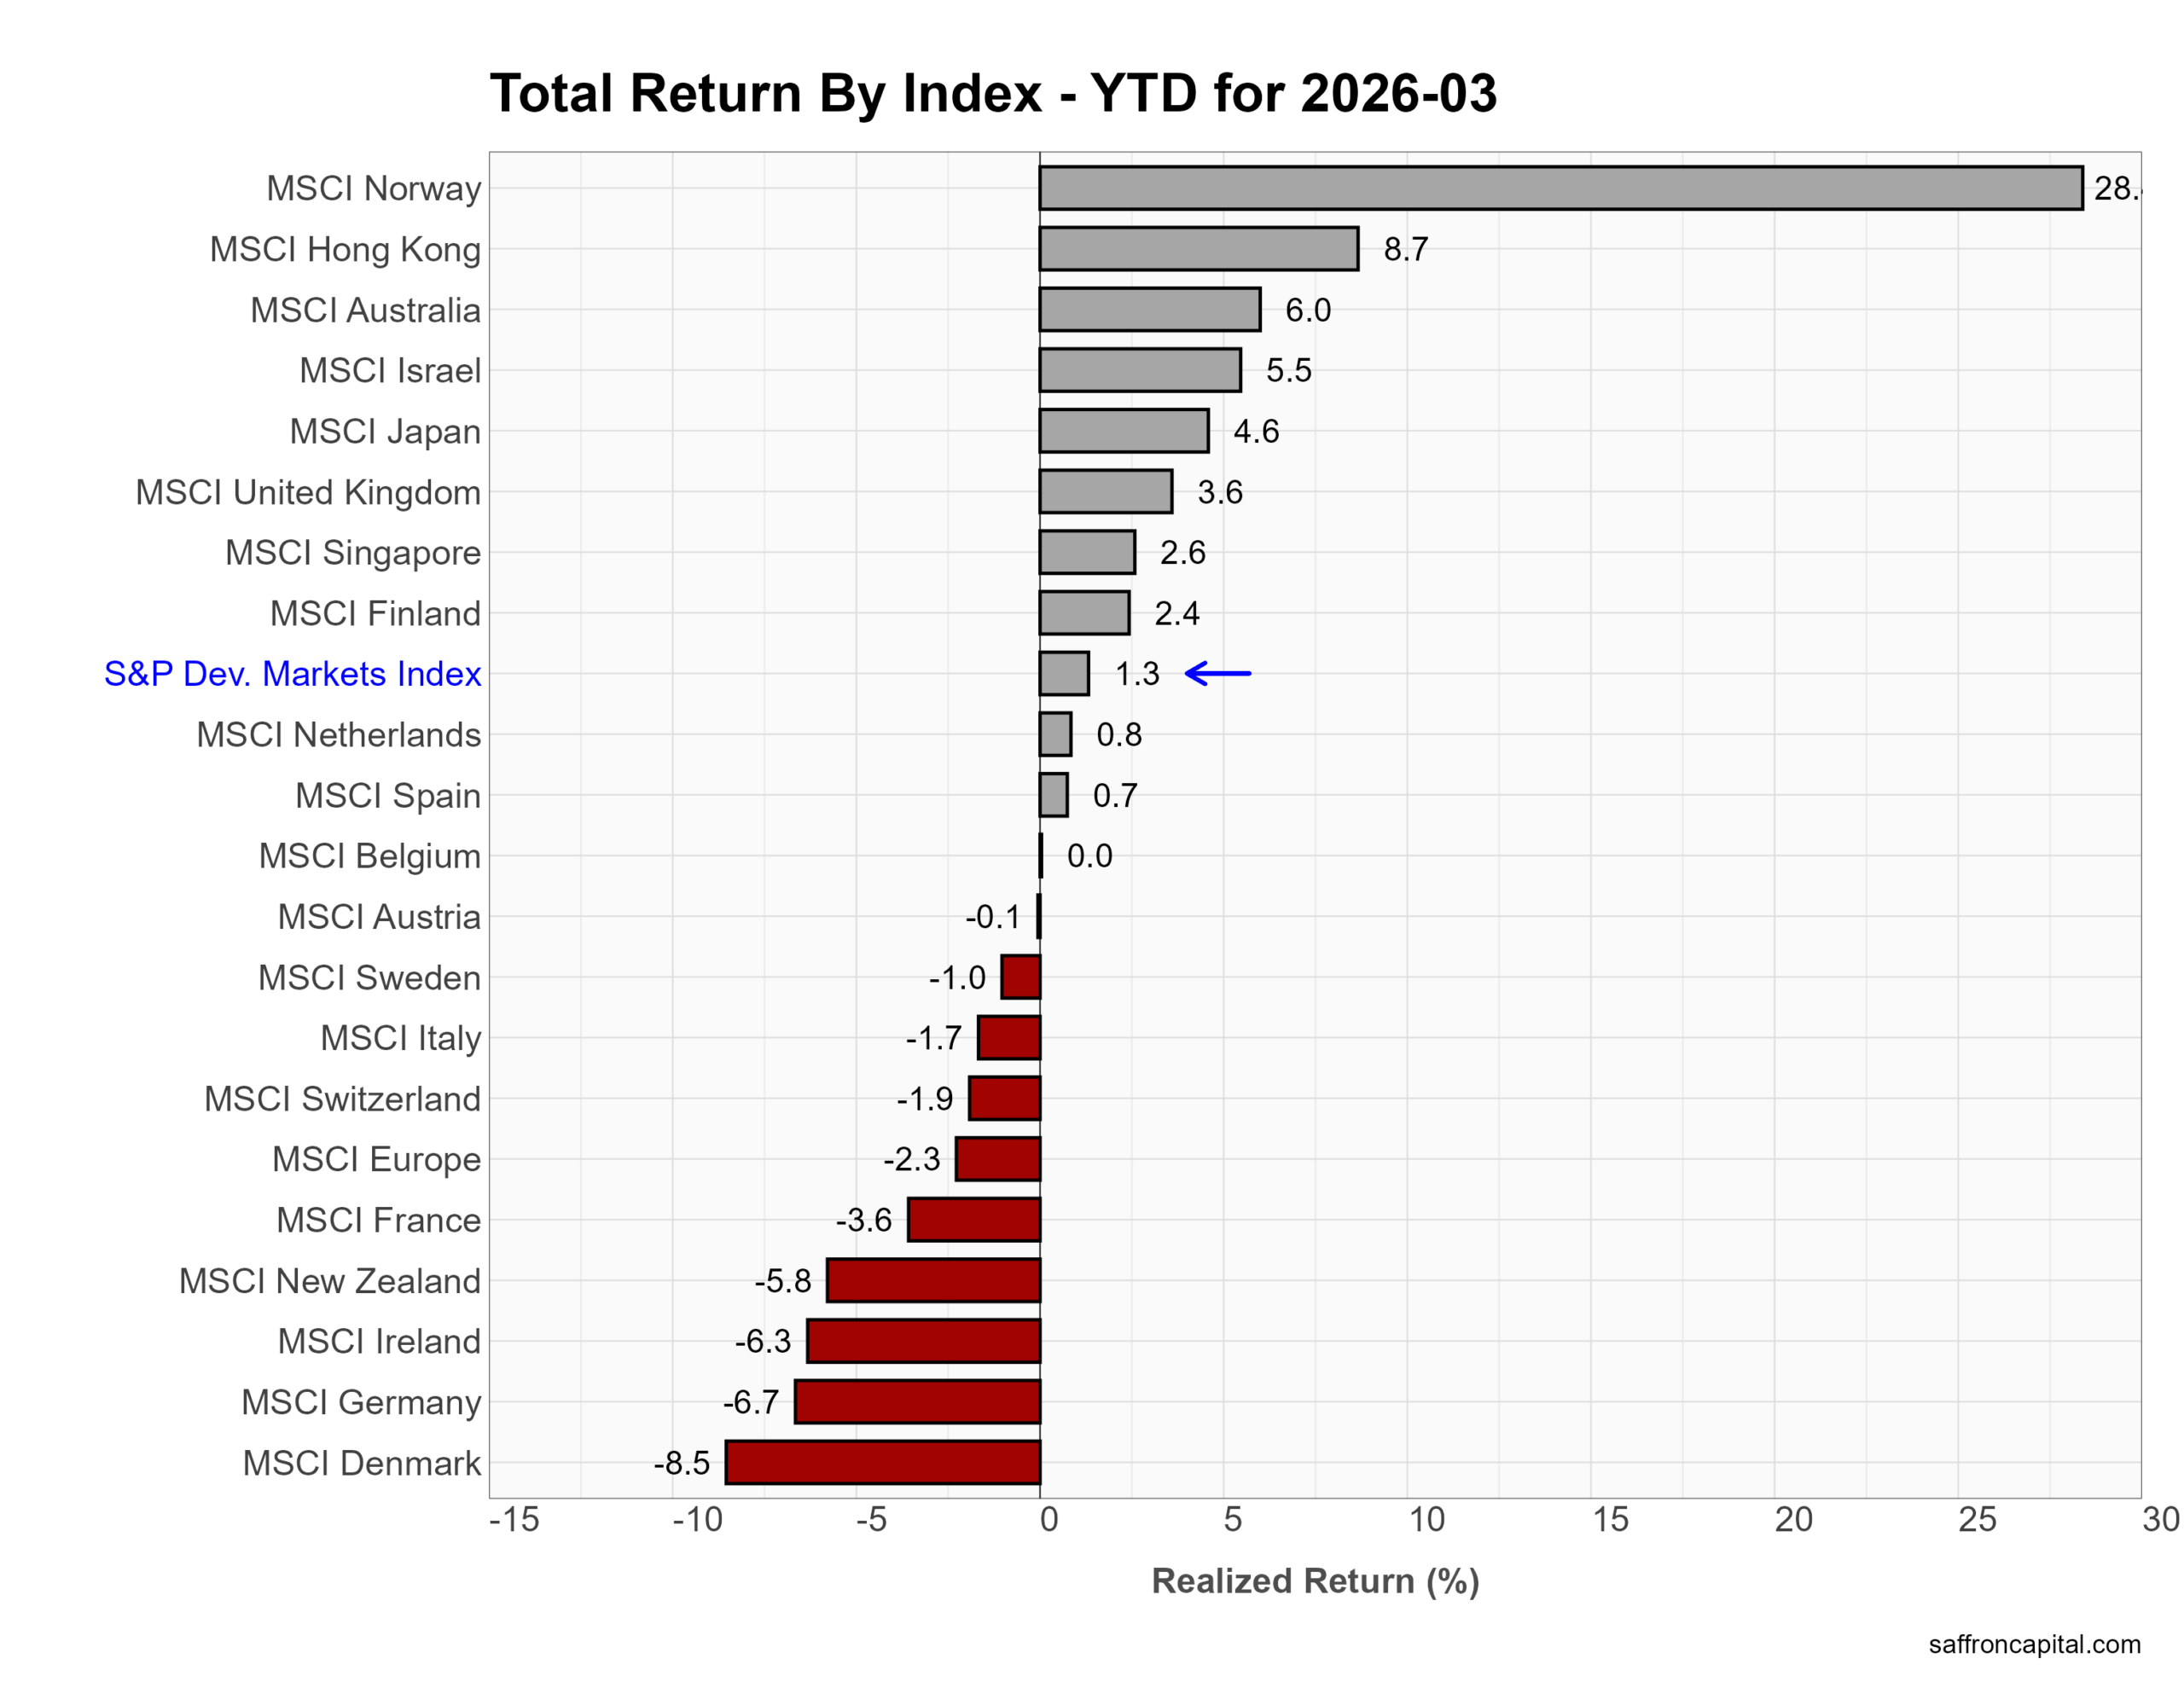
Year to date, performance still favors select international exposure. Norway leads sharply at +28%, while Hong Kong (+8.7%) and Australia (+6.0%) post solid gains. Japan is up +4.6%, and the U.K. sits at +3.6%. However, Europe lags, with Germany (-6.7%) and France (-3.6%) in negative territory. The S&P Developed Markets Index is up just +1.3%, trailing more resilient pockets of global equity markets.
Click to enlarge
Emerging Market Equities
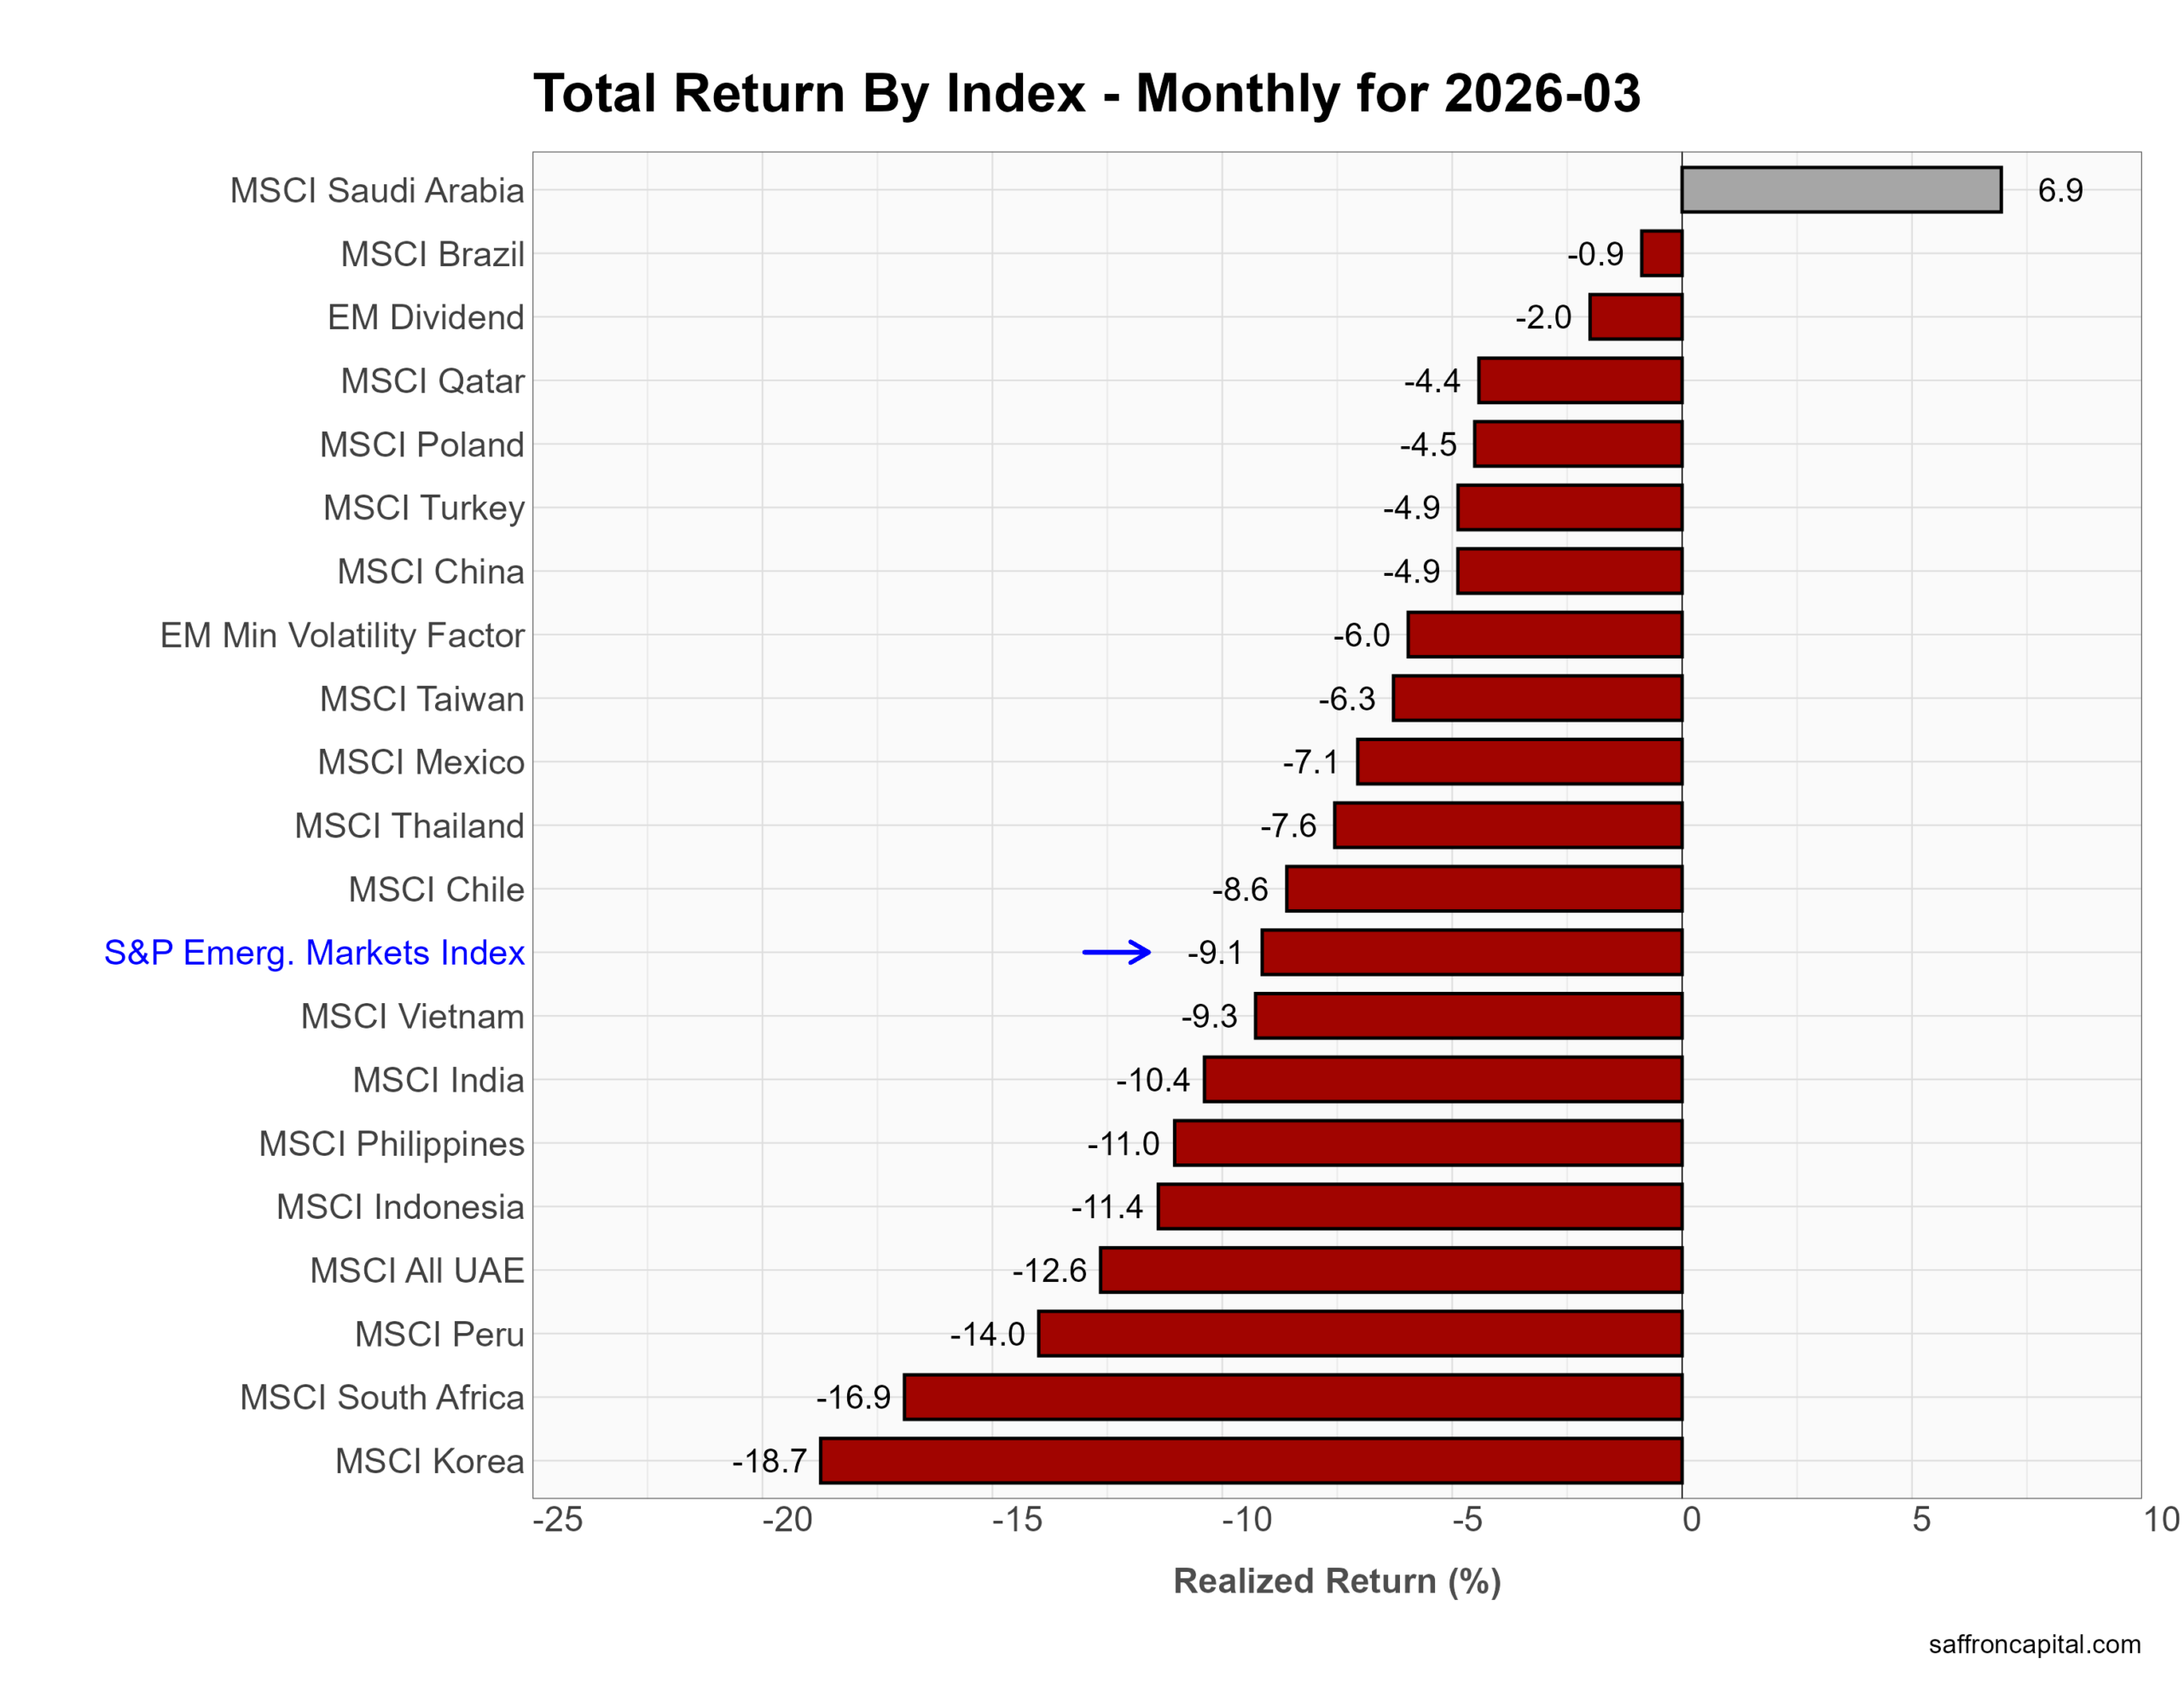
March returns show broad weakness across emerging markets. First, the S&P Emerging Markets Index fell -9.1%, underperforming the S&P 500 at -5.1%. Losses were widespread and severe. Korea dropped -18.7%, South Africa -16.9%, and Peru -14.0% as global growth fears and risk aversion intensified. Asia also weakened, with India down -10.4%, Indonesia -11.4%, and Vietnam -9.3%. China declined -4.9%, reflecting continued economic uncertainty. Saudi Arabia stood out as the lone gainer, rising +6.9% on energy strength. Overall, emerging markets showed high beta to the global selloff, with deep drawdowns across regions.
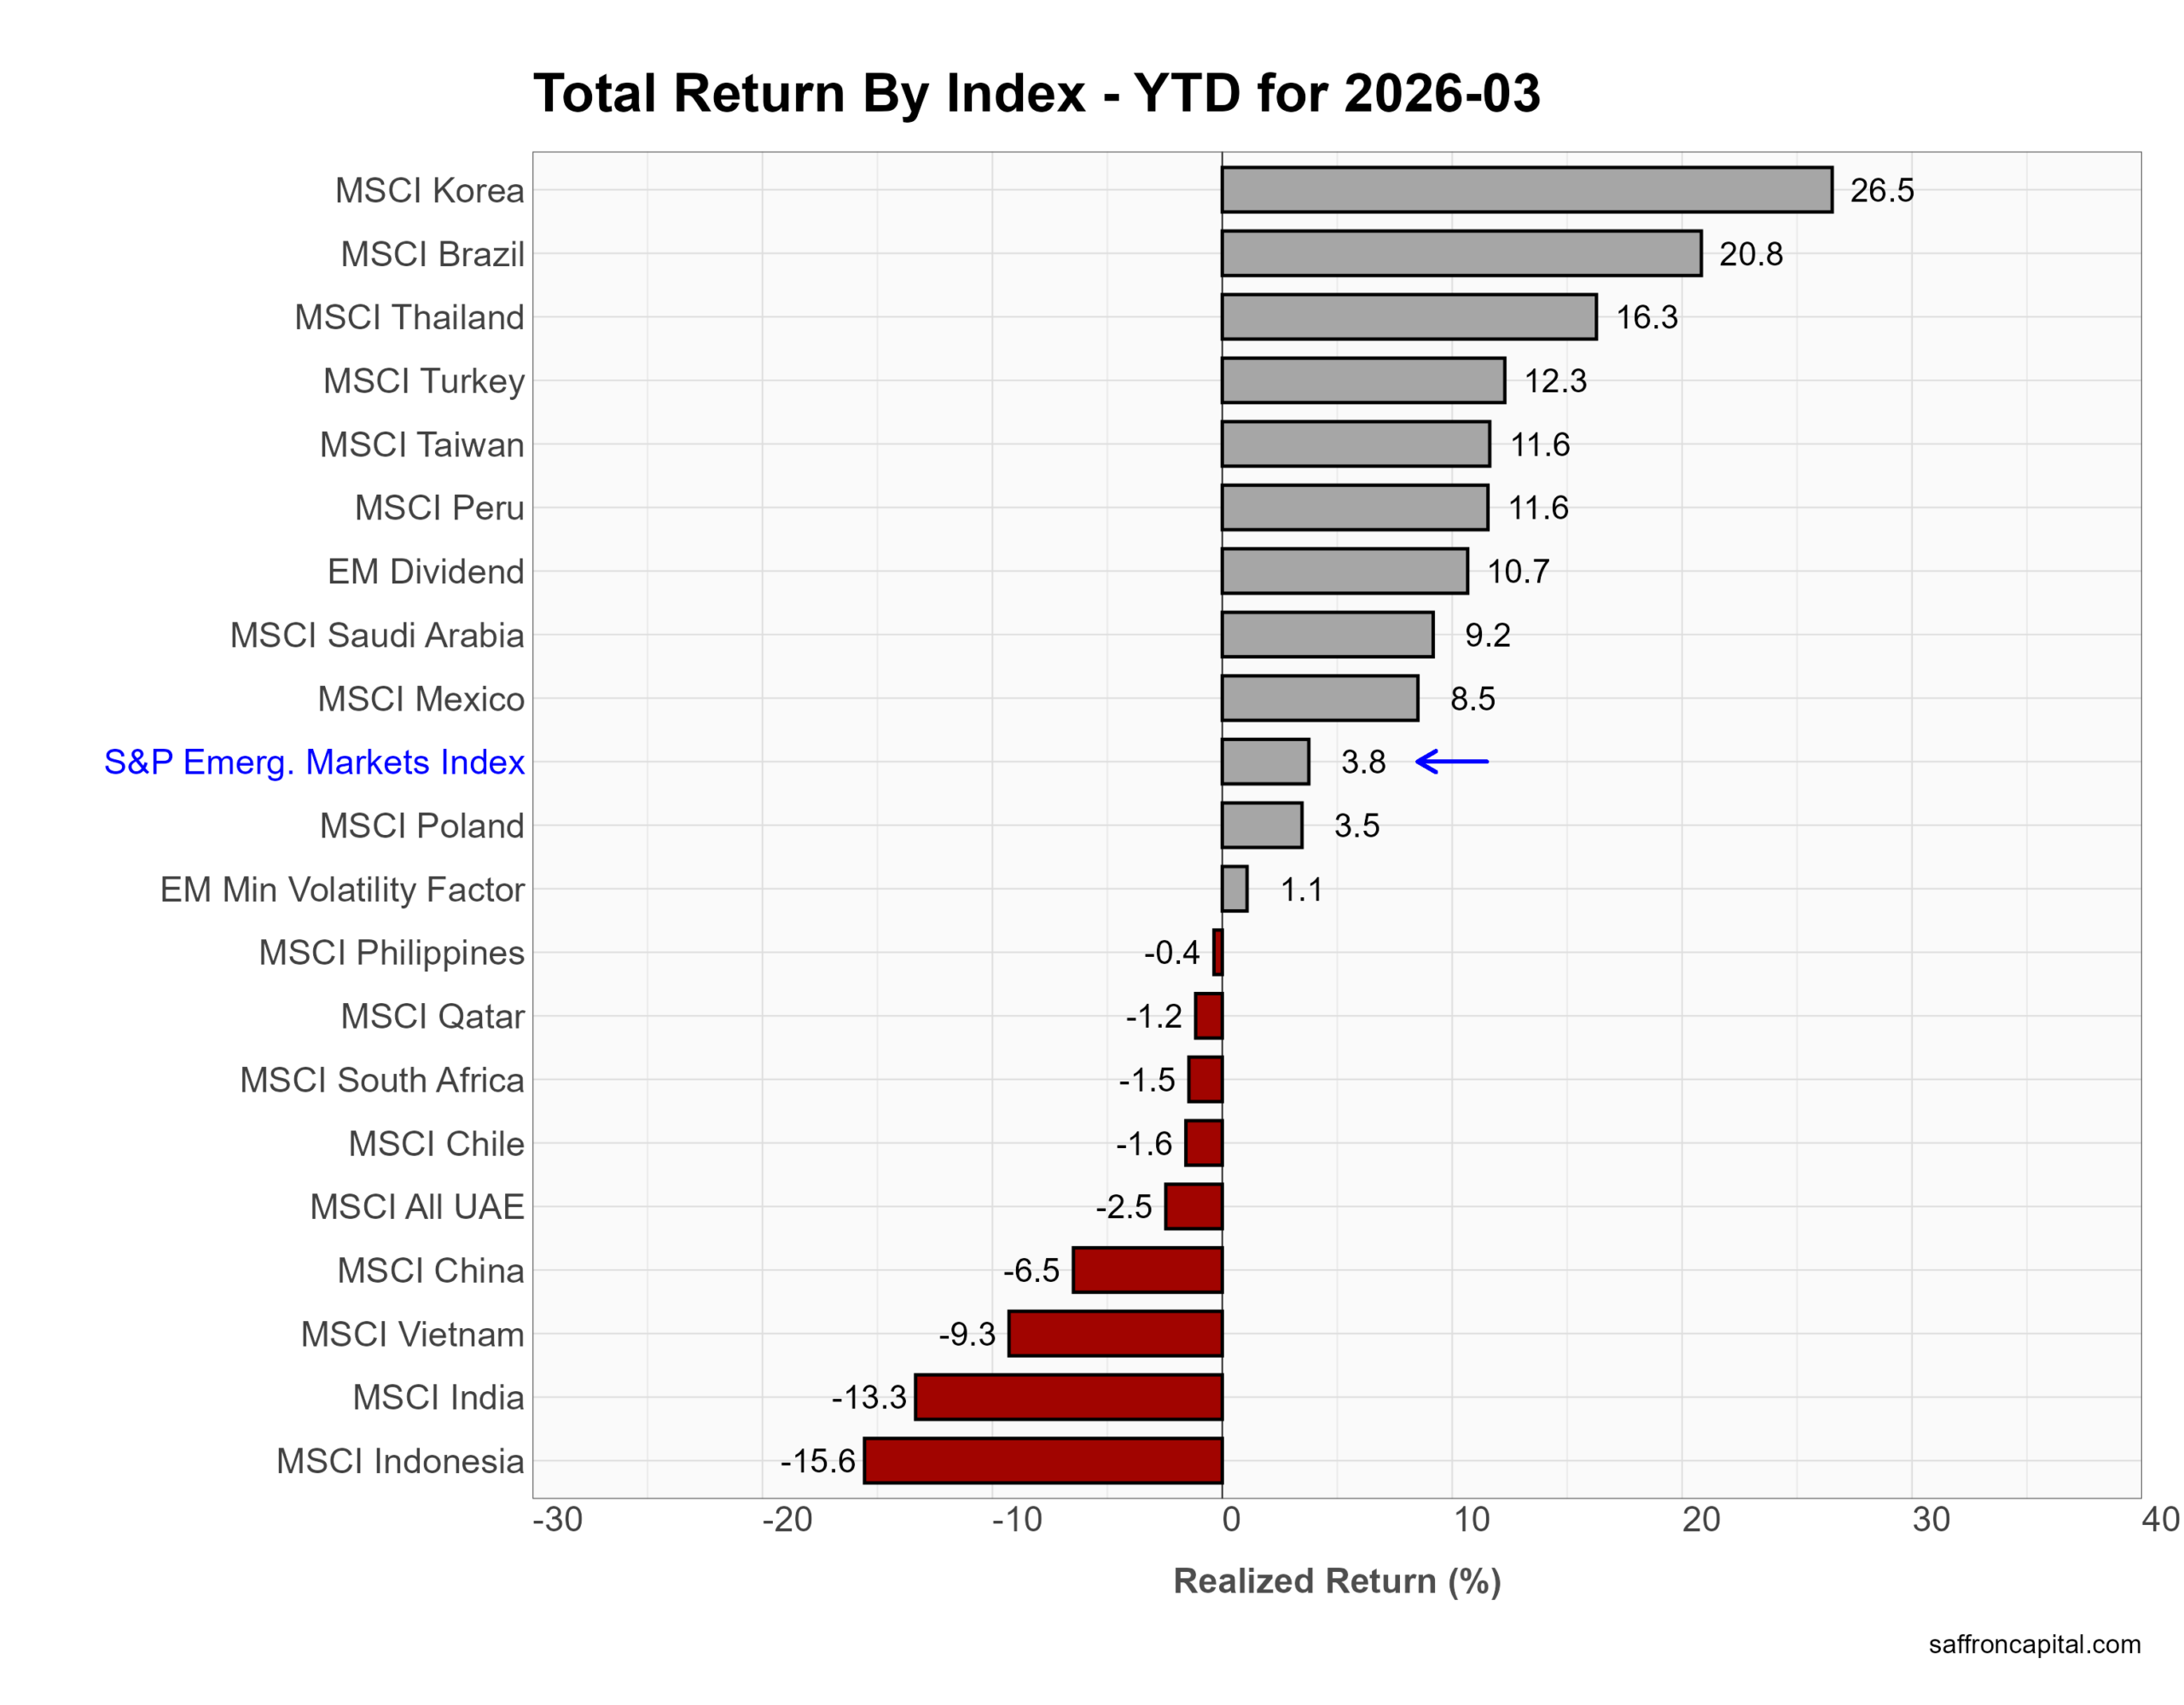
Year to date, performance remains mixed with pockets of strength. Korea leads at +26.5%, followed by Brazil (+20.8%) and Thailand (+16.3%), supported by commodities and export momentum. Taiwan and Peru are both up +11.6%, while Saudi Arabia gained +9.2%. The S&P Emerging Markets Index sits at +3.8%. However, several markets lag, with Indonesia (-15.6%), India (-13.3%), and Vietnam (-9.3%) in negative territory. Overall, 2026 rewards select exporters and commodity-linked economies, while domestic-demand stories struggle.
Click to enlarge
Government Bonds
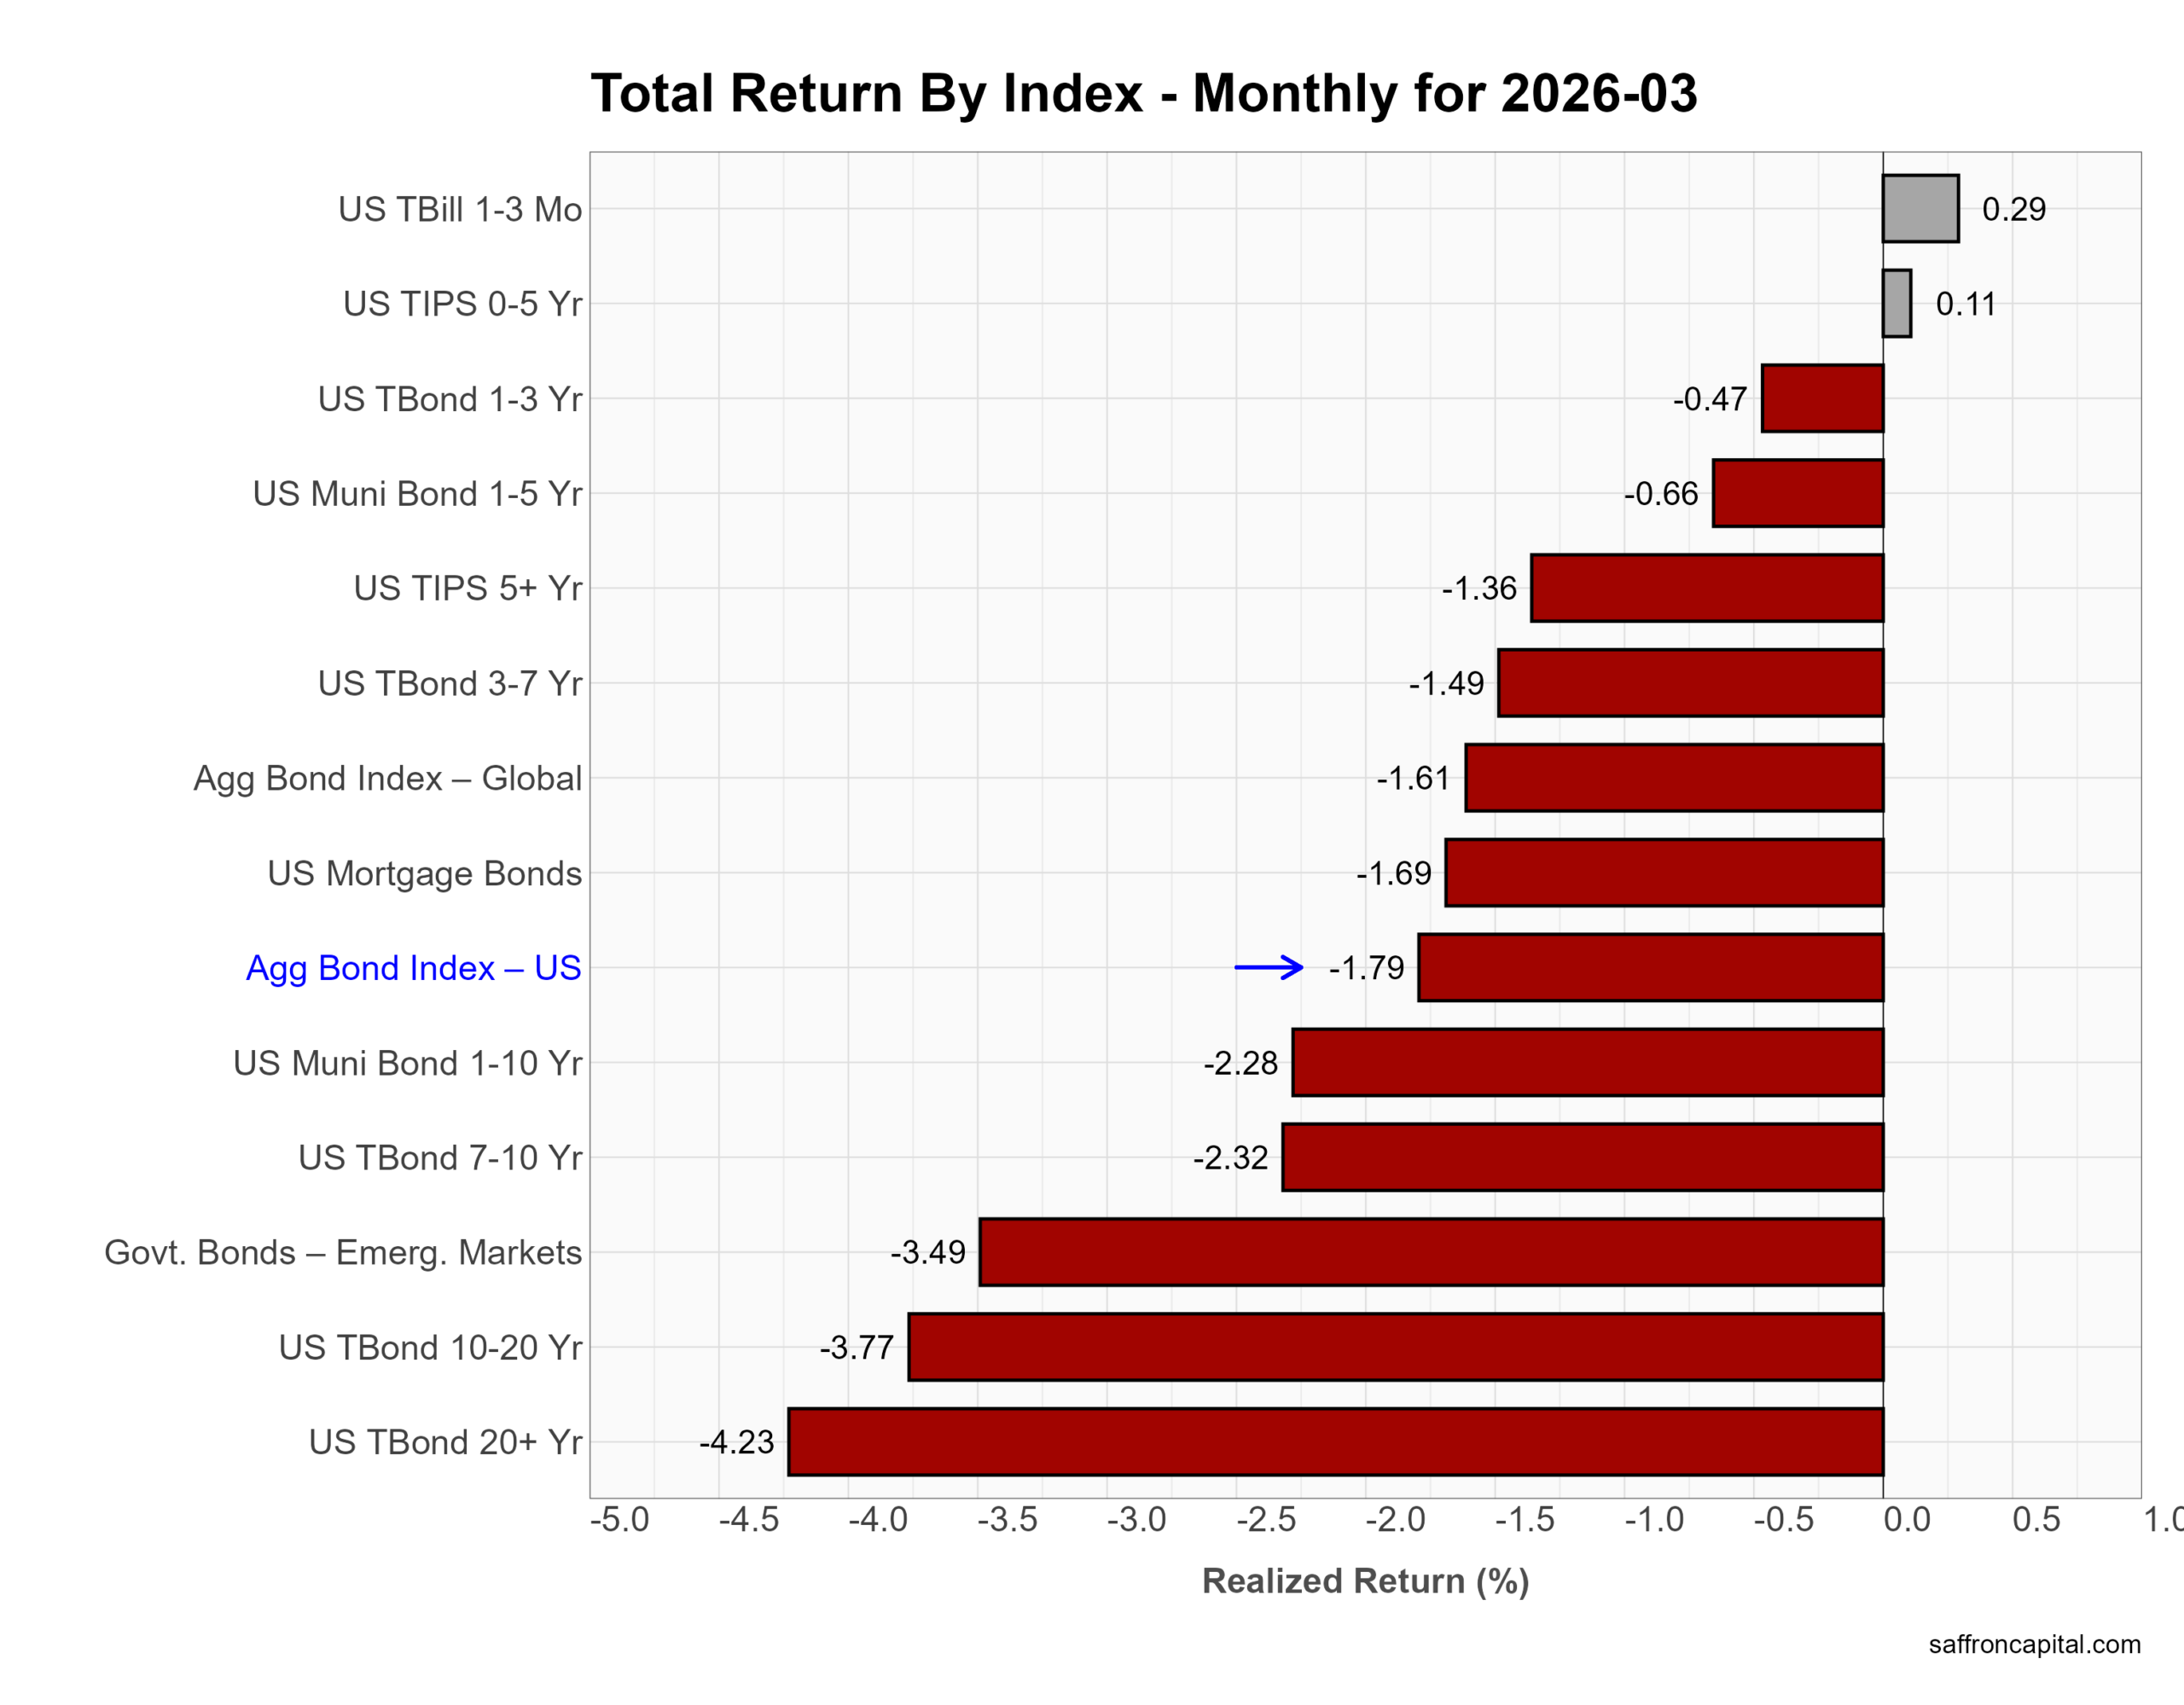
March reversed the duration trade as yields moved higher. First, long Treasuries led the decline. US Treasury 20+ Year bonds fell -4.23%, and 10–20 Year bonds dropped -3.77%. Mid-duration also weakened, with 7–10 Year Treasuries down -2.32% and 3–7 Year bonds off -1.49%. The US Aggregate Bond Index declined -1.79%, while mortgages (-1.69%) and global aggregate bonds (-1.61%) followed. In contrast, short-duration held up. T-bills gained +0.29%, and 0–5 Year TIPS rose +0.11%. Overall, rising inflation expectations and supply pressures pushed investors out of duration and back toward the front end.
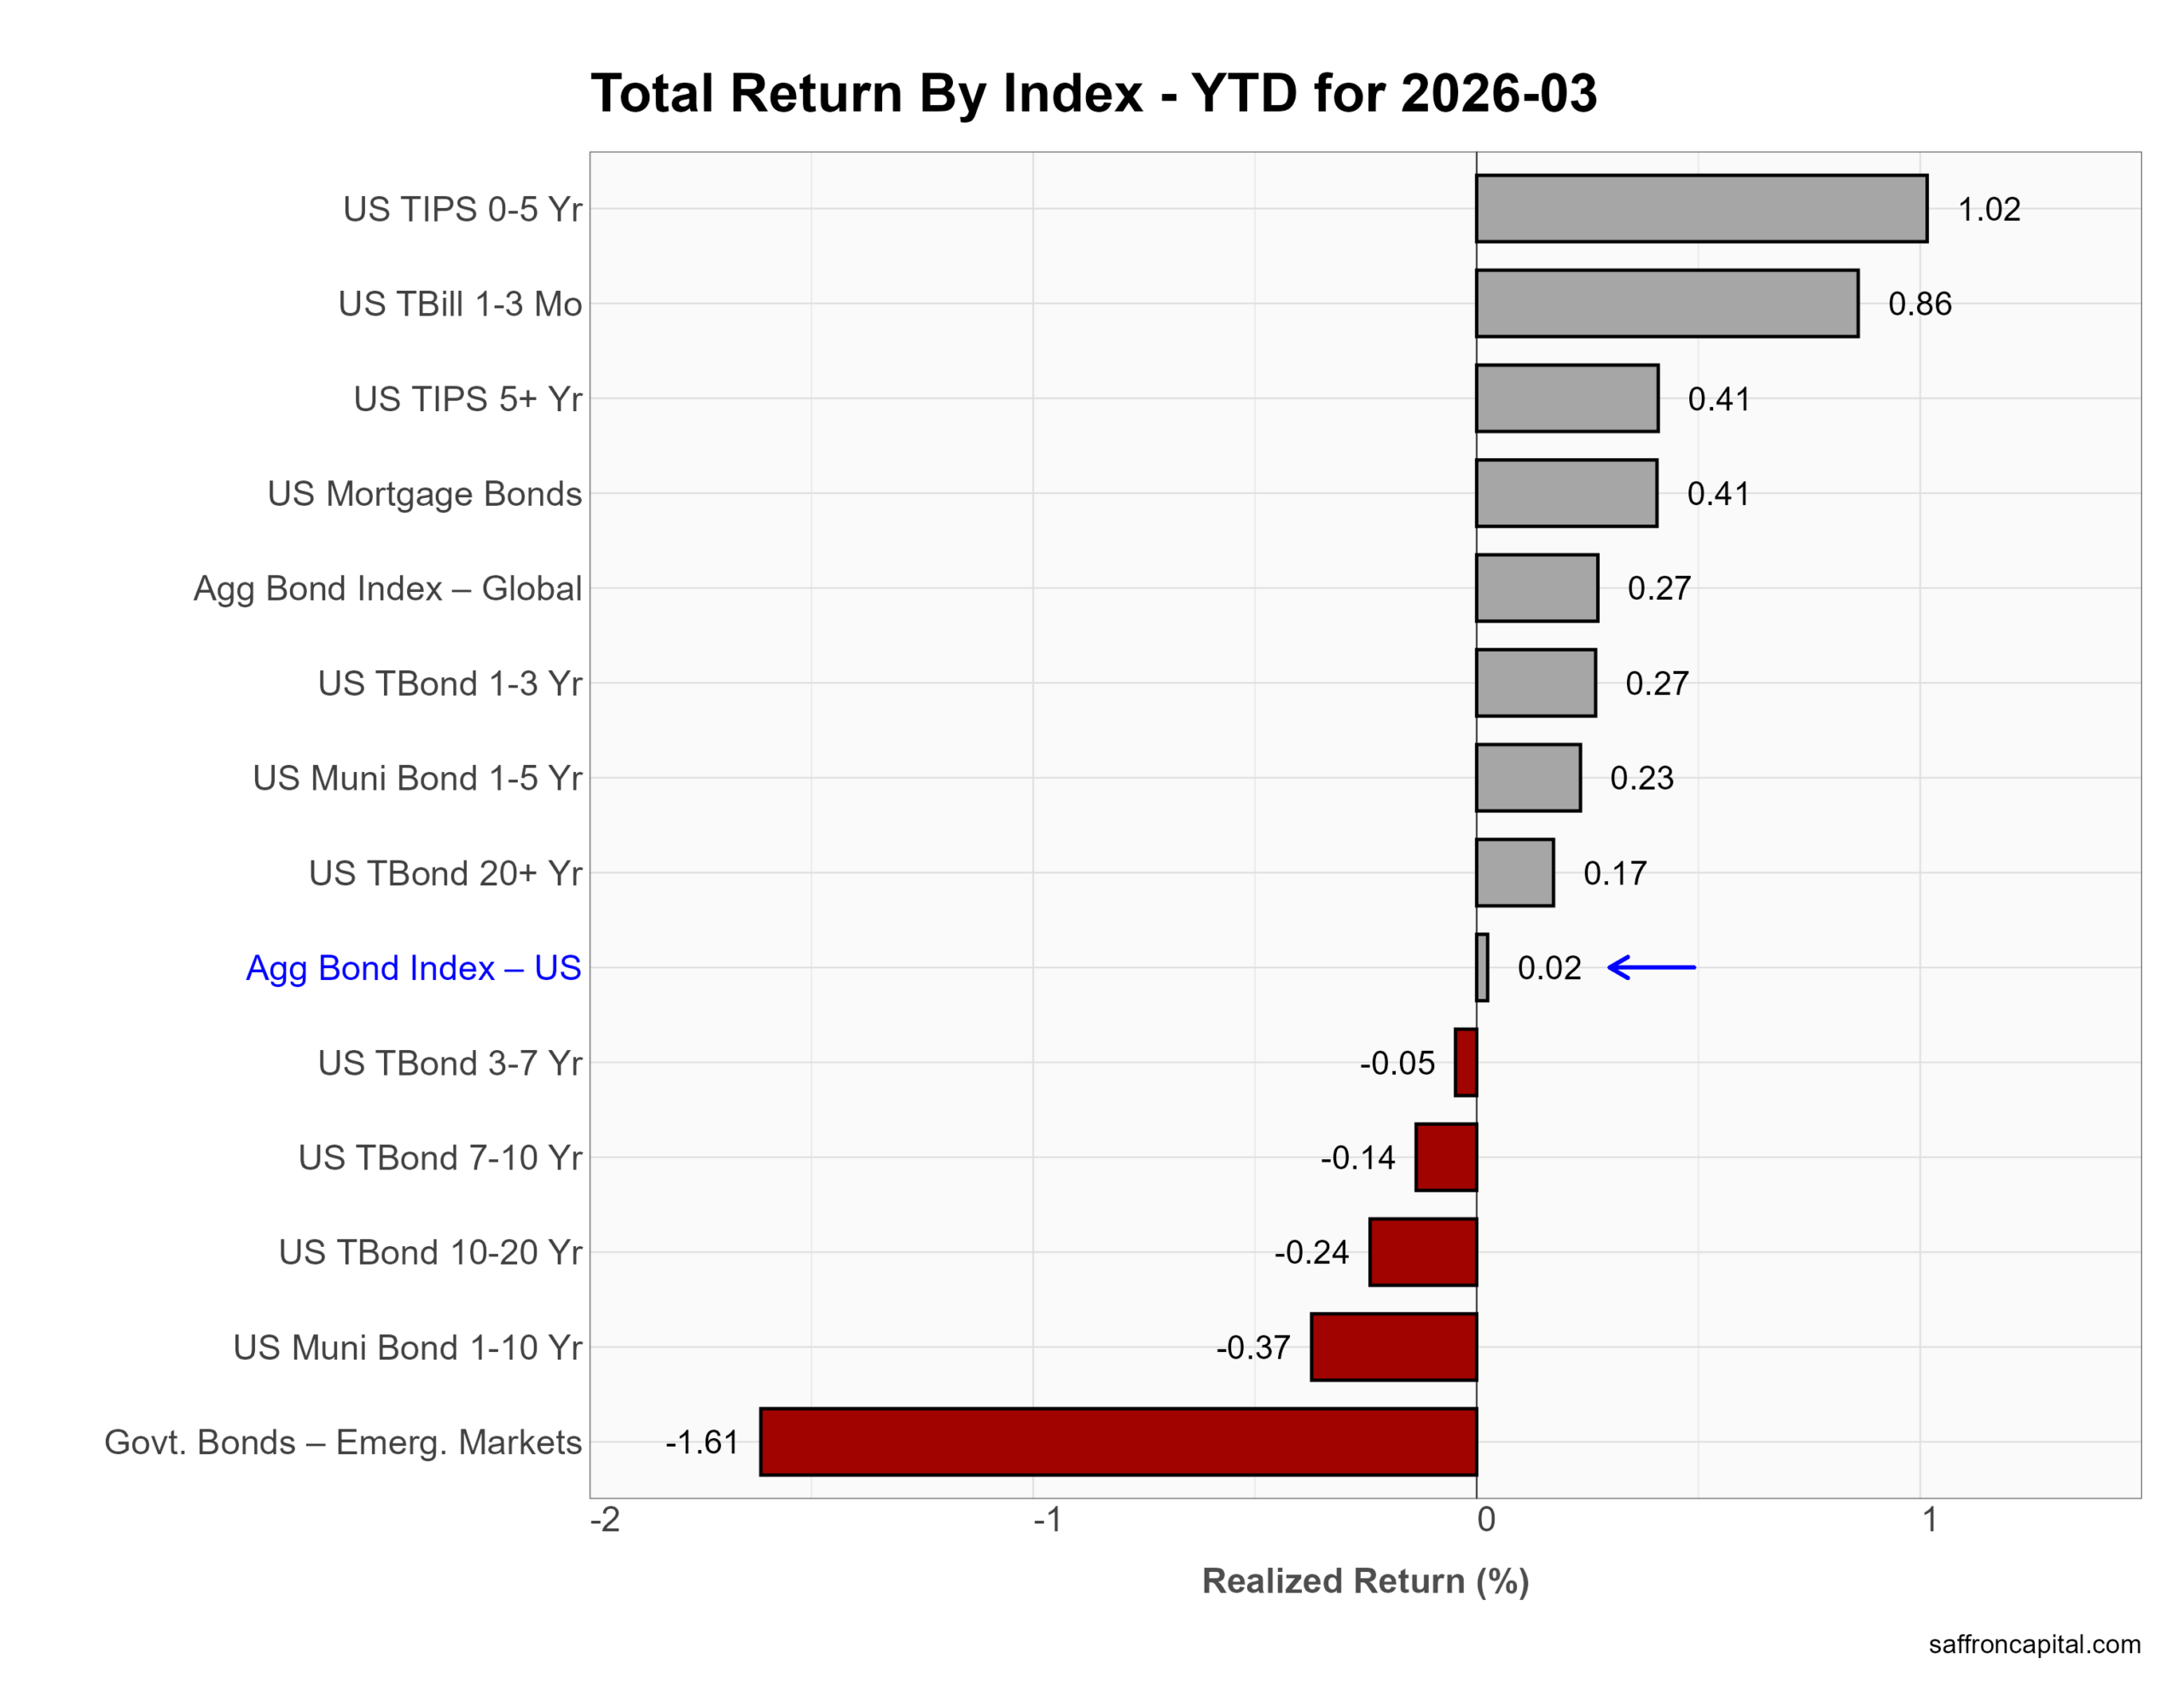
Year to date, returns are flat to modest despite March losses. 0–5 Year TIPS lead at +1.02%, followed by T-bills at +0.86%. Mortgage bonds and longer TIPS are up about +0.4%, while most Treasury maturities hover near zero or slightly negative. The US Aggregate Bond Index sits at +0.02%, reflecting limited carry offsetting price declines. In short, 2026 favors short duration and inflation protection over long-duration exposure.
Click to enlarge
Corporate & Infrastructure Bonds
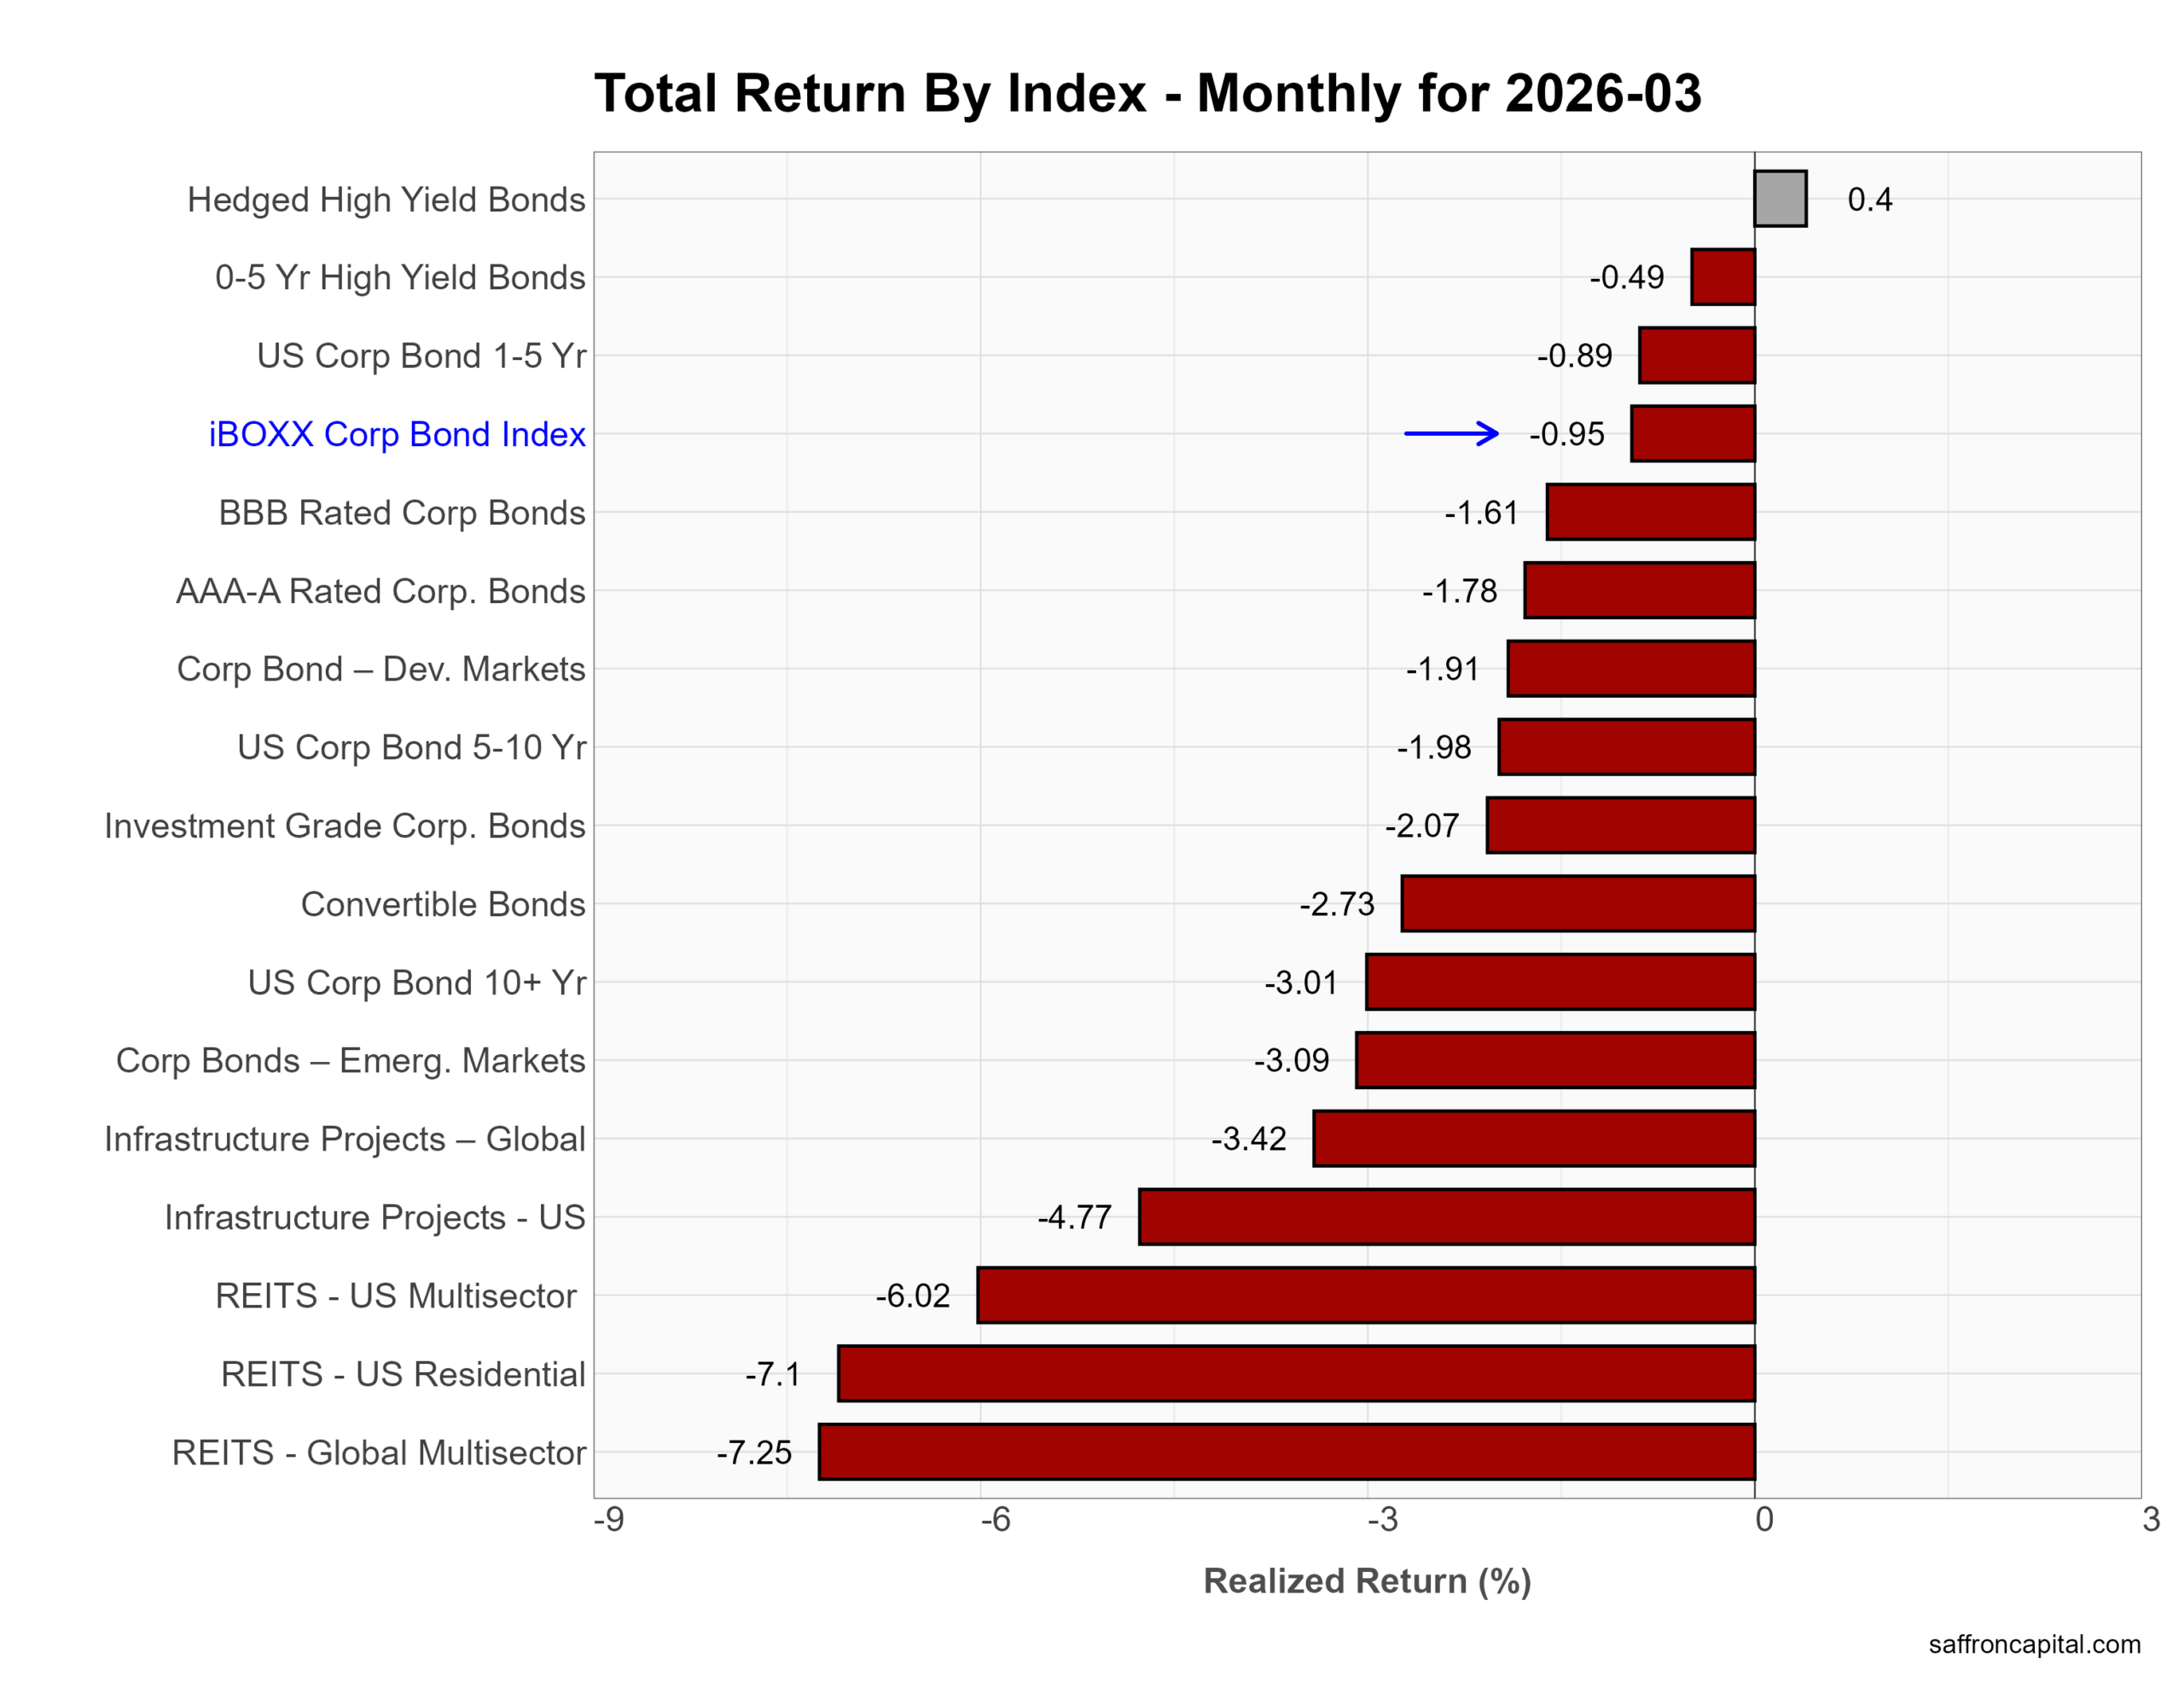
March hit rate-sensitive income assets as yields moved higher. First, REITs led the downside. Global REITs fell -7.25%, and US Residential REITs dropped -7.1%, while US Multisector REITs declined -6.02%. Infrastructure also pulled back, with US projects down -4.77% and global projects off -3.42%. Core credit held up better but still lost ground. The iBOXX Corporate Bond Index fell -0.95%, with investment grade at -2.07% and 10+ year corporates down -3.01%. In contrast, hedged high yield gained +0.4%, showing resilience in shorter-duration, spread-driven credit. Overall, rising rates pressured duration-heavy income sectors despite stable credit spreads.
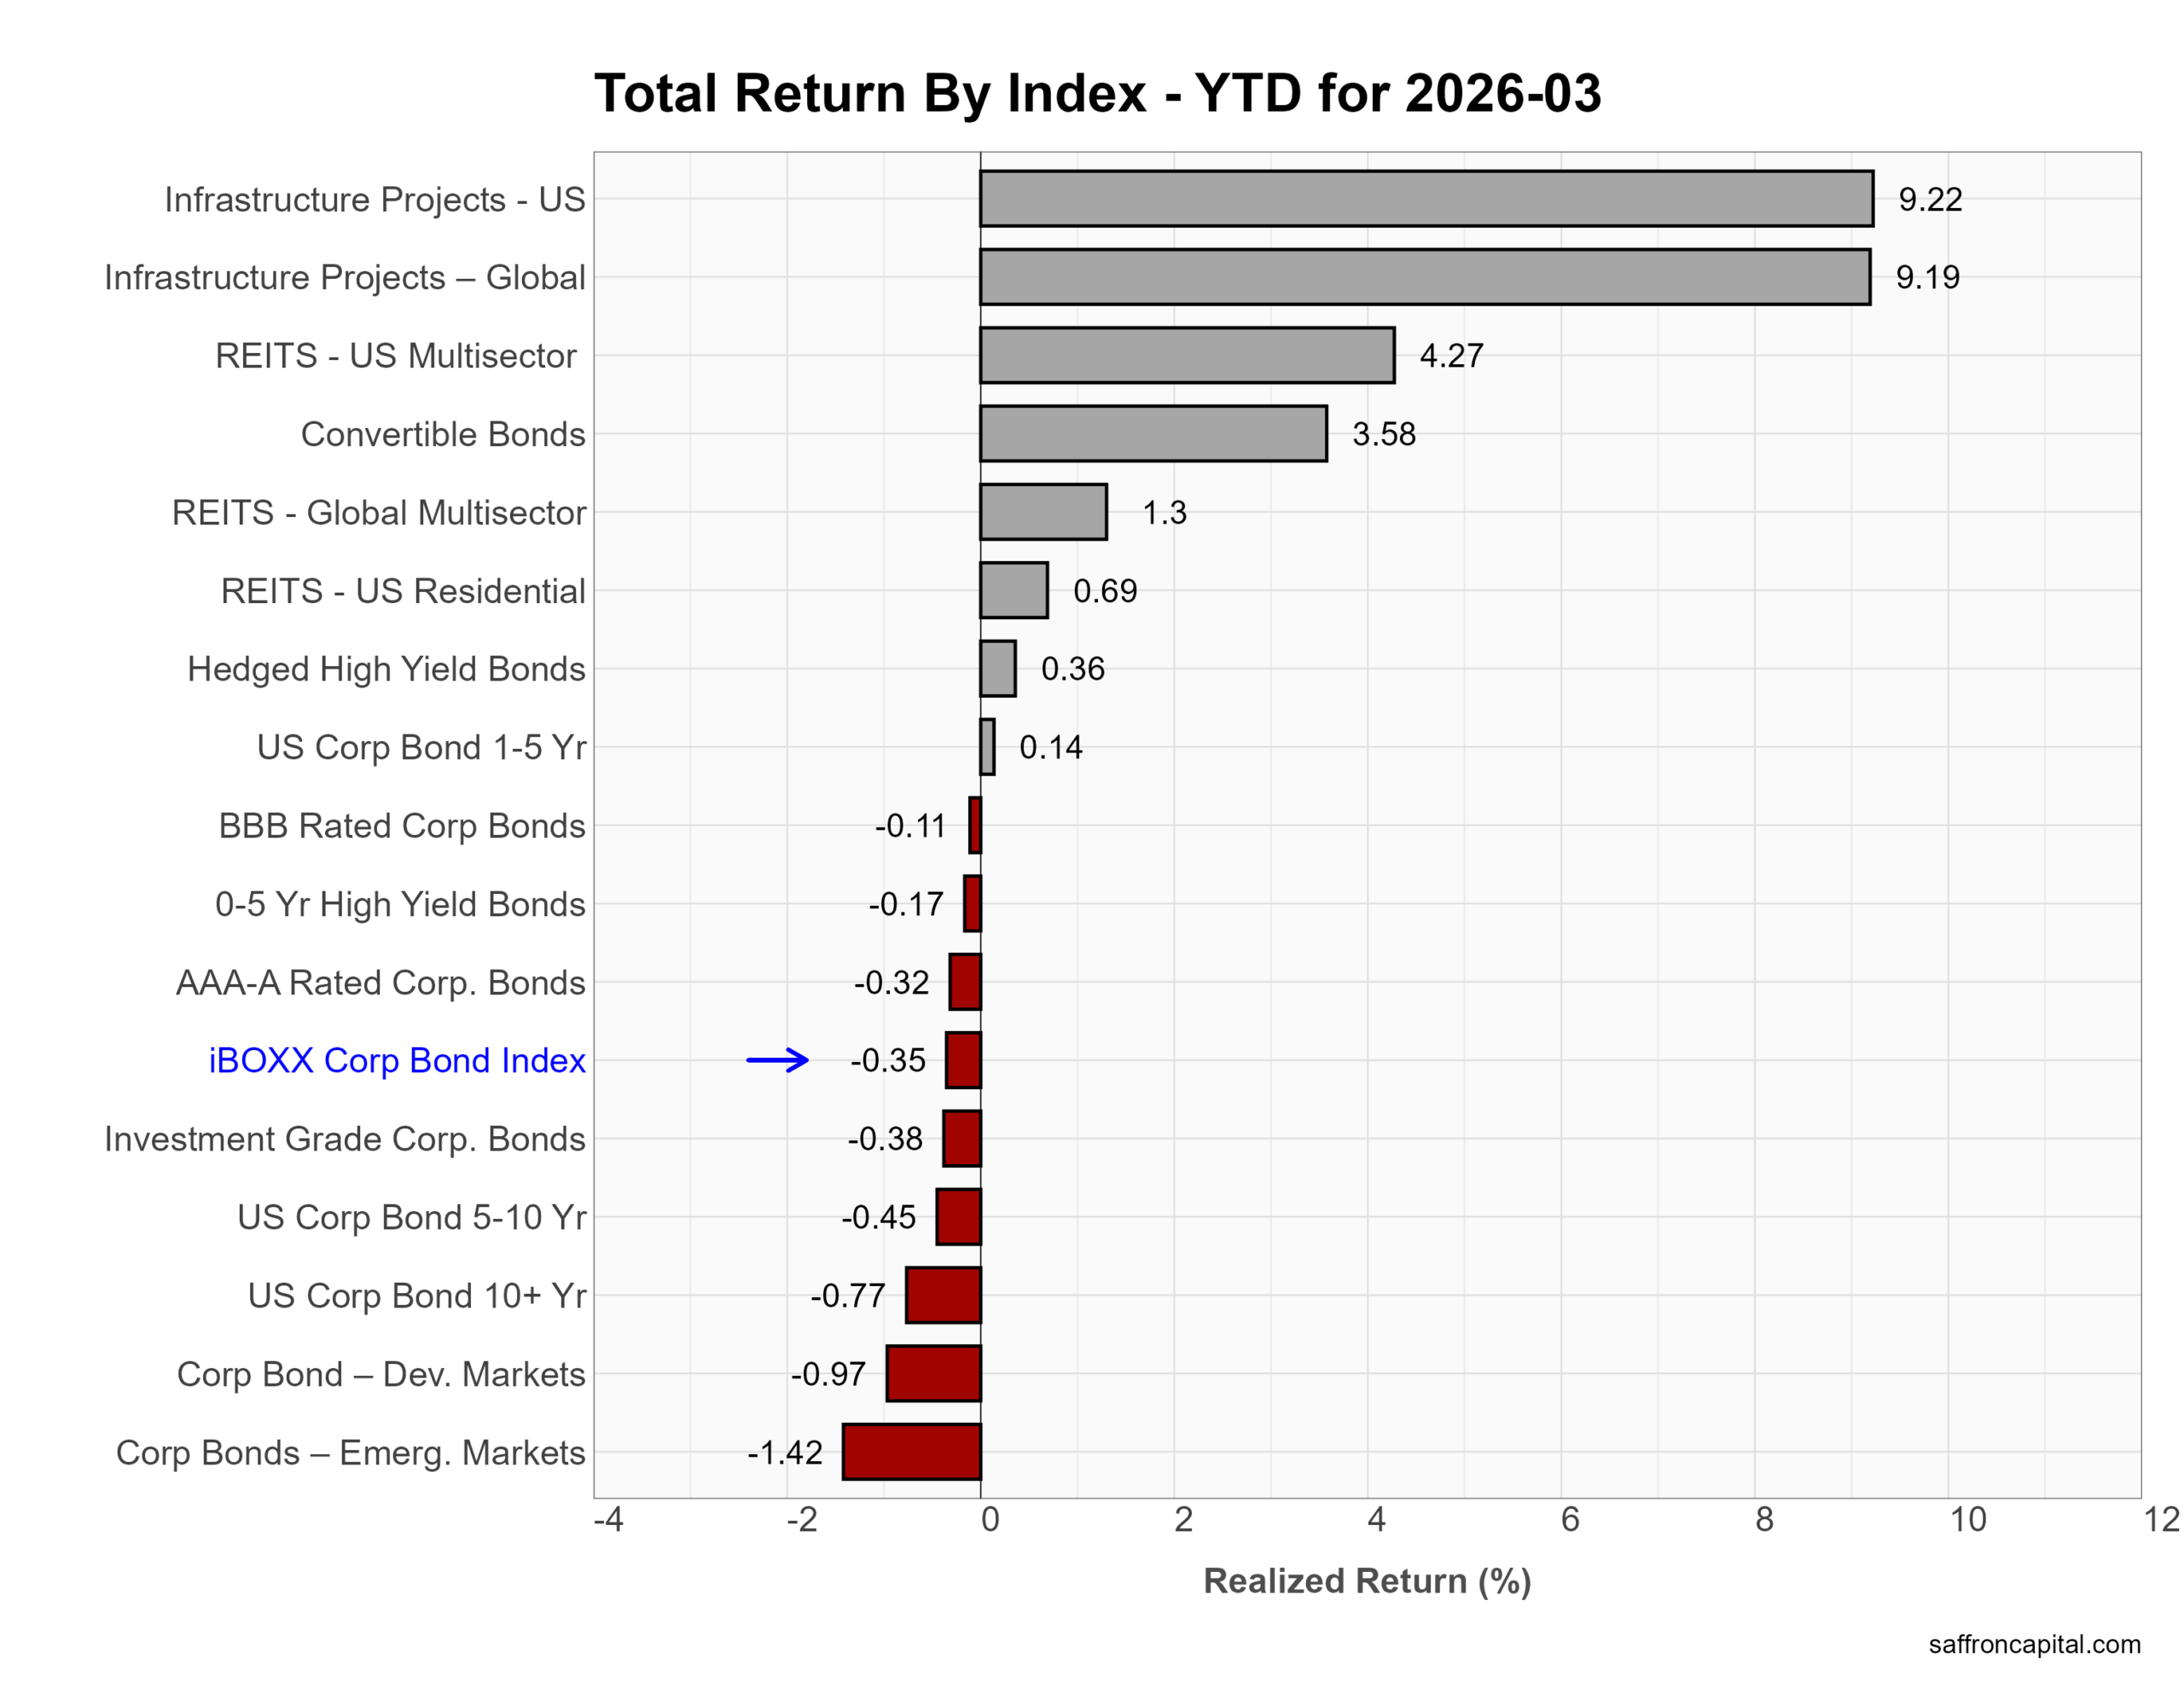
Year to date, leadership still sits with real assets. US infrastructure is up 9.22%, and global infrastructure +9.19%. US Multisector REITs gained 4.27%, while convertible bonds rose 3.58%. Core credit remains slightly negative, with the iBOXX Corporate Bond Index at -0.35% and most investment-grade segments below zero. High yield is roughly flat. In short, 2026 continues to favor asset-backed income and equity-linked credit over traditional duration-heavy corporates.
Click to enlarge
Commodities
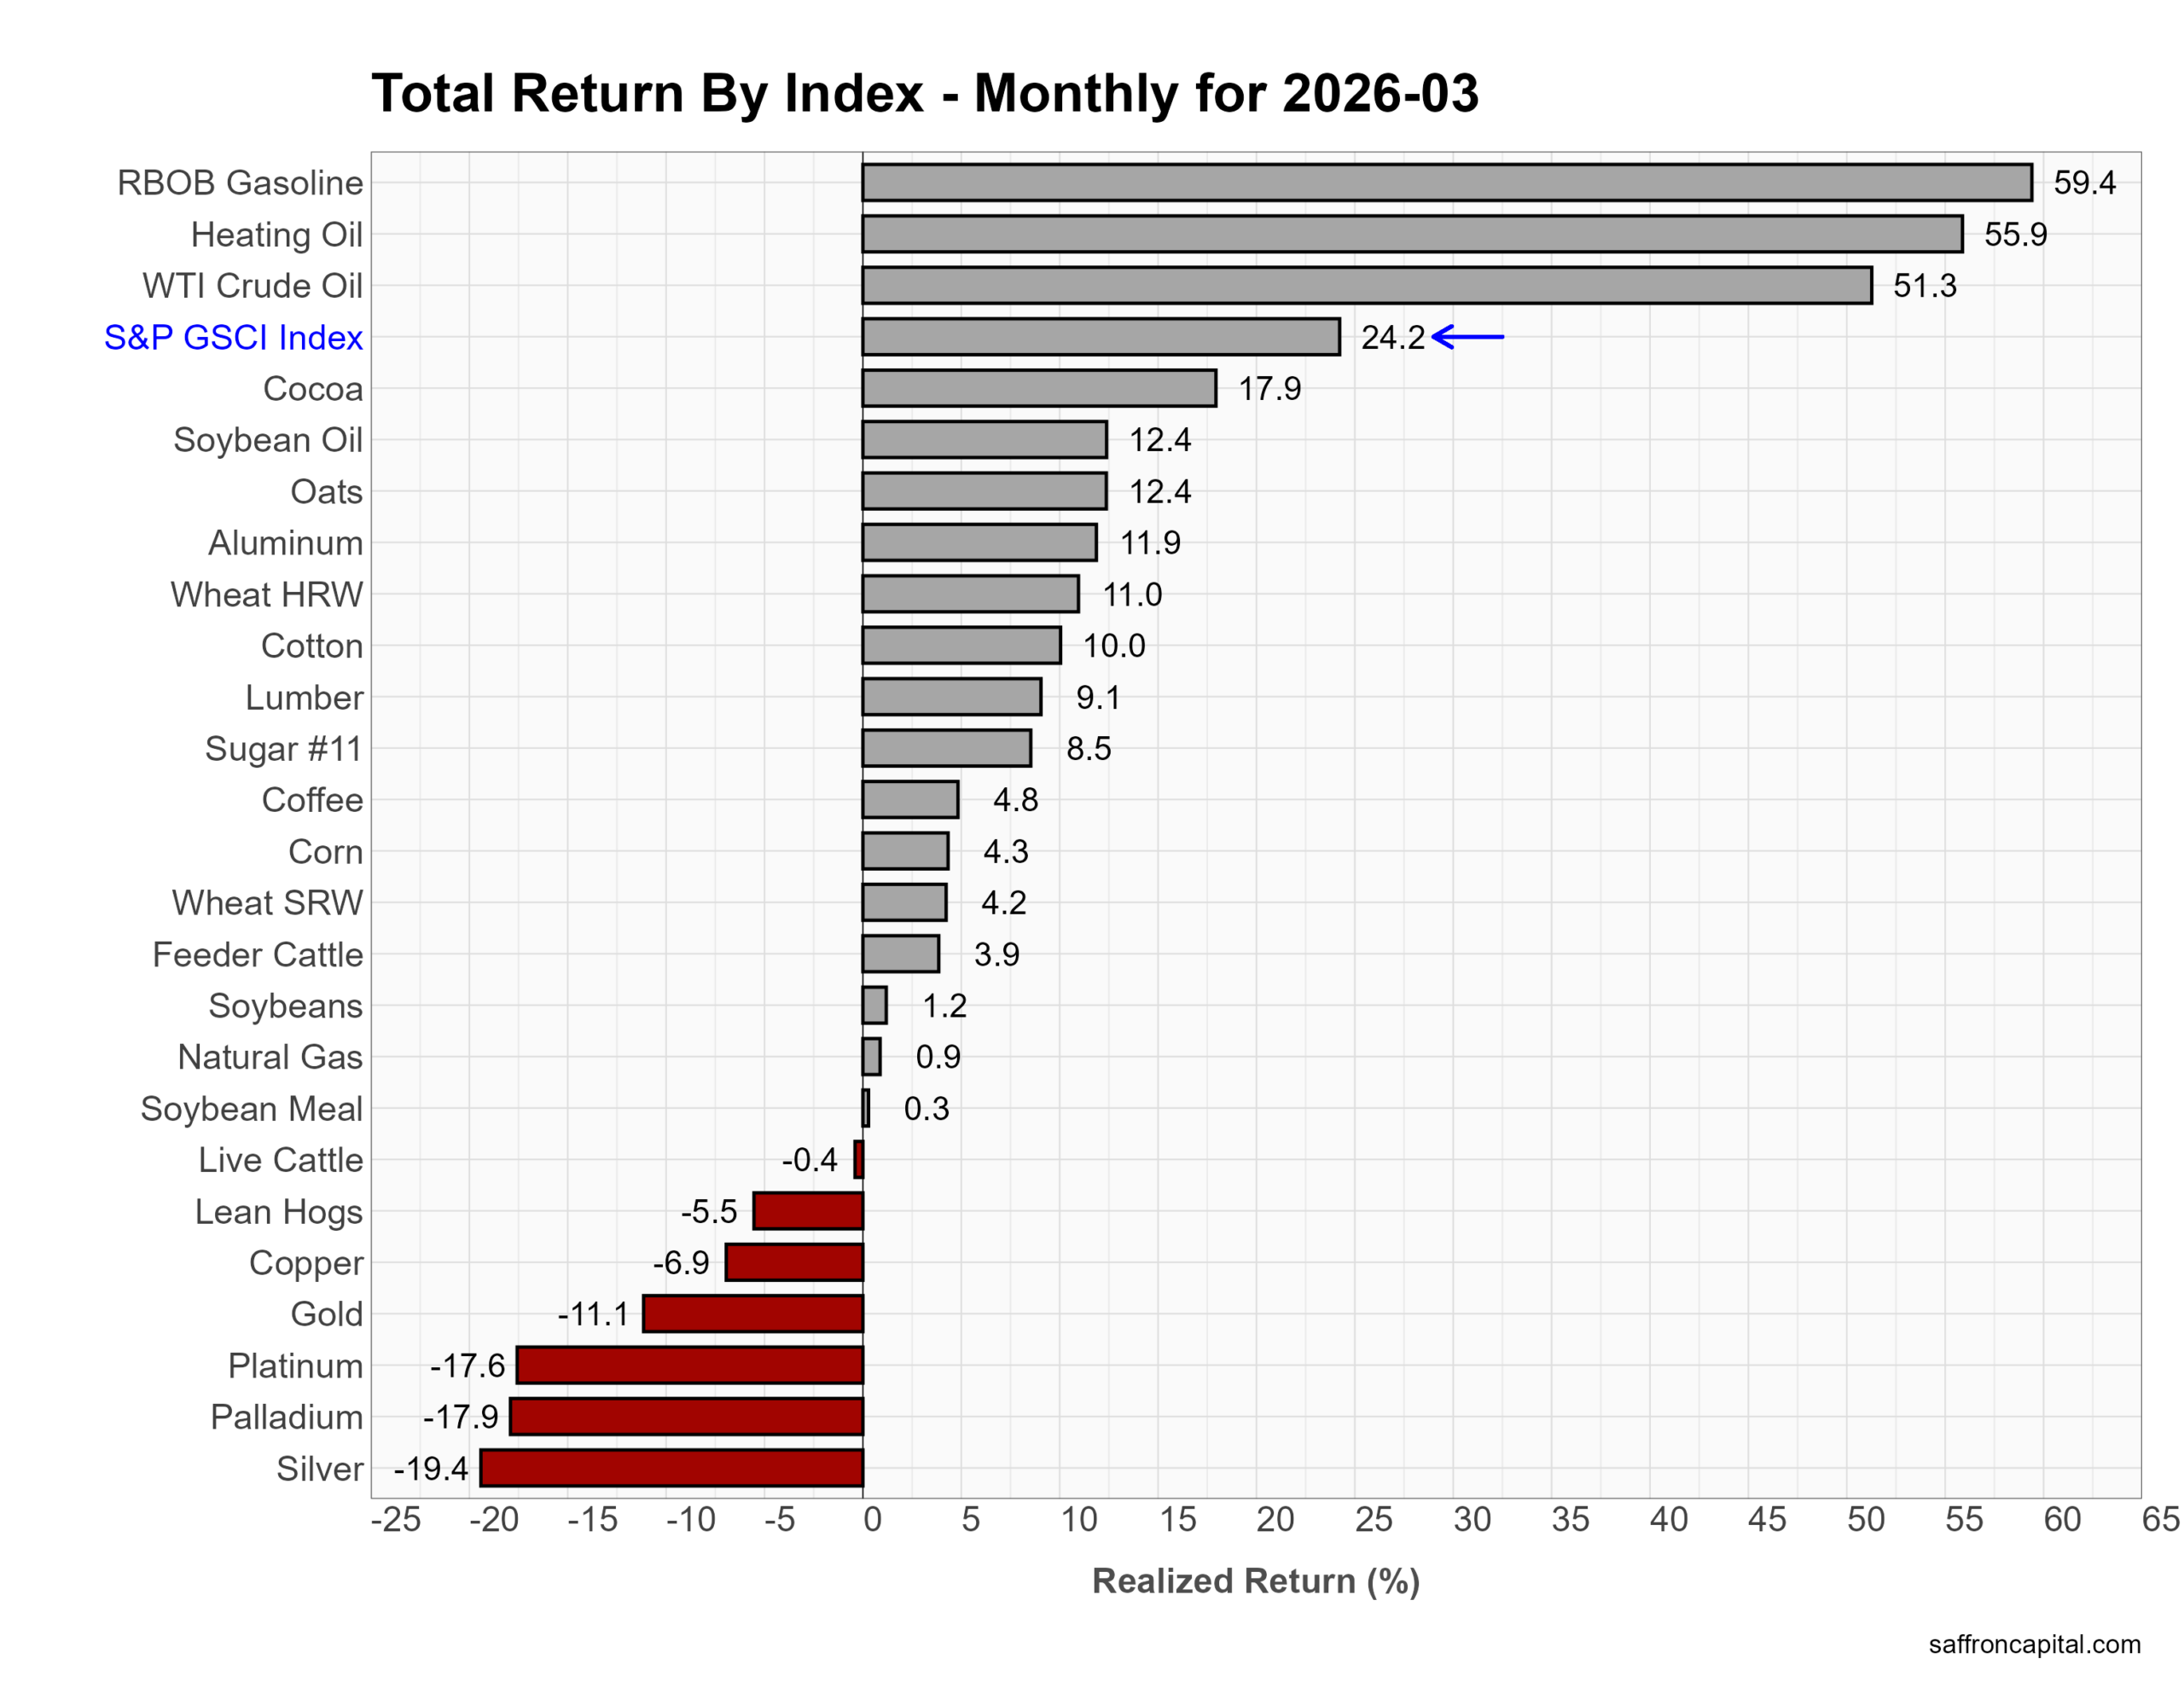
March was dominated by energy. The S&P GSCI surged 24.2%. RBOB gasoline jumped 59.4%, heating oil 55.9%, and WTI crude 51.3%. Agriculture was broadly higher, led by cocoa (+17.9%) and grains/oils in the low double digits. In contrast, metals lagged. Gold fell 11.1%, copper dropped 6.9%, and silver plunged 19.4%. Overall, a sharp energy rally drove the complex.
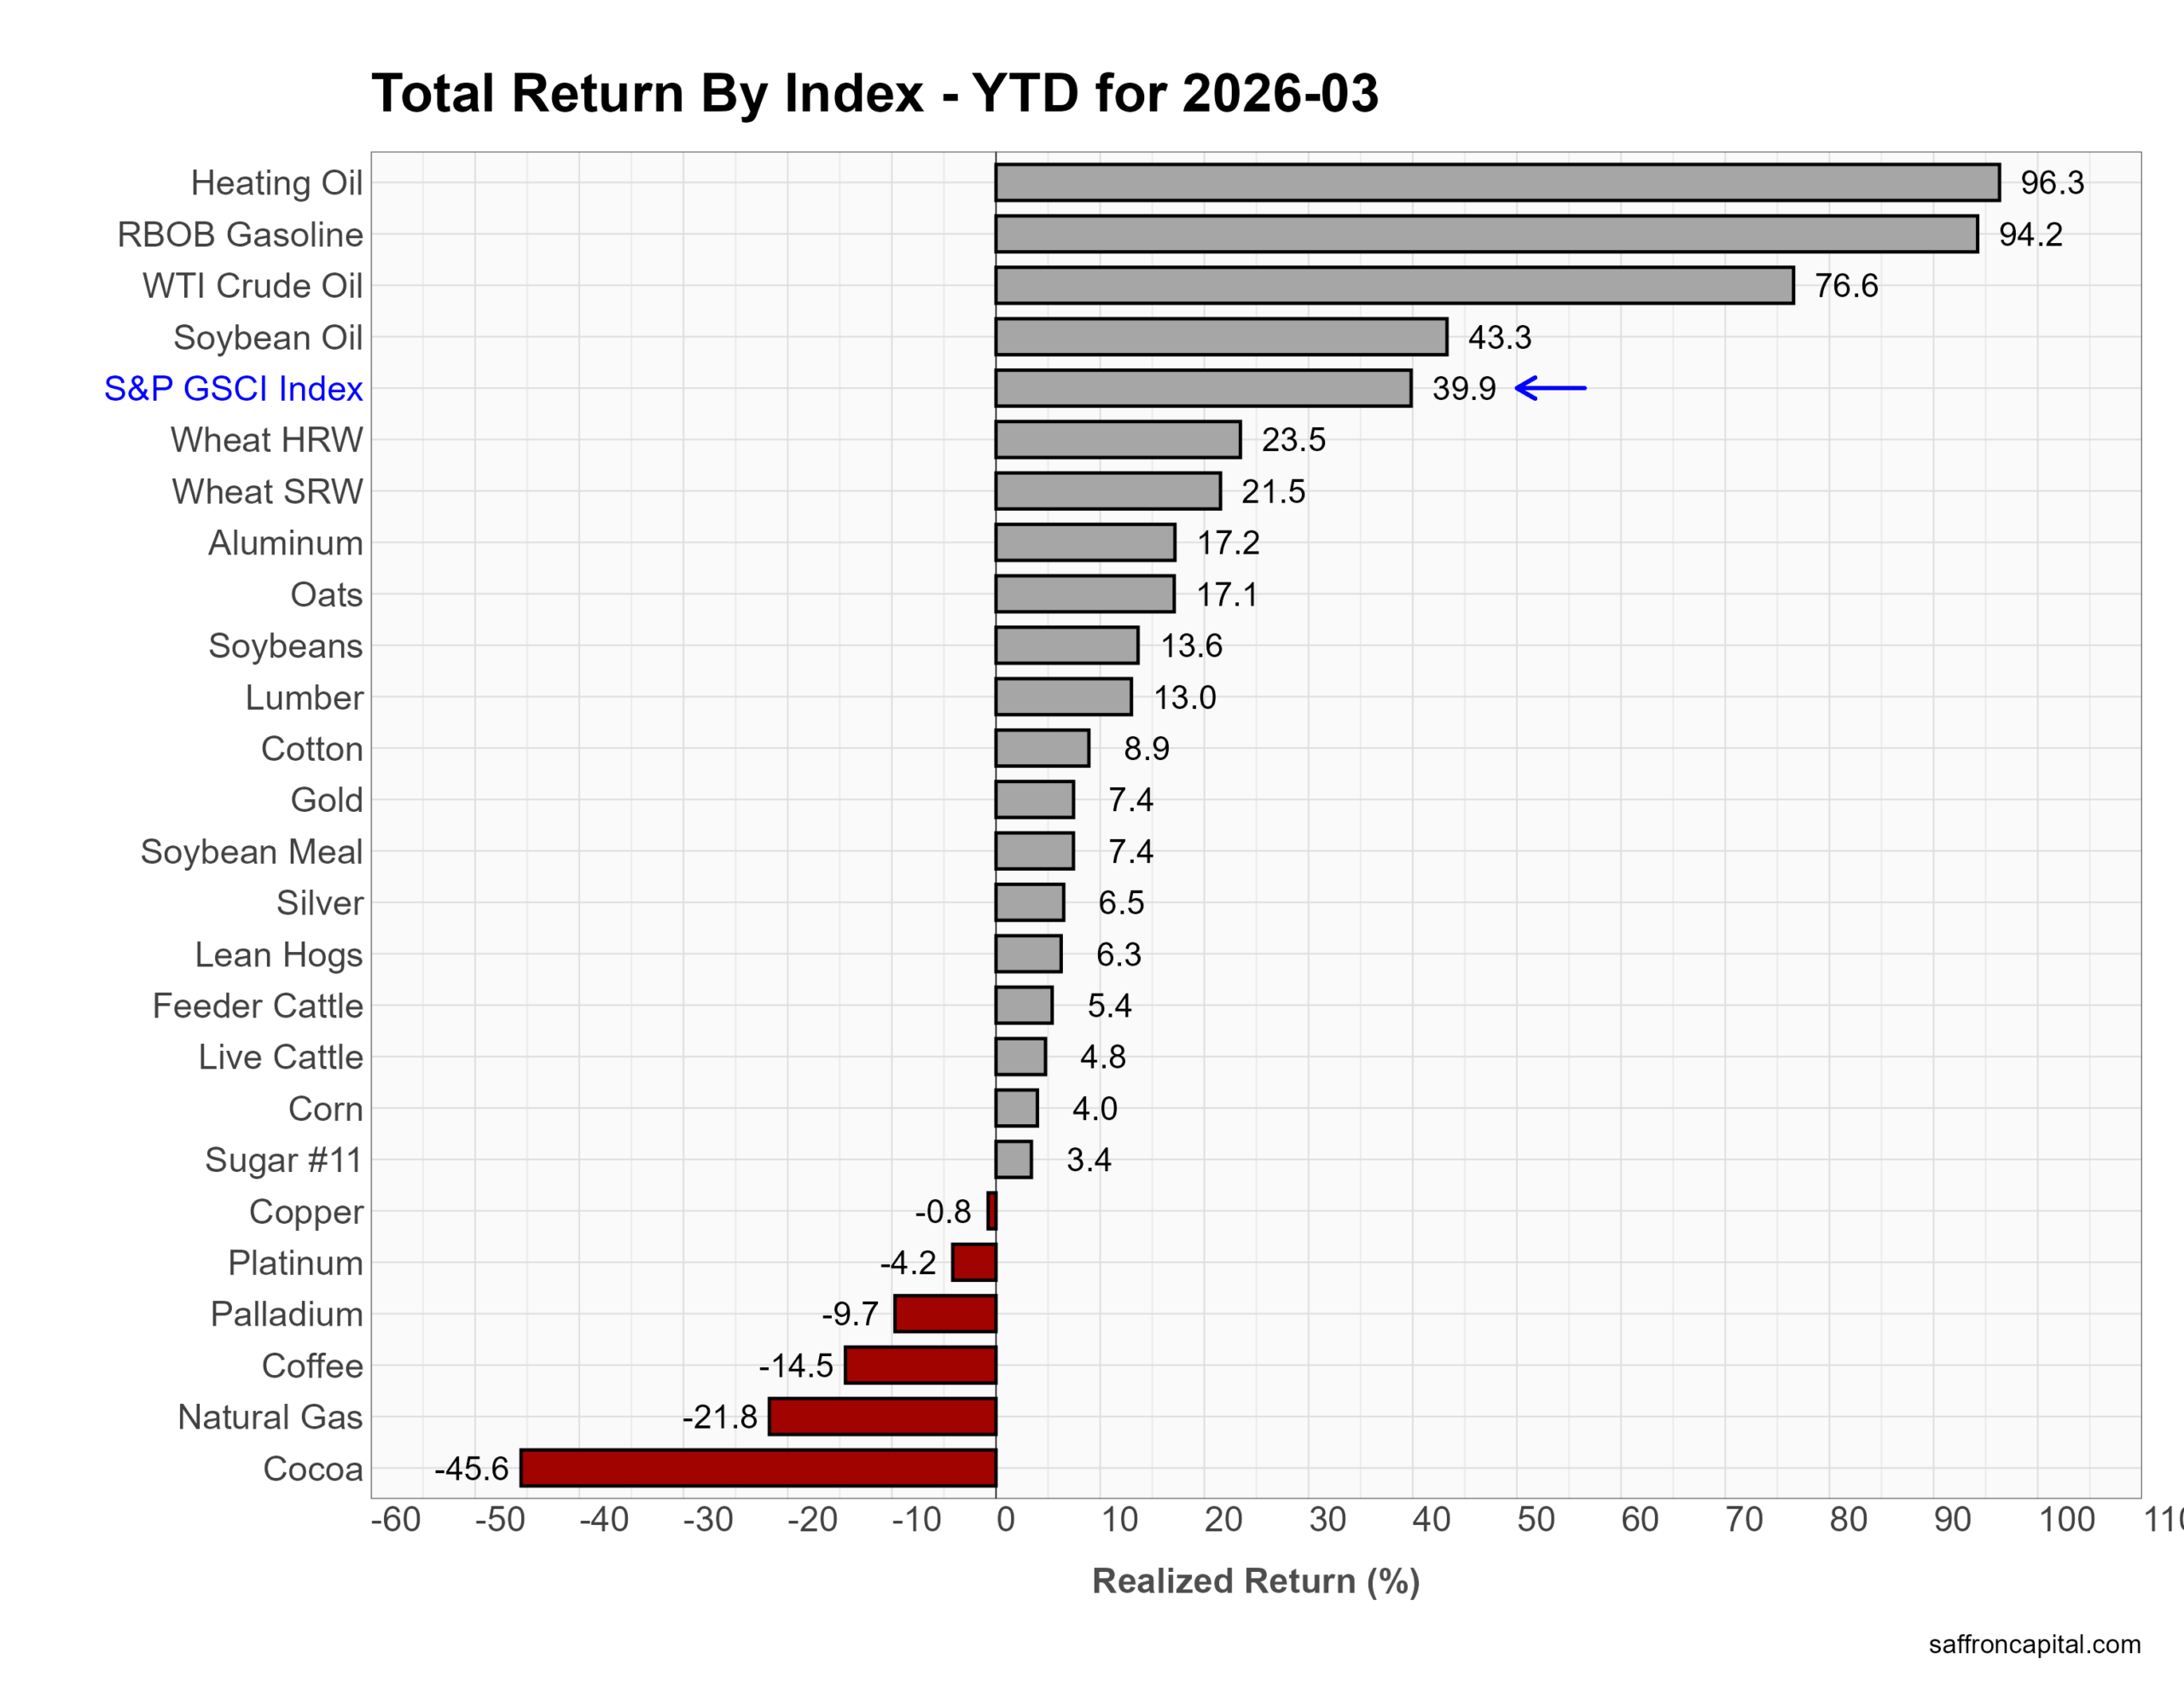
Year to date, the trend is even stronger. The S&P GSCI is up 39.9%. Heating oil (+96.3%), gasoline (+94.2%), and crude (+76.6%) lead. Agriculture and industrial metals show solid gains. However, dispersion is extreme. Cocoa (-45.6%), natural gas (-21.8%), and coffee (-14.5%) lag, while precious metals are mixed. In short, 2026 is an energy-led commodity bull with wide cross-asset divergence.
Click to enlarge
Currencies
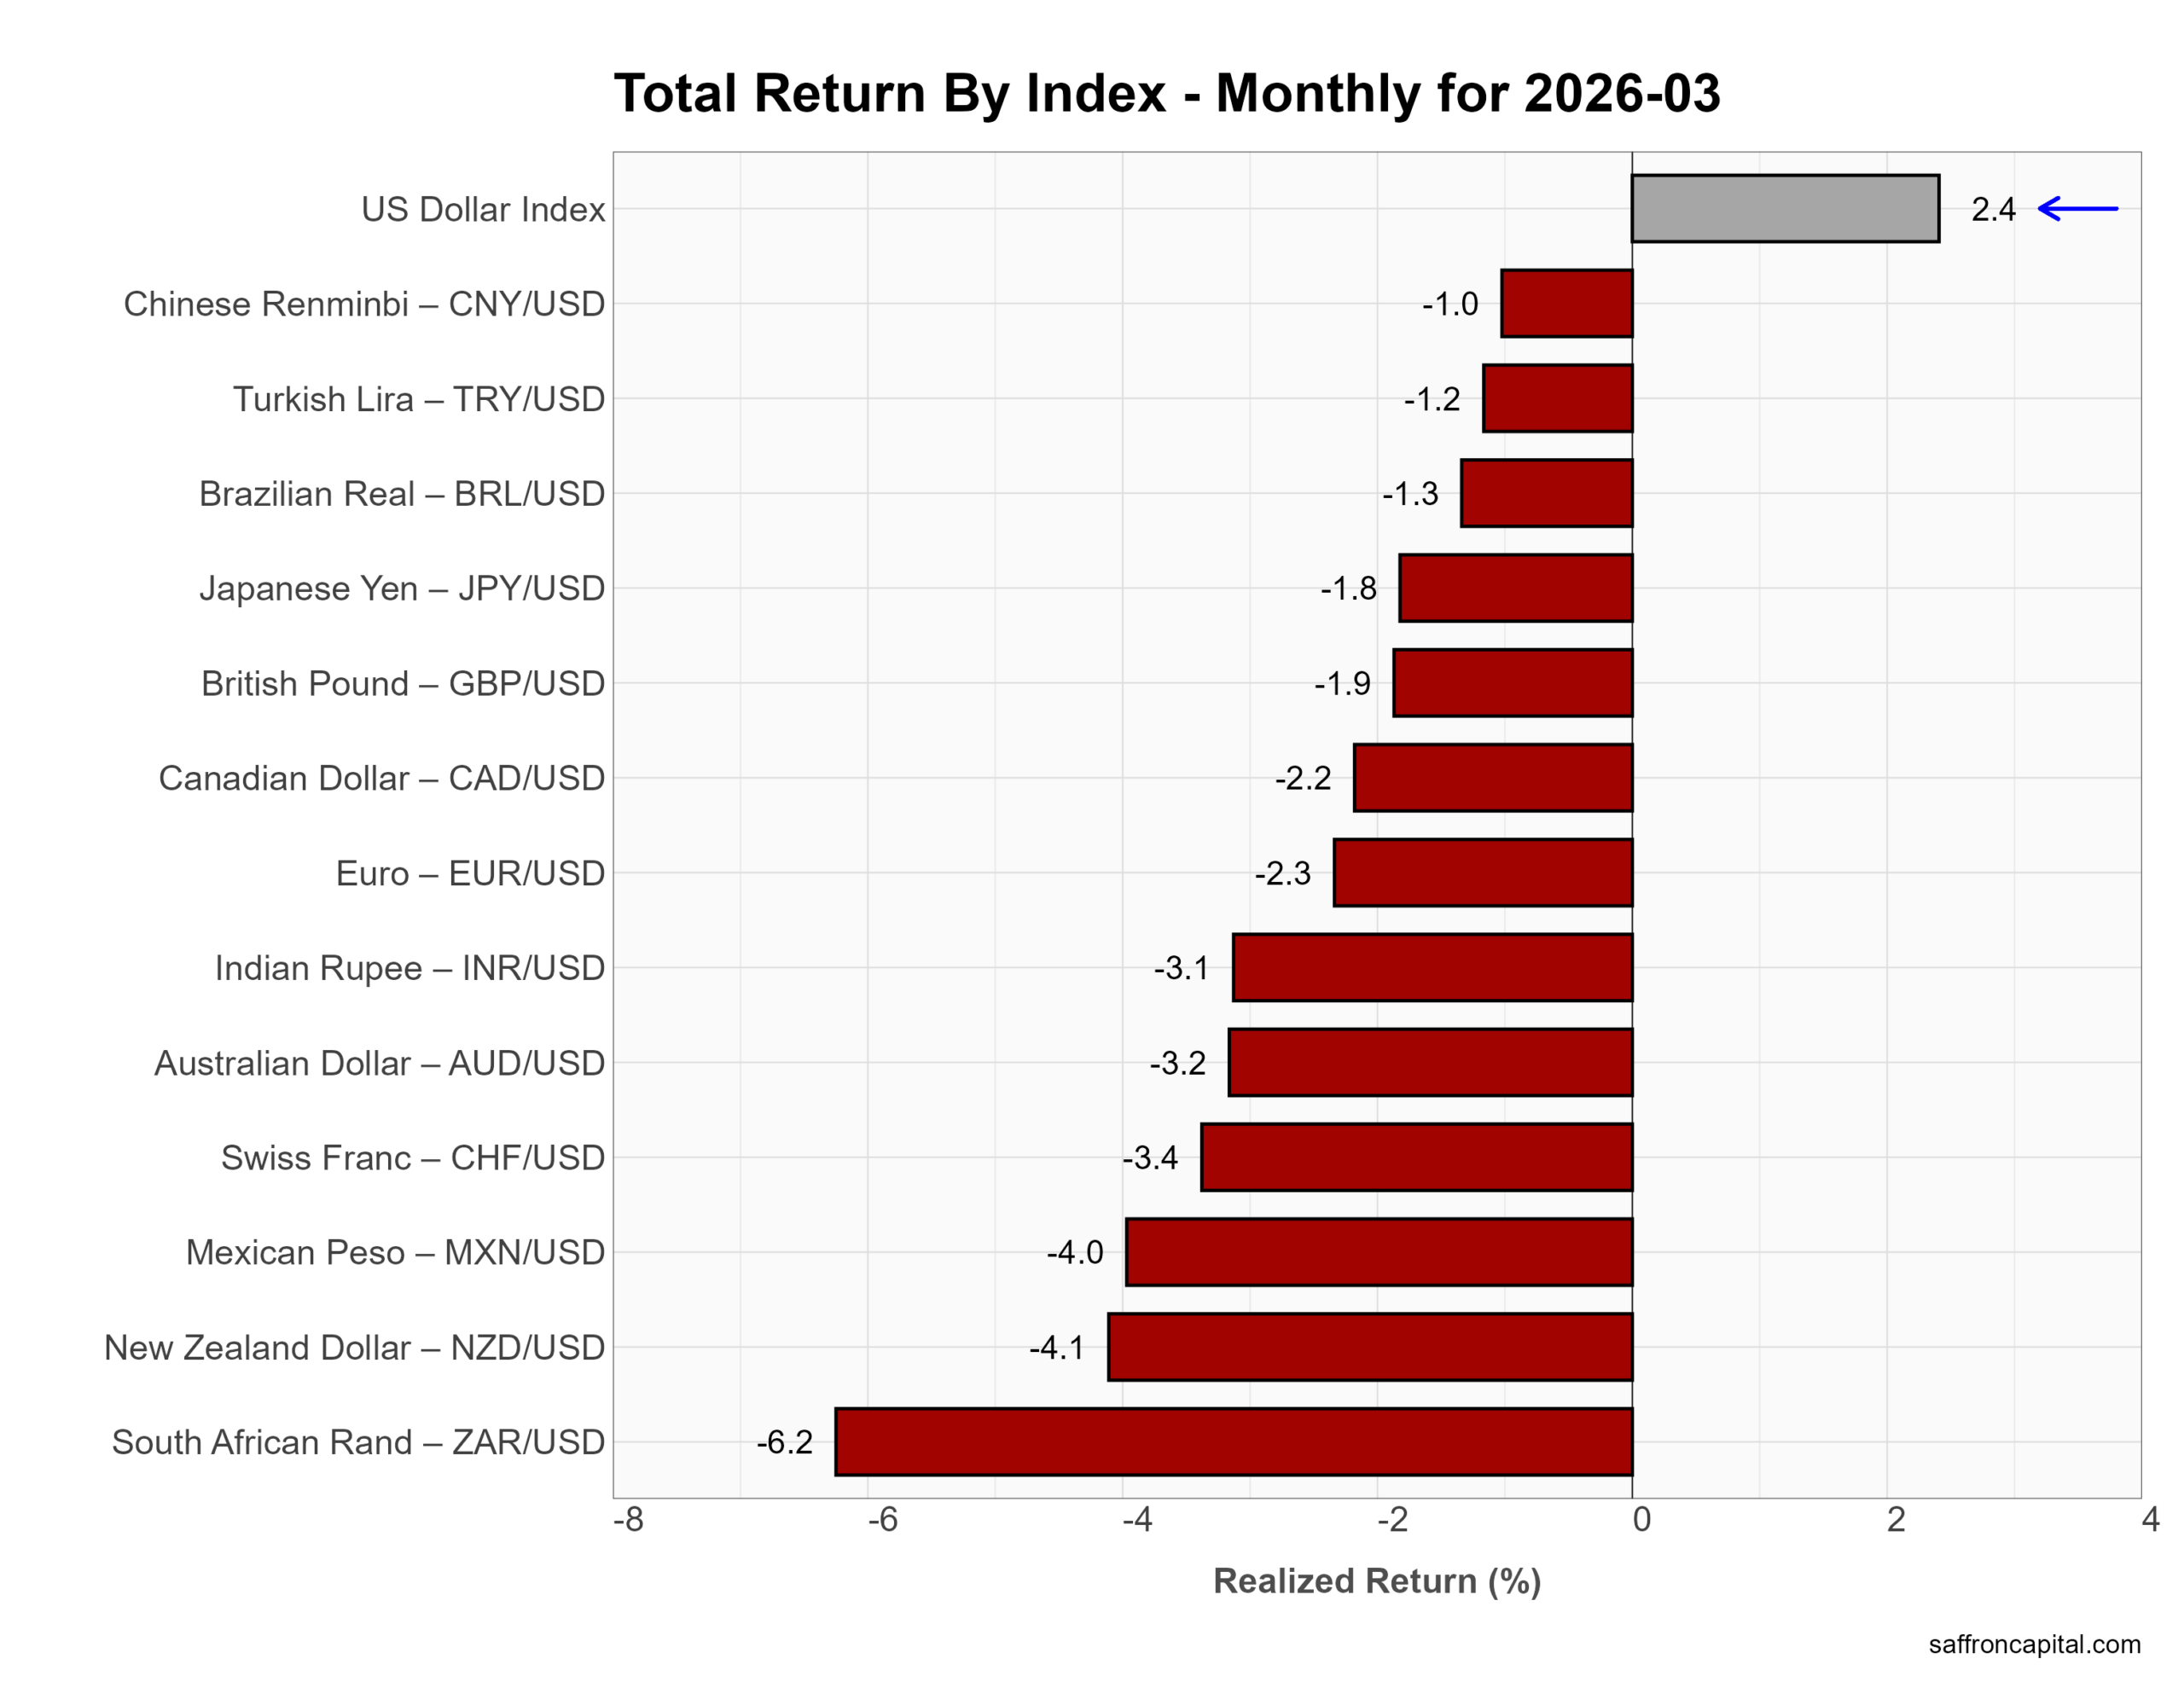
March saw broad dollar strength. The US Dollar Index rose 2.4%. Most currencies weakened, led by the South African rand (-6.2%), New Zealand dollar (-4.1%), and Mexican peso (-4.0%). The euro (-2.3%), pound (-1.9%), and yen (-1.8%) also declined. Overall, higher US yields and risk-off tone supported the dollar.
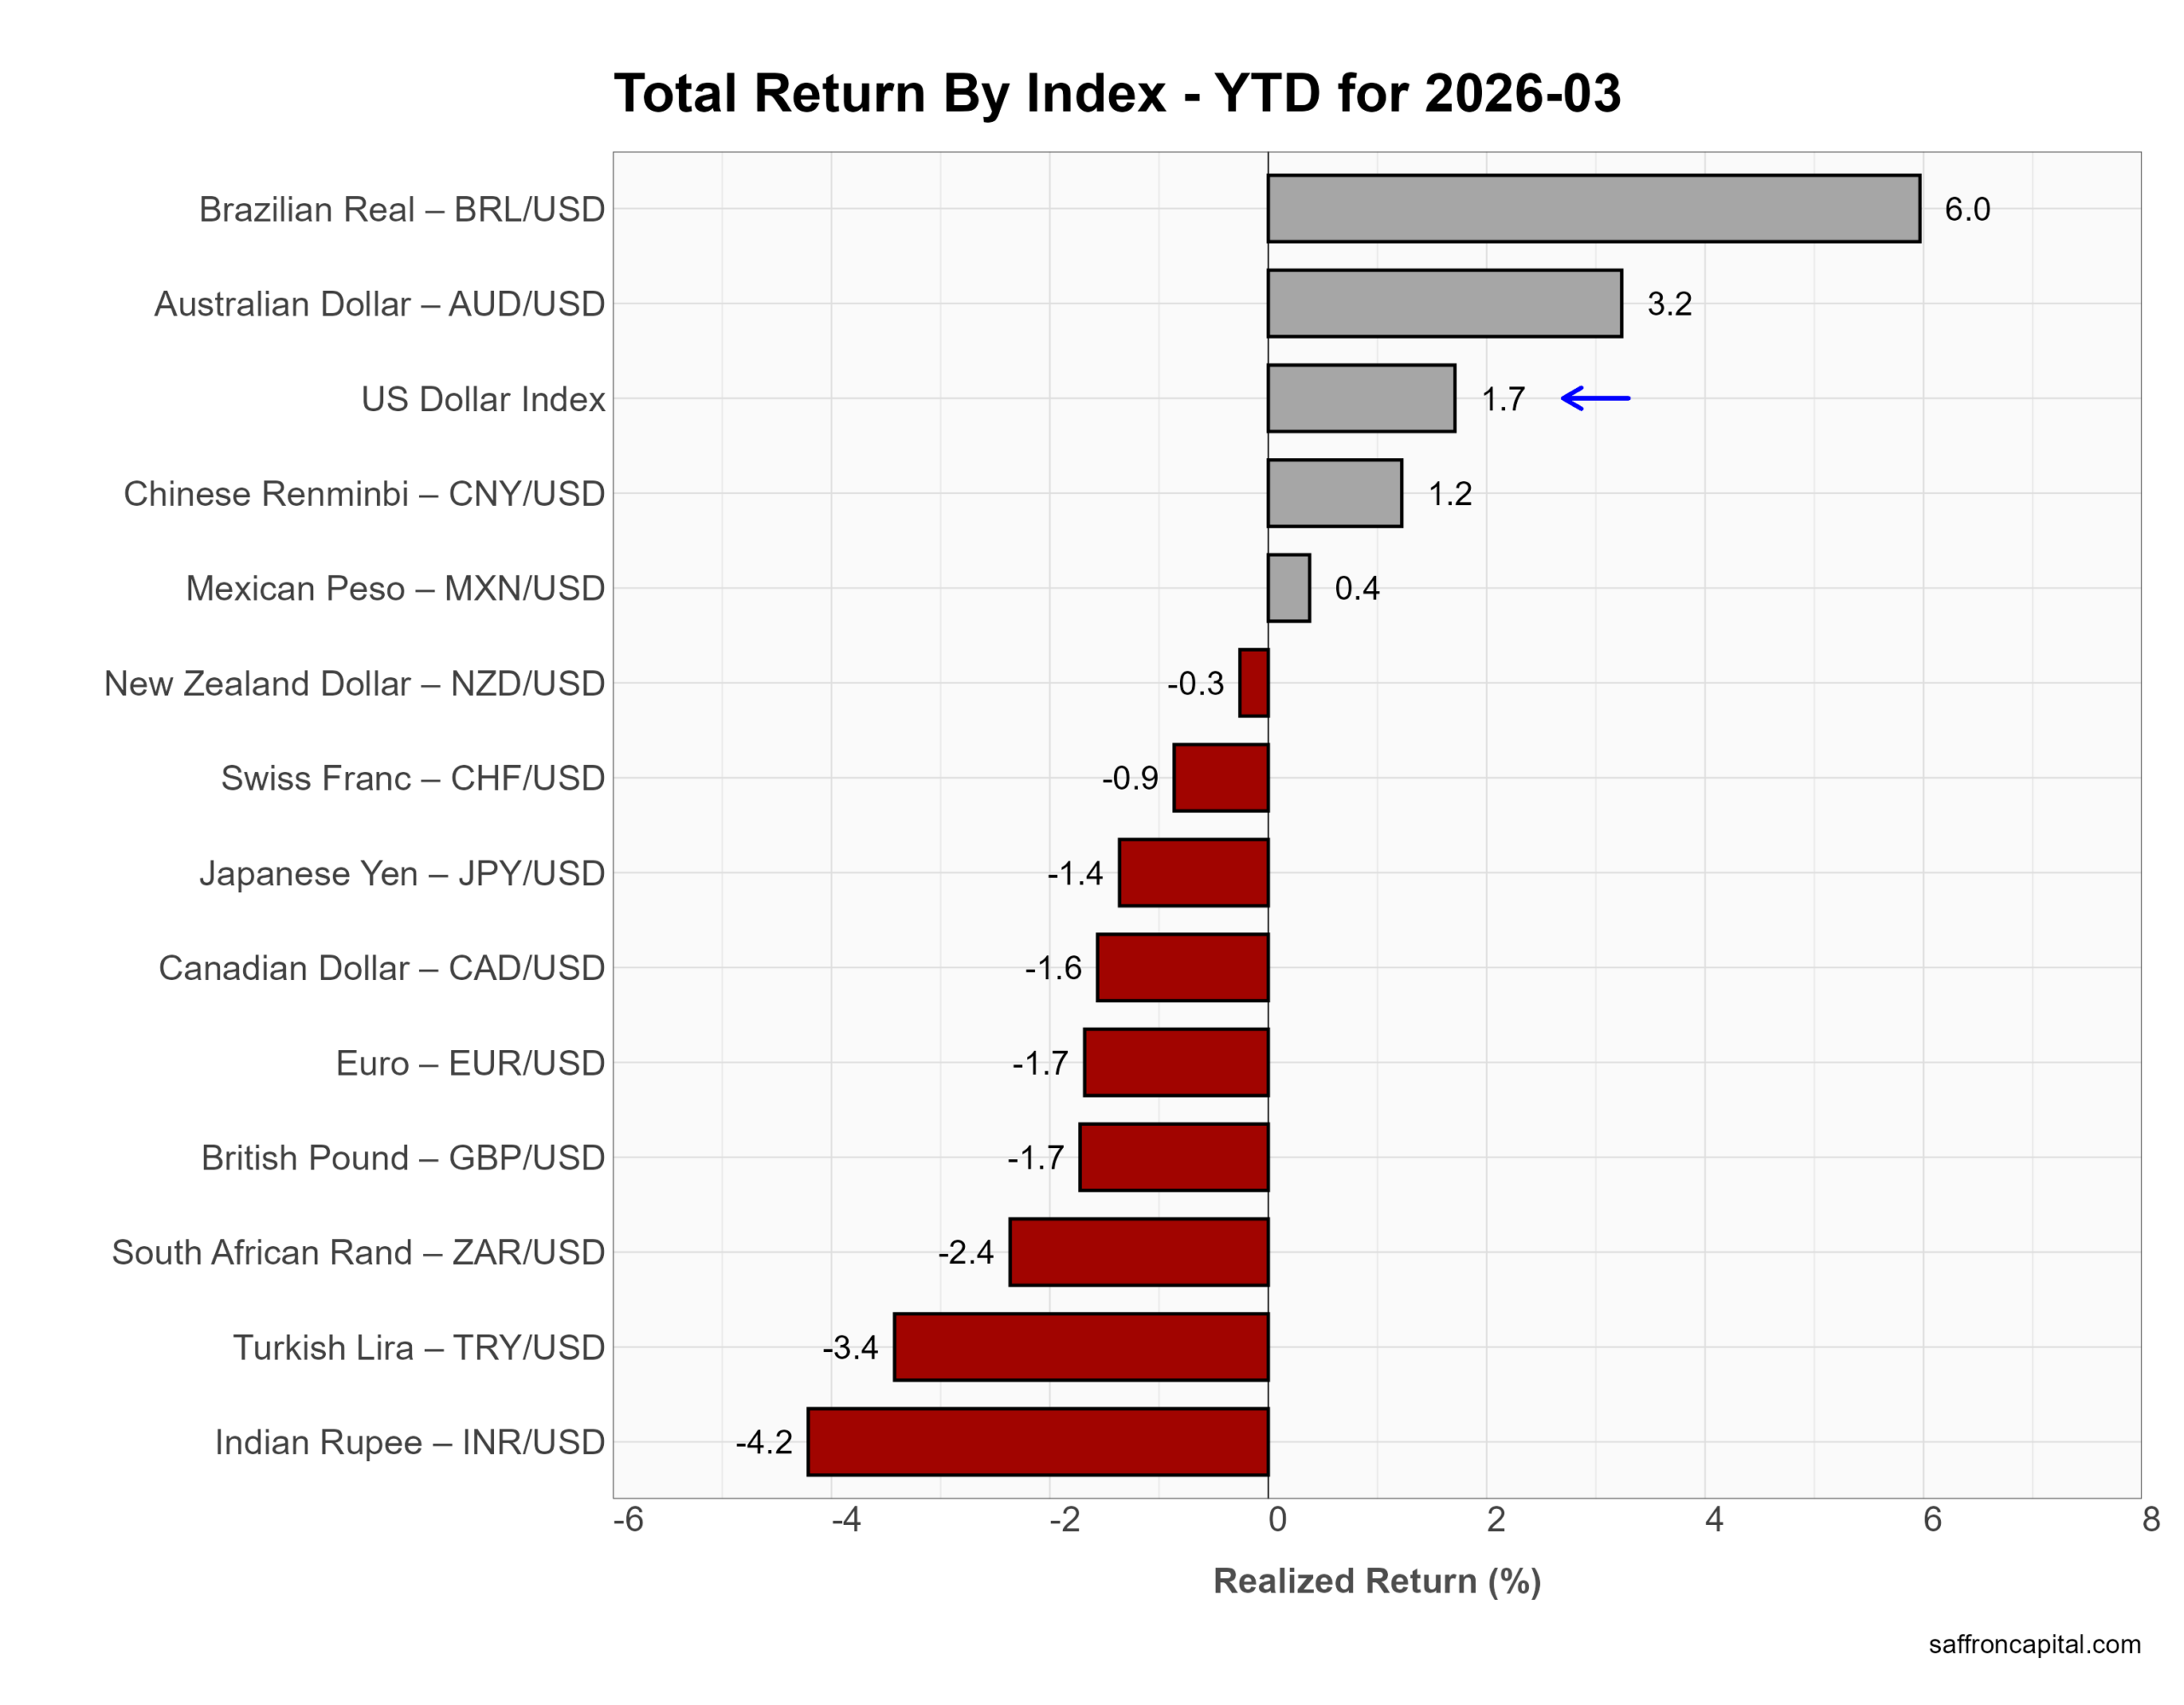
Year to date, the picture is mixed. The dollar is up 1.7%. The Brazilian real (+6.0%) and Australian dollar (+3.2%) lead, along with modest gains in the renminbi (+1.2%) and peso (+0.4%). In contrast, the rupee (-4.2%) and lira (-3.4%) lag. In short, 2026 FX is selective: dollar firm, but commodity currencies outperform.
Cryptocurrencies
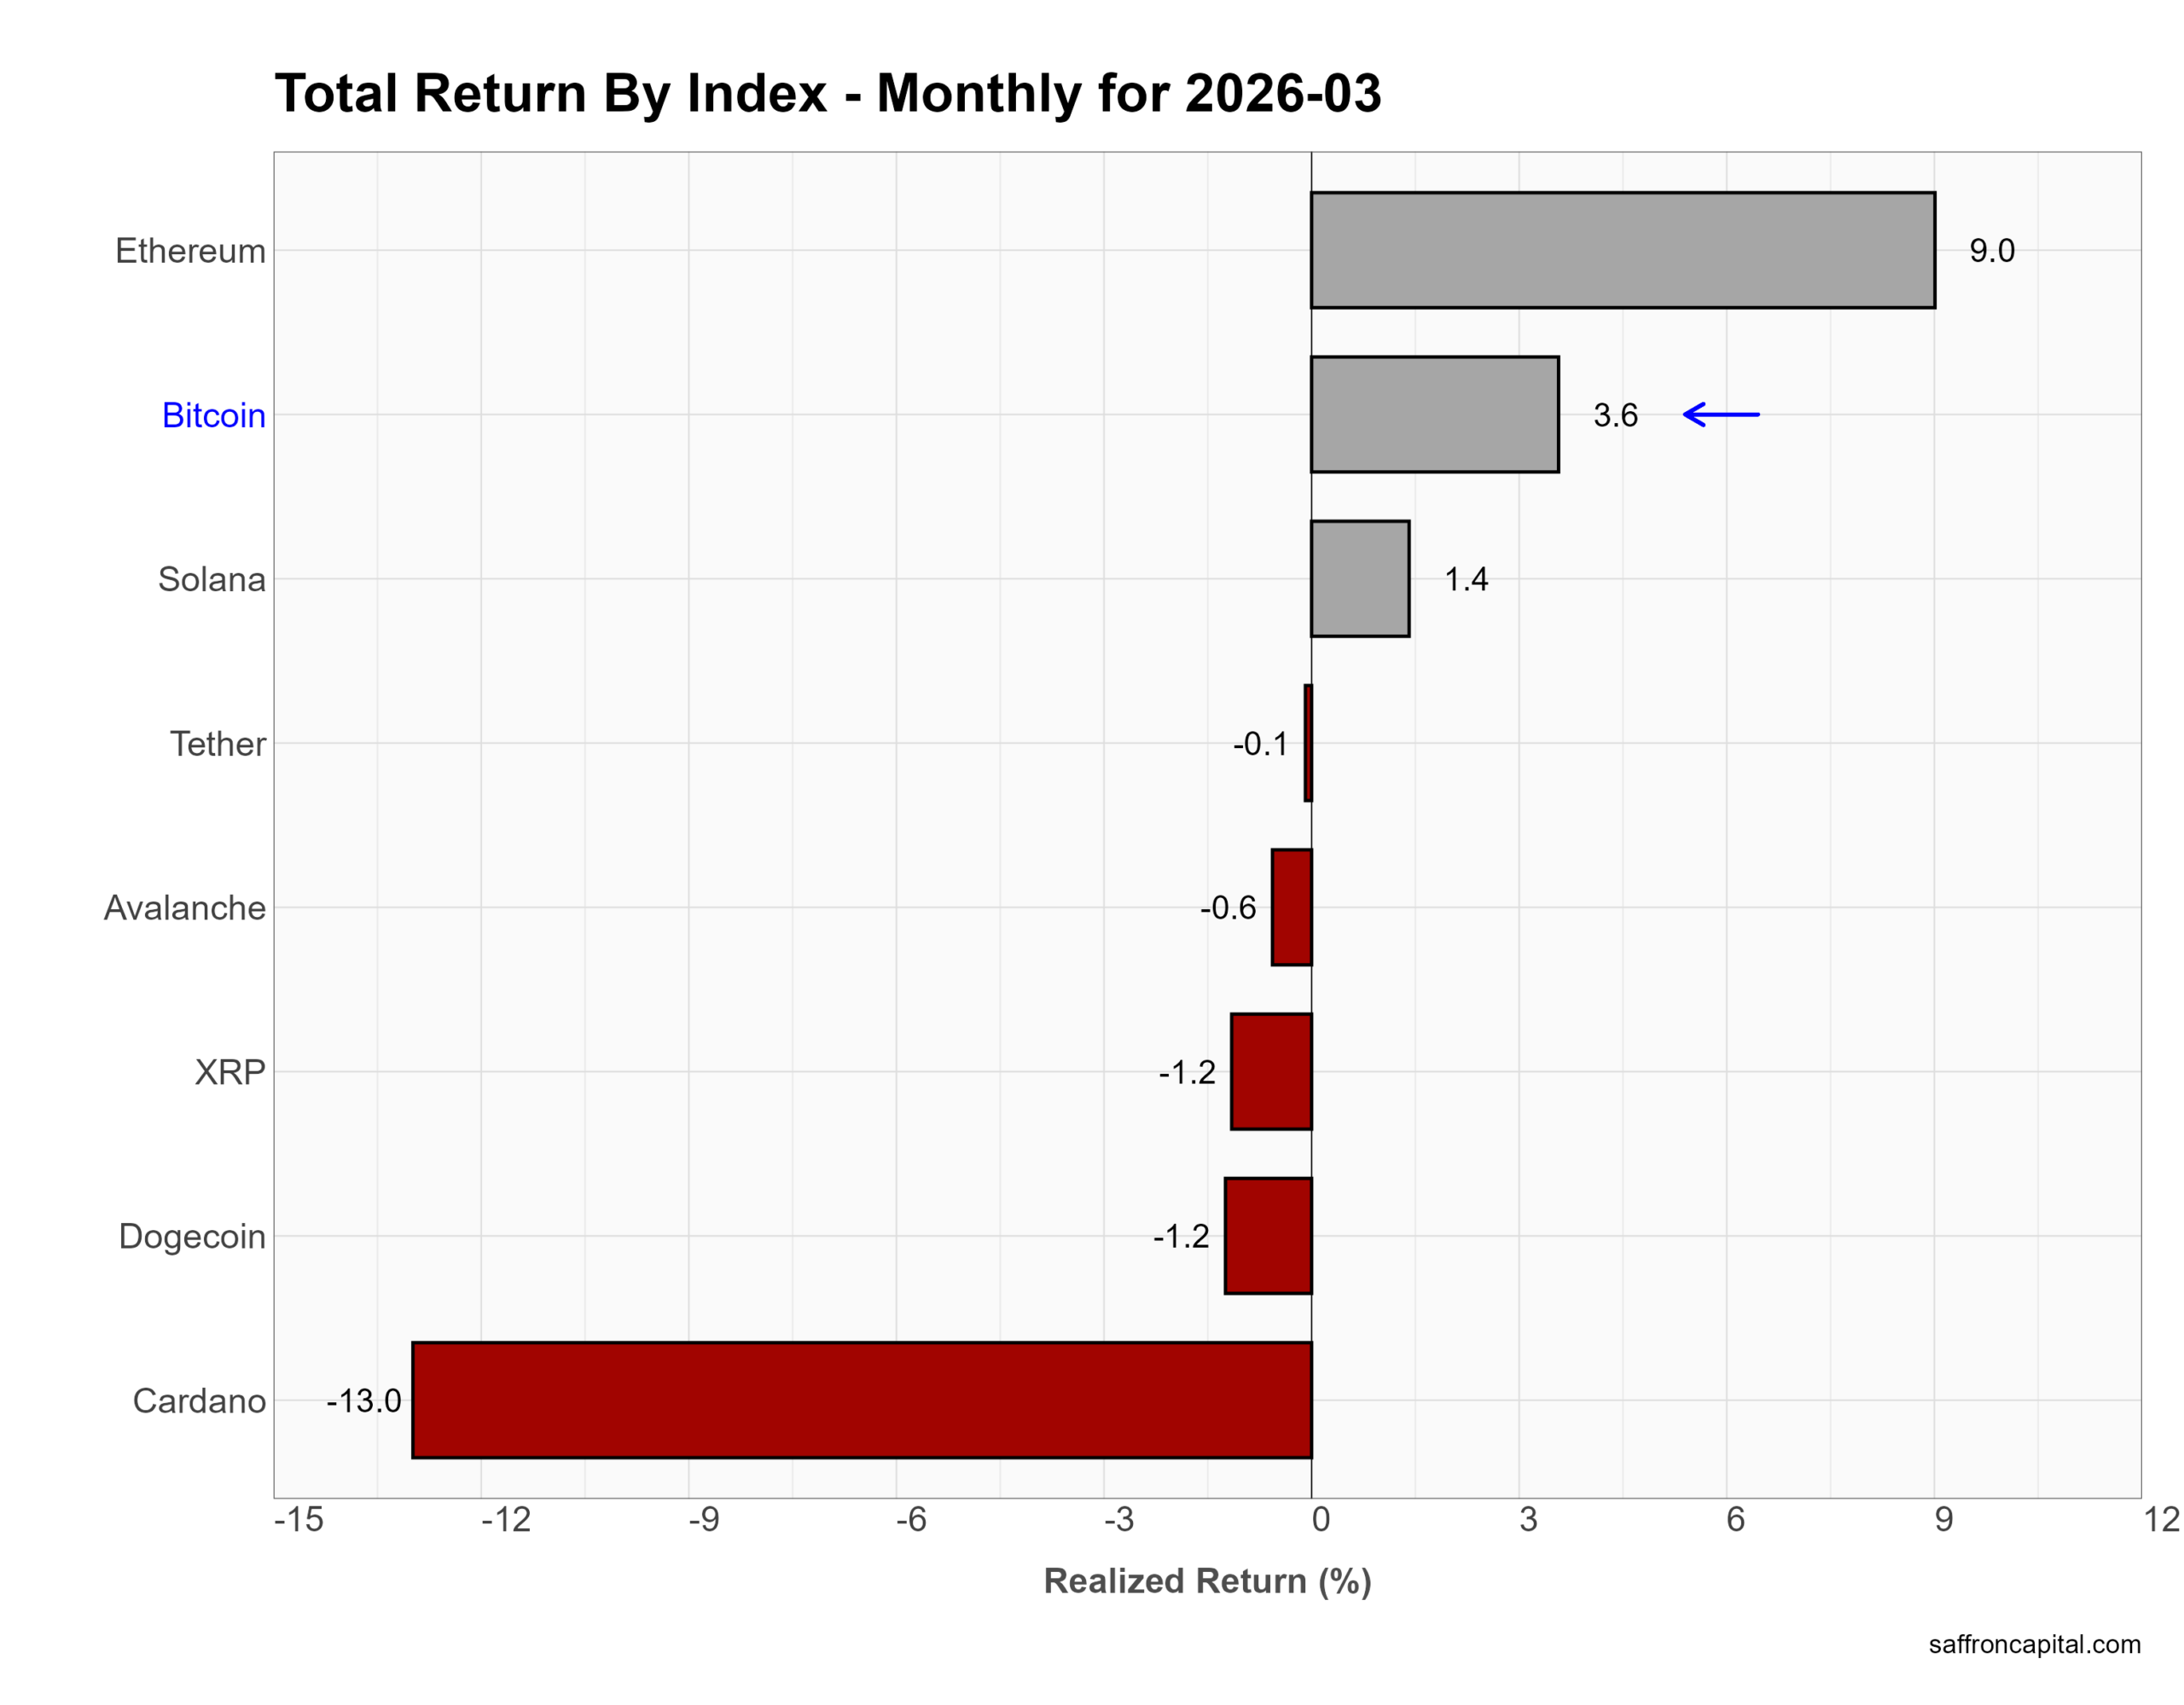
March was mixed but fragile. Ethereum led with a 9.0% gain, while Bitcoin rose 3.6% and Solana added 1.4%. Most altcoins lagged. XRP and Dogecoin fell 1.2%, Avalanche slipped 0.6%, and Cardano dropped 13.0%. Tether was flat. Overall, selective strength in majors failed to lift broader crypto.
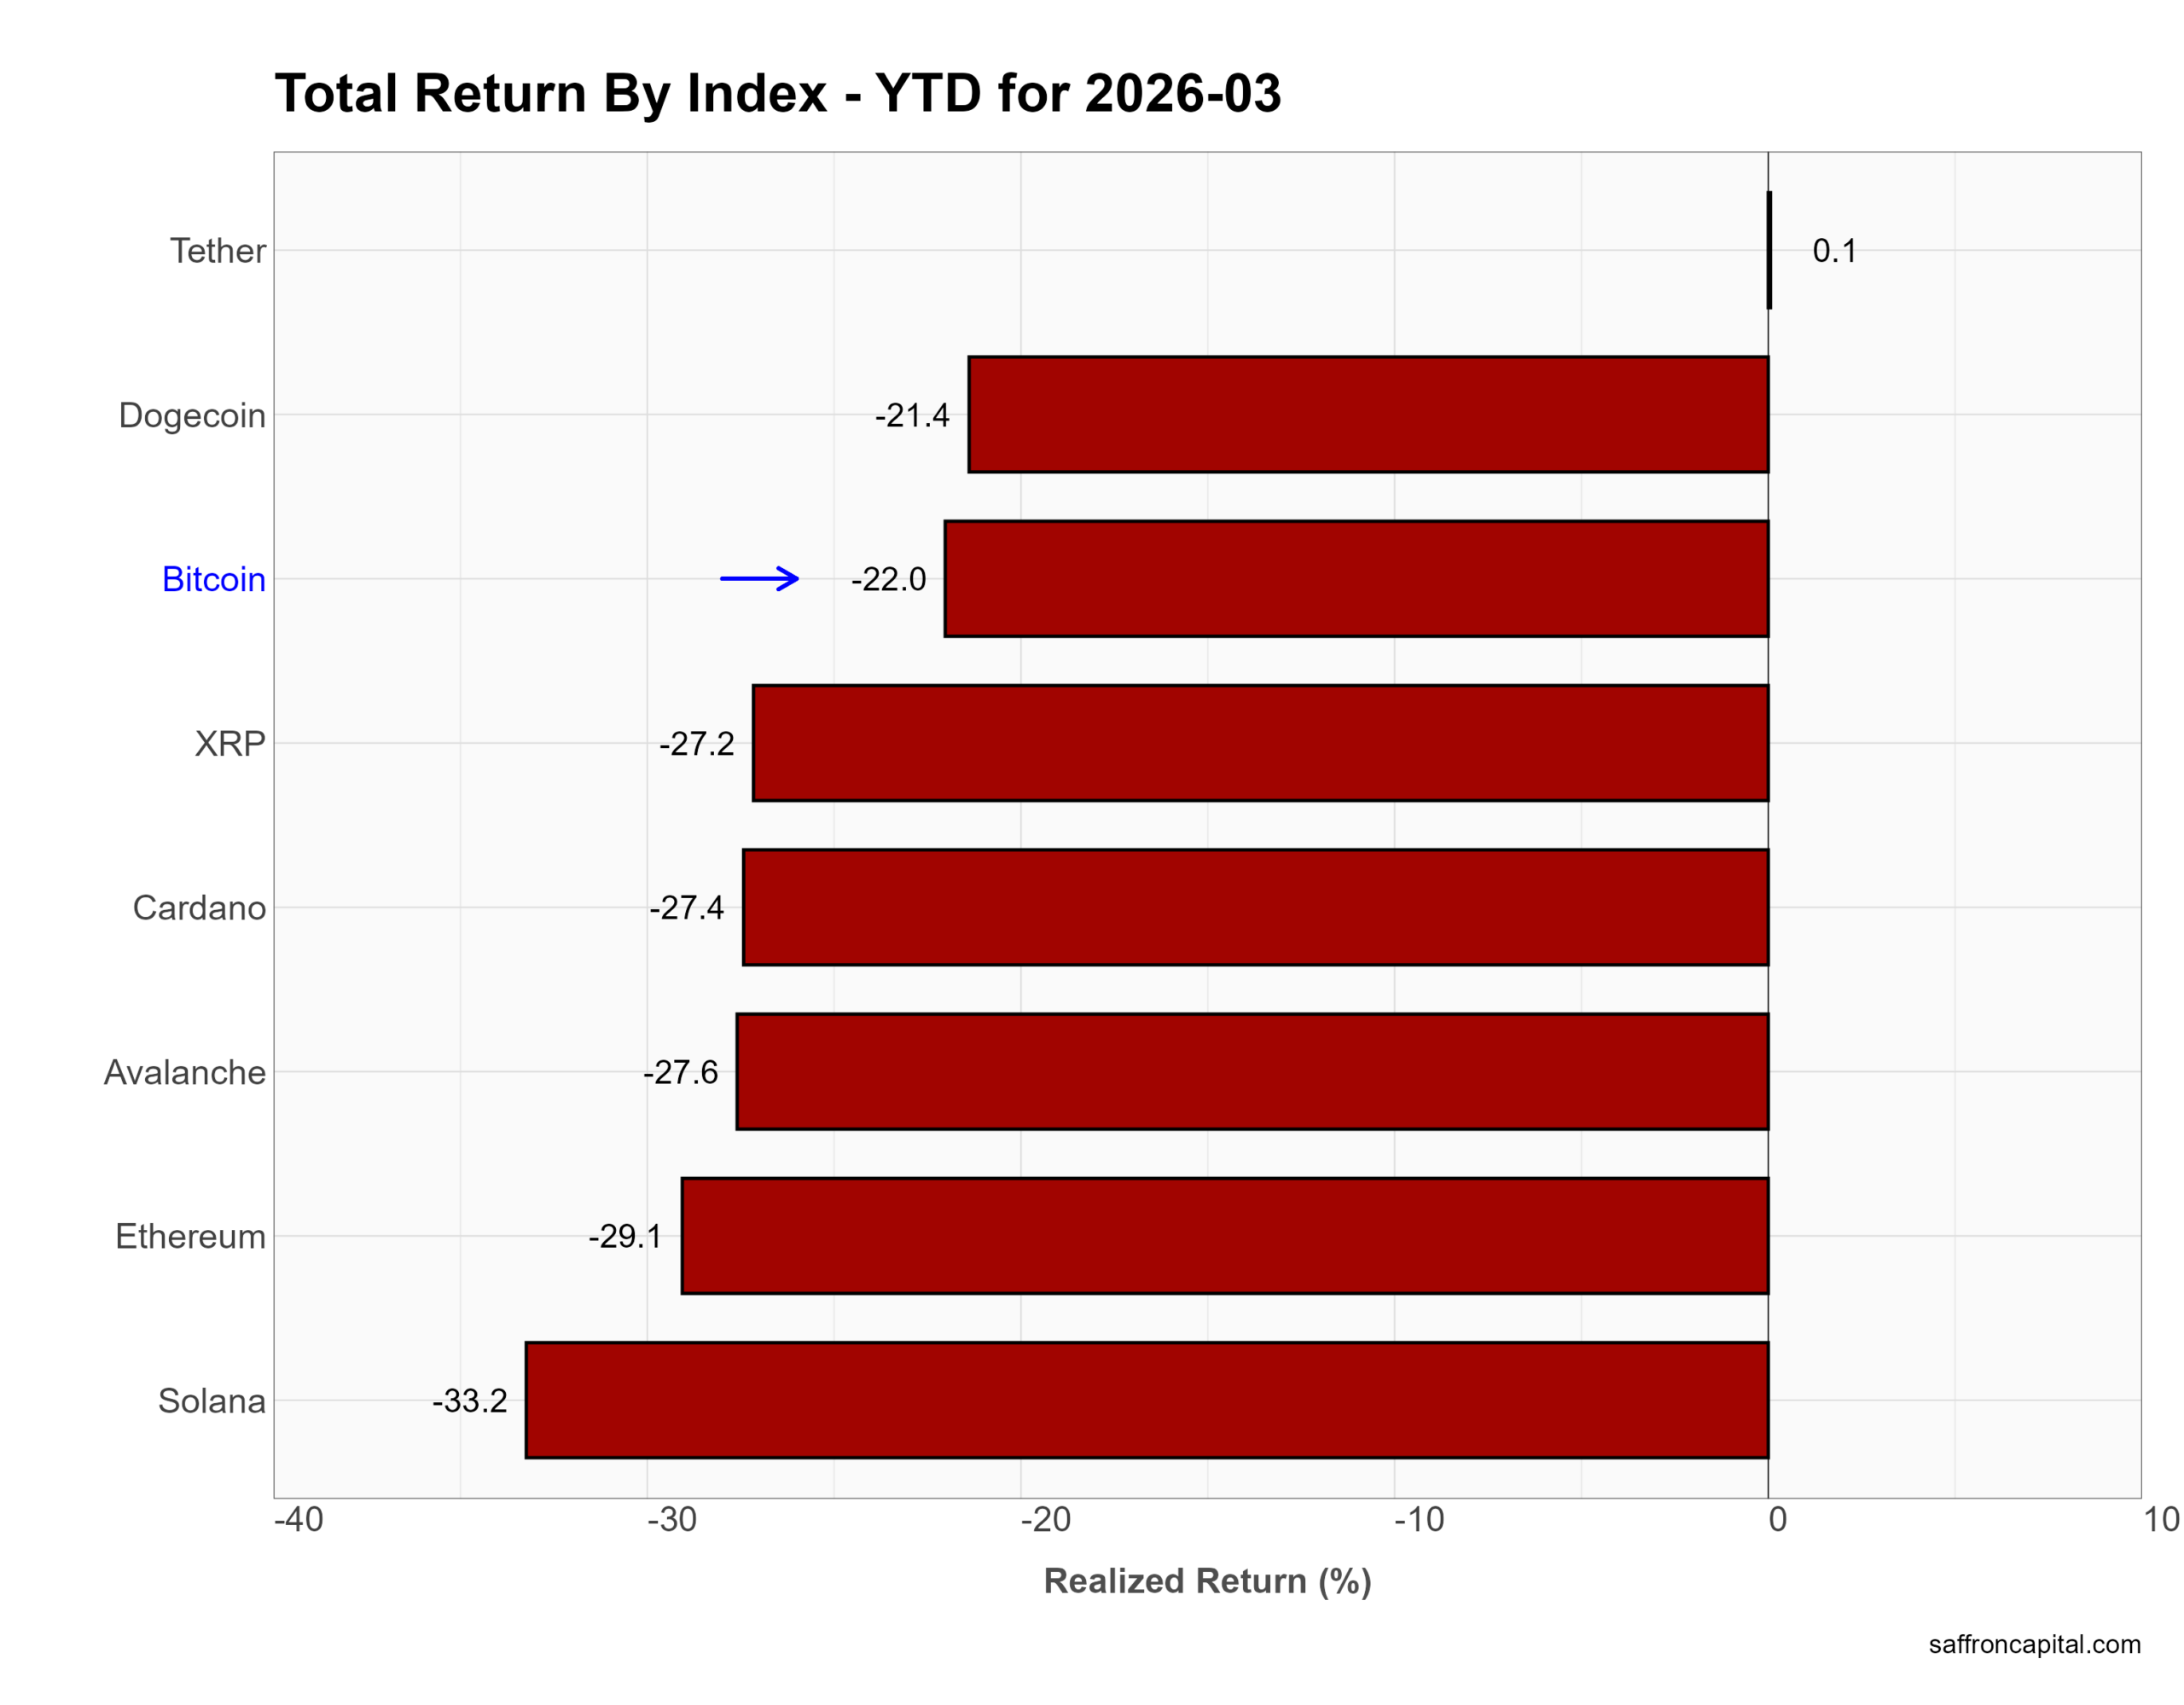
Year to date, losses remain steep. Bitcoin is down 22.0%. Ethereum (-29.1%) and Solana (-33.2%) lead the downside. Avalanche, Cardano, and XRP are all down roughly 27%, while Dogecoin has fallen 21.4%. Tether remains stable. In short, crypto is still in a drawdown phase despite short-term rebounds.
Click to enlarge
Risk-Adjusted Royalty
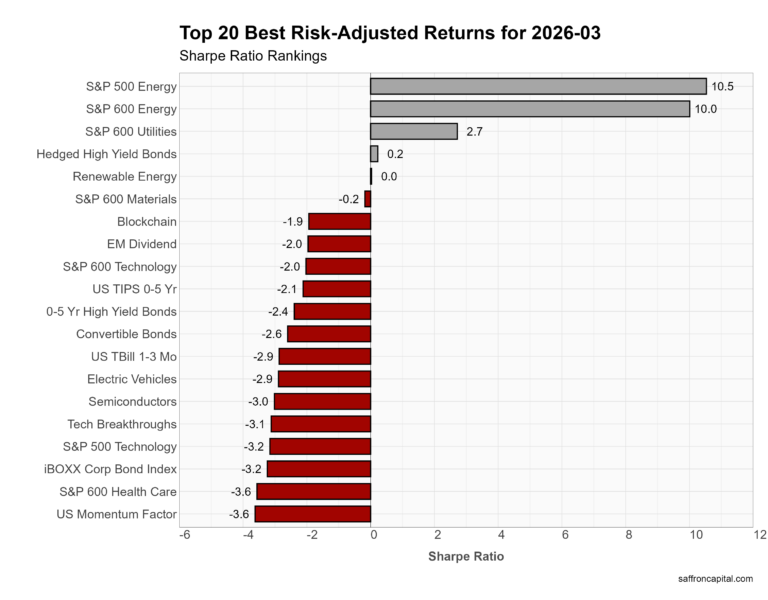
Returns alone don’t tell the story. This ranking shows which assets delivered the most reward for every unit of risk taken.
Energy dominated the Sharpe Ratio rankings, with S&P 500 Energy and S&P 600 Energy posting by far the highest Sharpe ratios, reflecting strong returns with relatively contained volatility. Utilities also stood out, offering positive risk-adjusted performance as a defensive haven.
Beyond that, very few assets delivered positive Sharpe ratios. Hedged high yield and renewable energy were roughly flat on a risk-adjusted basis. Most other assets were negative, including technology, semiconductors, momentum, and broad credit indices.
In short, March rewarded concentrated exposure to energy and select defensives, while most risk assets failed to compensate investors for volatility.
Have questions or concerns about the performance of your portfolio? Could you benefit from a capital preservation strategy or a custom portfolio formulation that better aligns to your return goals and risk appetite? Whatever your needs, we are here to listen and to help. Contact us here.
Saffron Capital LLC is a registered investment advisor that provides guided growth and risk-managed portfolios. The company is employee-owned and Minnesota-based.


