ETF Fund Flows
May 18, 2023
June 2023 Returns and Asset Performance
July 2, 2023Major Asset Classes
May 2023
Performance Comparison
Introduction
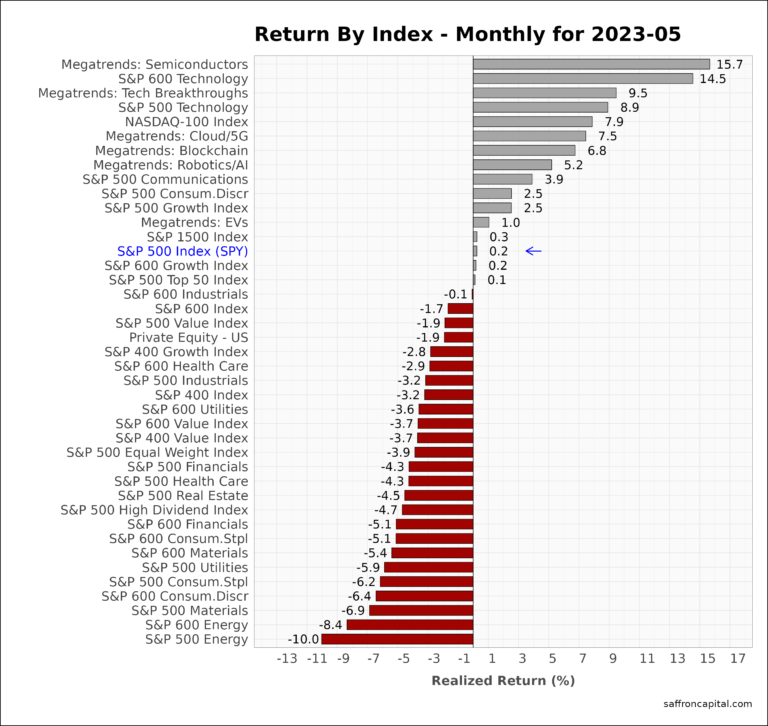
May 2023 returns were influenced by a high degree of outlook uncertainty. As a result, returns were lackluster or negative for many assets. For example, a small number of megacaps helped the S&P 500 Index (+0.2%). Across the sectors, Information Technology (+8.9%) and Communication Services (+3.9%) were top performors. In contrast, small cap (-1.7%) and mid cap (-3.2%) equities struggled. The sectors with the largest declines included Energy (-10.0%) and materials (-6.9%) shares. International shares also were weak with Developed Markets (-4.1%) lagging behind Emerging Markets (-2.1%). Most US fixed income indexes posted losses, as seen by the US Aggregate Bond Index (-1.1%) and the iBoxx Corporate bond index (-1.2%). Finally, the US Dollar Index (+2.8%) rose in May, supporting a sharp decline in commodities (-6.1%).
The following analysis provides a visual record of May 2023 returns across and within the major asset classes. The report is prepared to assist investors with portfolio performance benchmarking.
US Equities
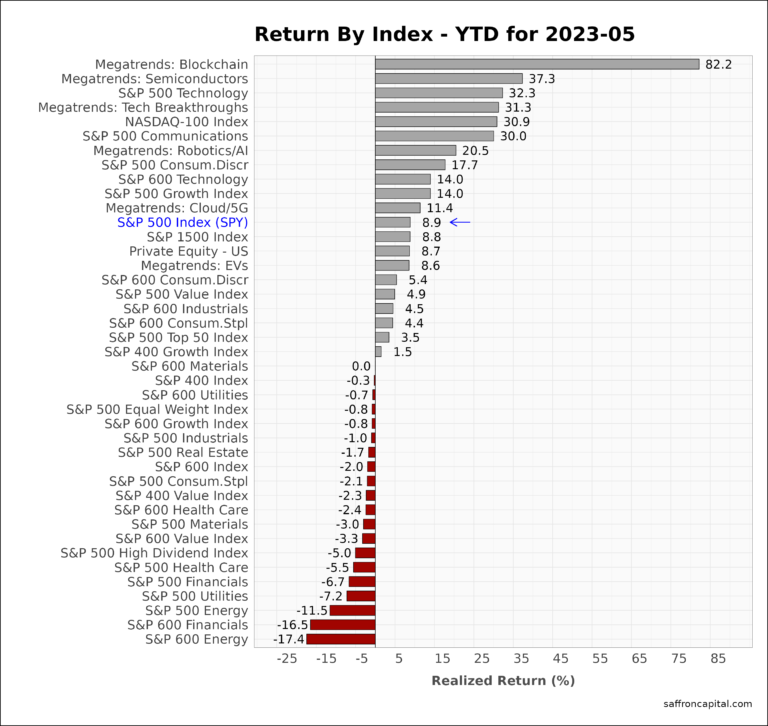
The market sectors that topped May returns include semiconductors (+15.7%), small cap technology (+14.5%) and large cap Technology (+8.9%). Meanwhile, large cap growth (+2.5%) easily outperformed large cap value (-1.9%). Year-to-date, the S&P 500 index (+8.9%) is little changed from last month. Its worth noting that the strong year-to-date gains for semiconductors (+37.3%) are still eclipsed by the returns of Blockchain related shares (+87.2%). The worse performing sectors since January include small cap Energy (-17.4%), small cap Financials (-16.5%), large cap Energy (-11.5%) and large cap Utilities (-7.2%).
Developed Market Equities
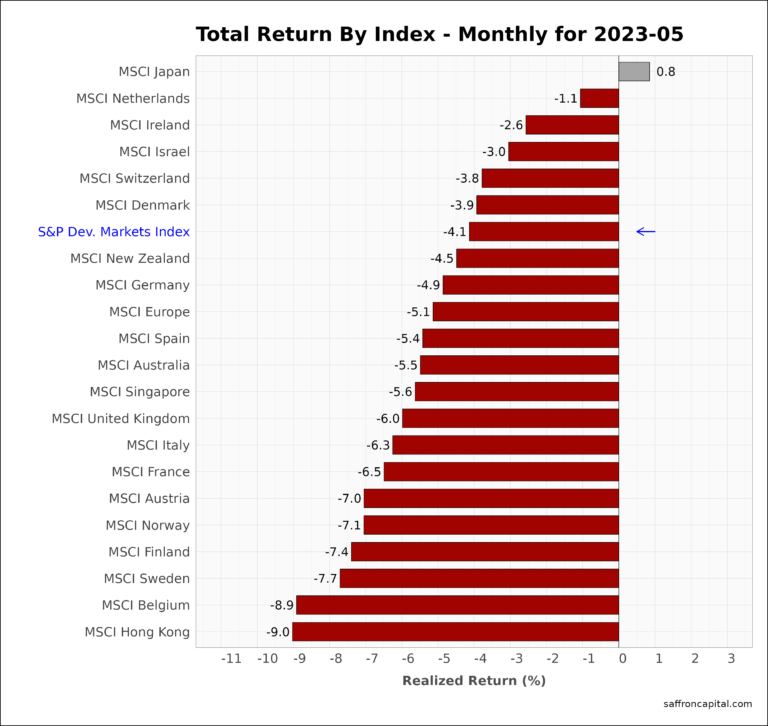
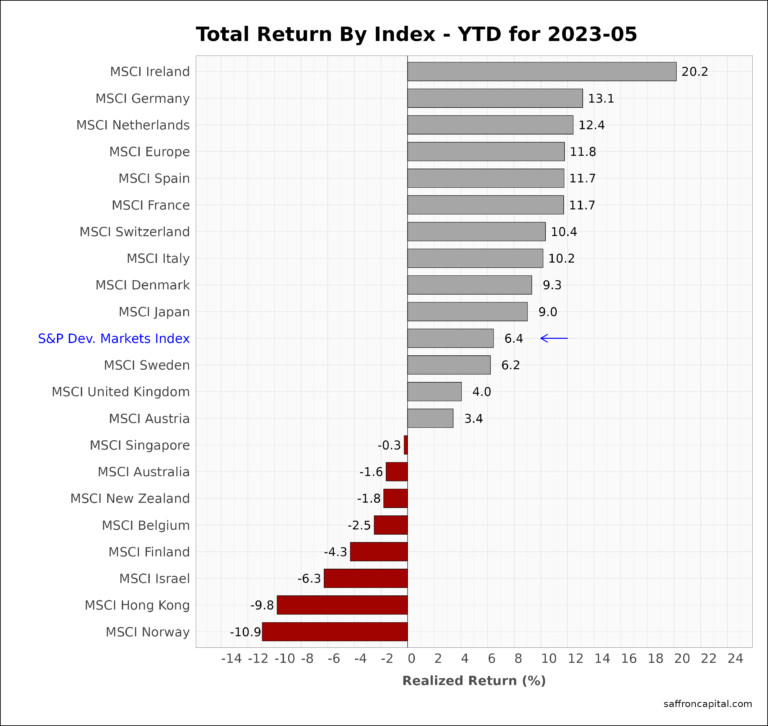
international developed markets (-4.1%) lagged US equities, ending a 3-month leadership run. Weakness was most evident in the MSCI Europe index (-5.1%). Only Japan (+0.8%) had positive returns in May. Since January, European shares (+11.7) continue to beat US equities and the broader Developed market Index (+6.4%). Specifically, Ireland (+20.2%), Germany (+13.1%), and the Netherlands (+12.4%) have the highest returns among the developed markets this year.
Click to enlarge
Emerging Market Equities
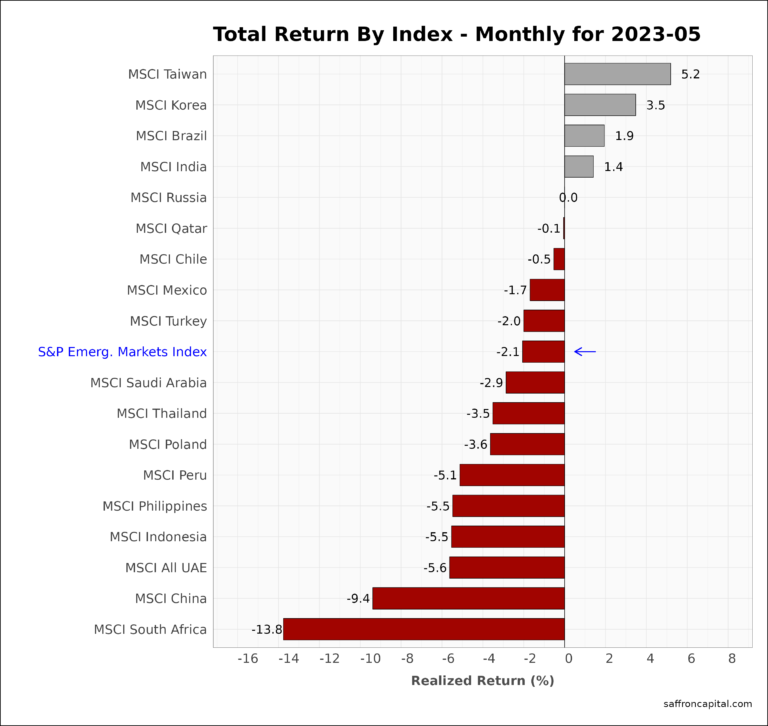
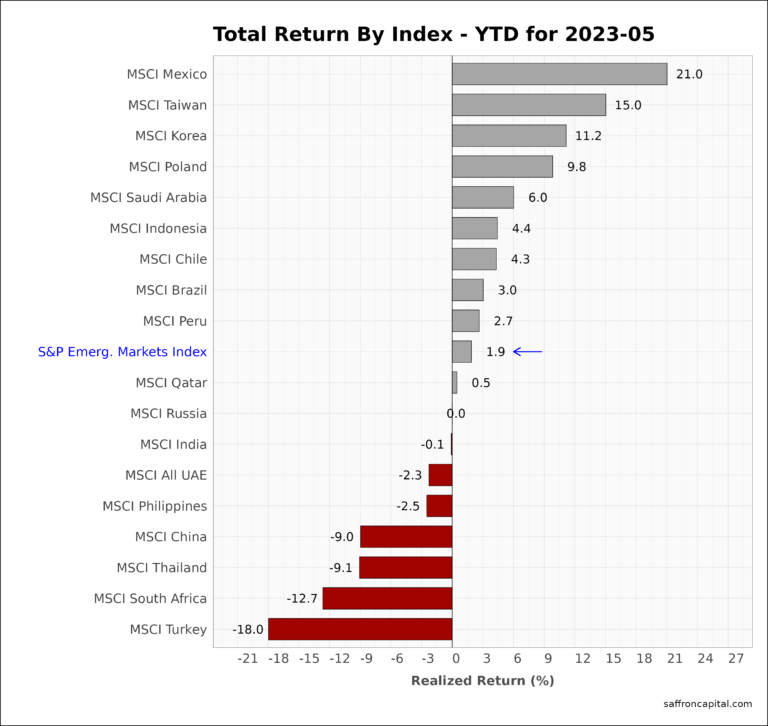
May 2023 returns for the S&P Emerging Markets Index (-2.1%) trailed the US, but outperformed the developed markets. Strong returns were realized in Taiwan (+5.2%), Korea (+3.5%) and Brazil (+1.9%). The weakest performers were South Africa (-13.8%), China (-9.4%) and the UAE (-5.6%). Year-to-date performance for emerging markets (+1.9%) reflects broadly divergent results. Mexico continues to lead (+21.0%), followed by Taiwan (+15.0%) and Korea (+11.2%). Meanwhile, after a difficult start to the year, shares in India (-0.1) are finally back to where they started the year.
Government Bonds
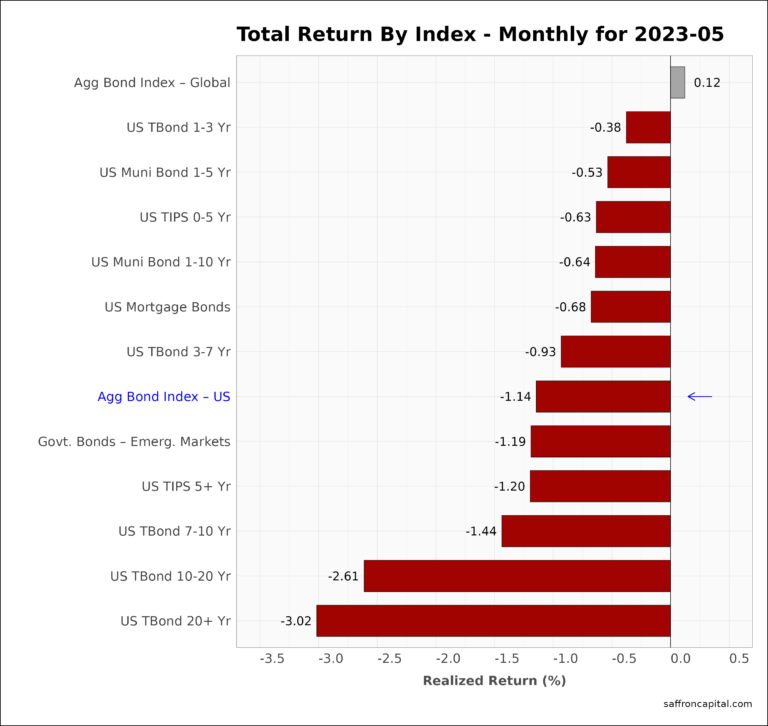
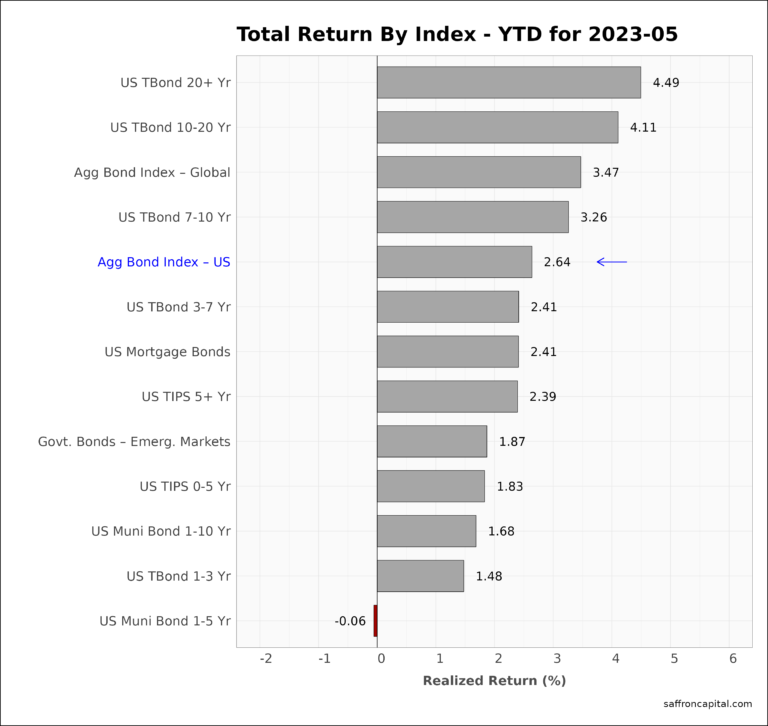
May price returns for government bonds (-1.14) reflected the market’s outlook uncertainty regarding Fed policy and the prospects for a recession. Yields were up across the board, with the exception of the global aggregates bond index (+0.12%). Its worth noting that the US 20 year bond index (-3.02%) was particularly hard hit, potentially creating good buying opportunities. Year-to-date, returns for the Aggregate bond index (+2.64%) and long-dated US treasury bonds (+4.69%) remain solid when compared compared to 2022.
Corporate & Infrastructure Bonds
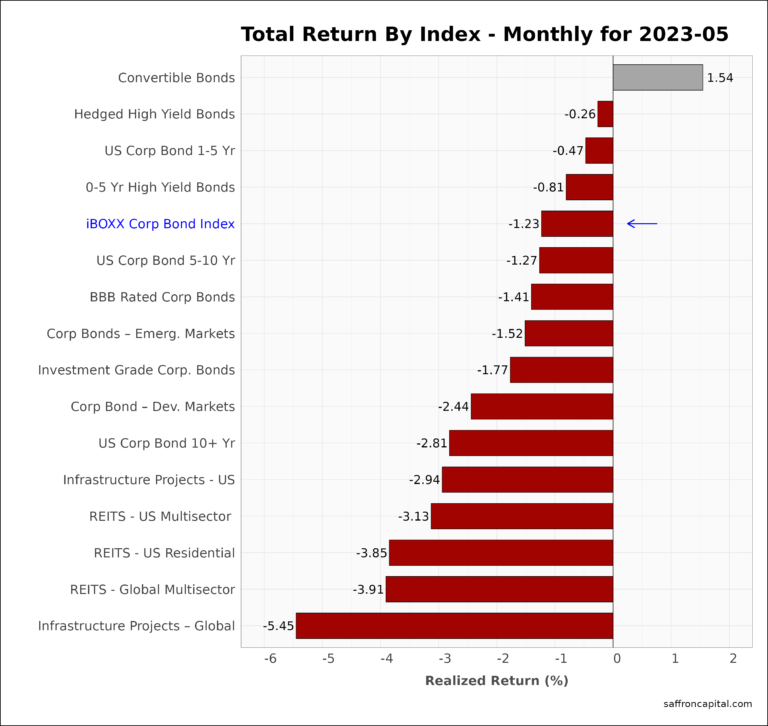
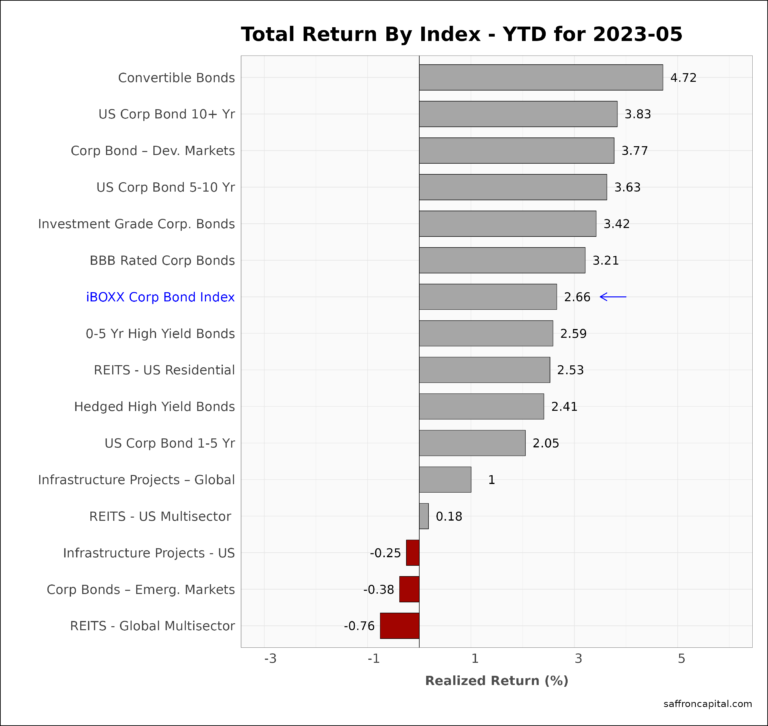
The iBoxx Corporate Bond Index (-1.23%) lagged Treasury bonds in May. Only the Convertible Bond index (+1.34%) had positive gains. Another solid performer, on a relative basis, was hedged high-yield bonds (-0.26%). In contrast, bonds for global infrastructure projects (-5.45%) and US infrastructure projects (-2.94%) were hard hit. Performance since January has favored Convertible bonds (+4.72%), US Corp Bonds maturing in 7 to 10 years (+3.83%) and international Developed Market bonds (+3.77%).
Commodities
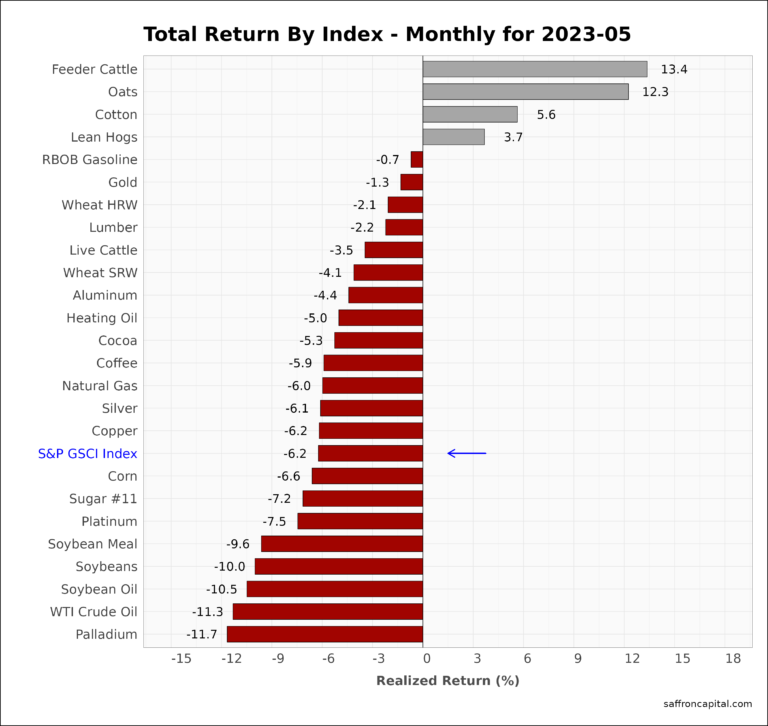
May 2023 returns for the S&P GSCI index (-6.1%) masked the wide range of results across commodities. For example, meat prices, particularly Feeder Cattle (+13.4%), continued to inflate,as did Oats(+12.3%) and cotton (+5.6%). The weakest commodities were Palladium (-11.7%) and WTI Crude Oil (11.3%). Year-to-date, commodities continue to trend down as shown by the S&P GSCI index (-12.1%).
Currencies
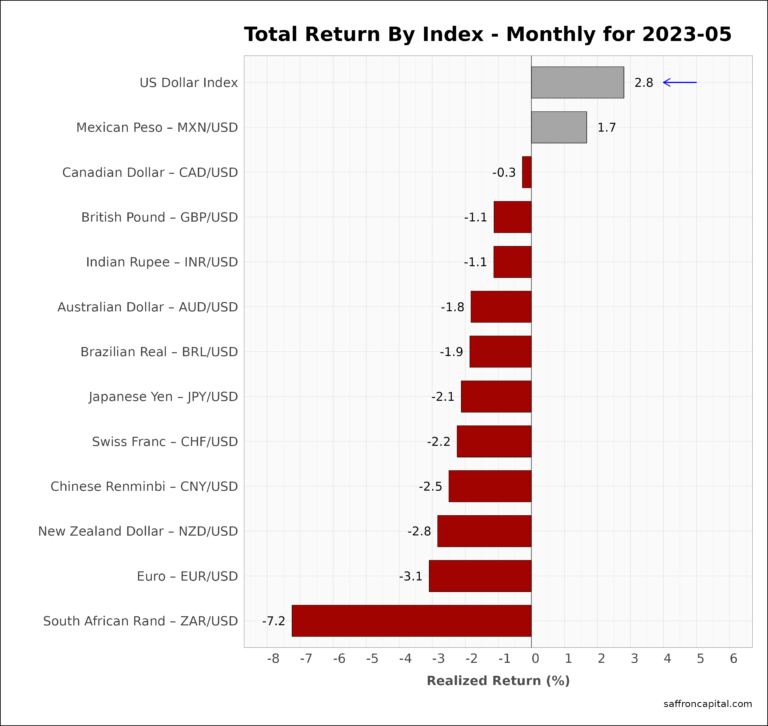
The US Dollar (+2.8%) reversed course in May, pulling down all currencies with the exception of the Mexican Peso (+1.7%). For all of 2023, the US Dollar index (+0.9%) has regained positive ground, along with the Mexico Peso (+10.1%), the Brazilian Real (+5.3%) and the British Pound (+3.0%).
Have questions or concerns about the performance of your portfolio? Looking for improved performance at a lower cost? Whatever your needs are, we are here to help and you can schedule time with us here.


