October returns ended on a strong note as year-on-year earnings growth of the S&P 500 index is coming at 10.7% for third quarter. The S&P 500 index (+2.3%) was up for the month supported by the Fed’s recent rate cut, supportive changes in Fed balance sheet management, and improved trade prospects with China. Blockbuster gains were in Semiconductors (+13.1%), Renewable Energy (+11.8%), and Robotics/AI (+11.6%). Rates fell during the month and long duration Treasury bonds (+1.4%) outperformed corporate IG bonds (+0.2%) of the same tenor. Gold (+3.7%) was positive for the month, but had retraced significant gains by month end, helped by a stronger US Dollar (+2.2%).
The following analysis reviews returns for the prior month using a visual summary by asset group. The aim is to help investors to benchmark portfolio returns and to see emerging trends across markets.
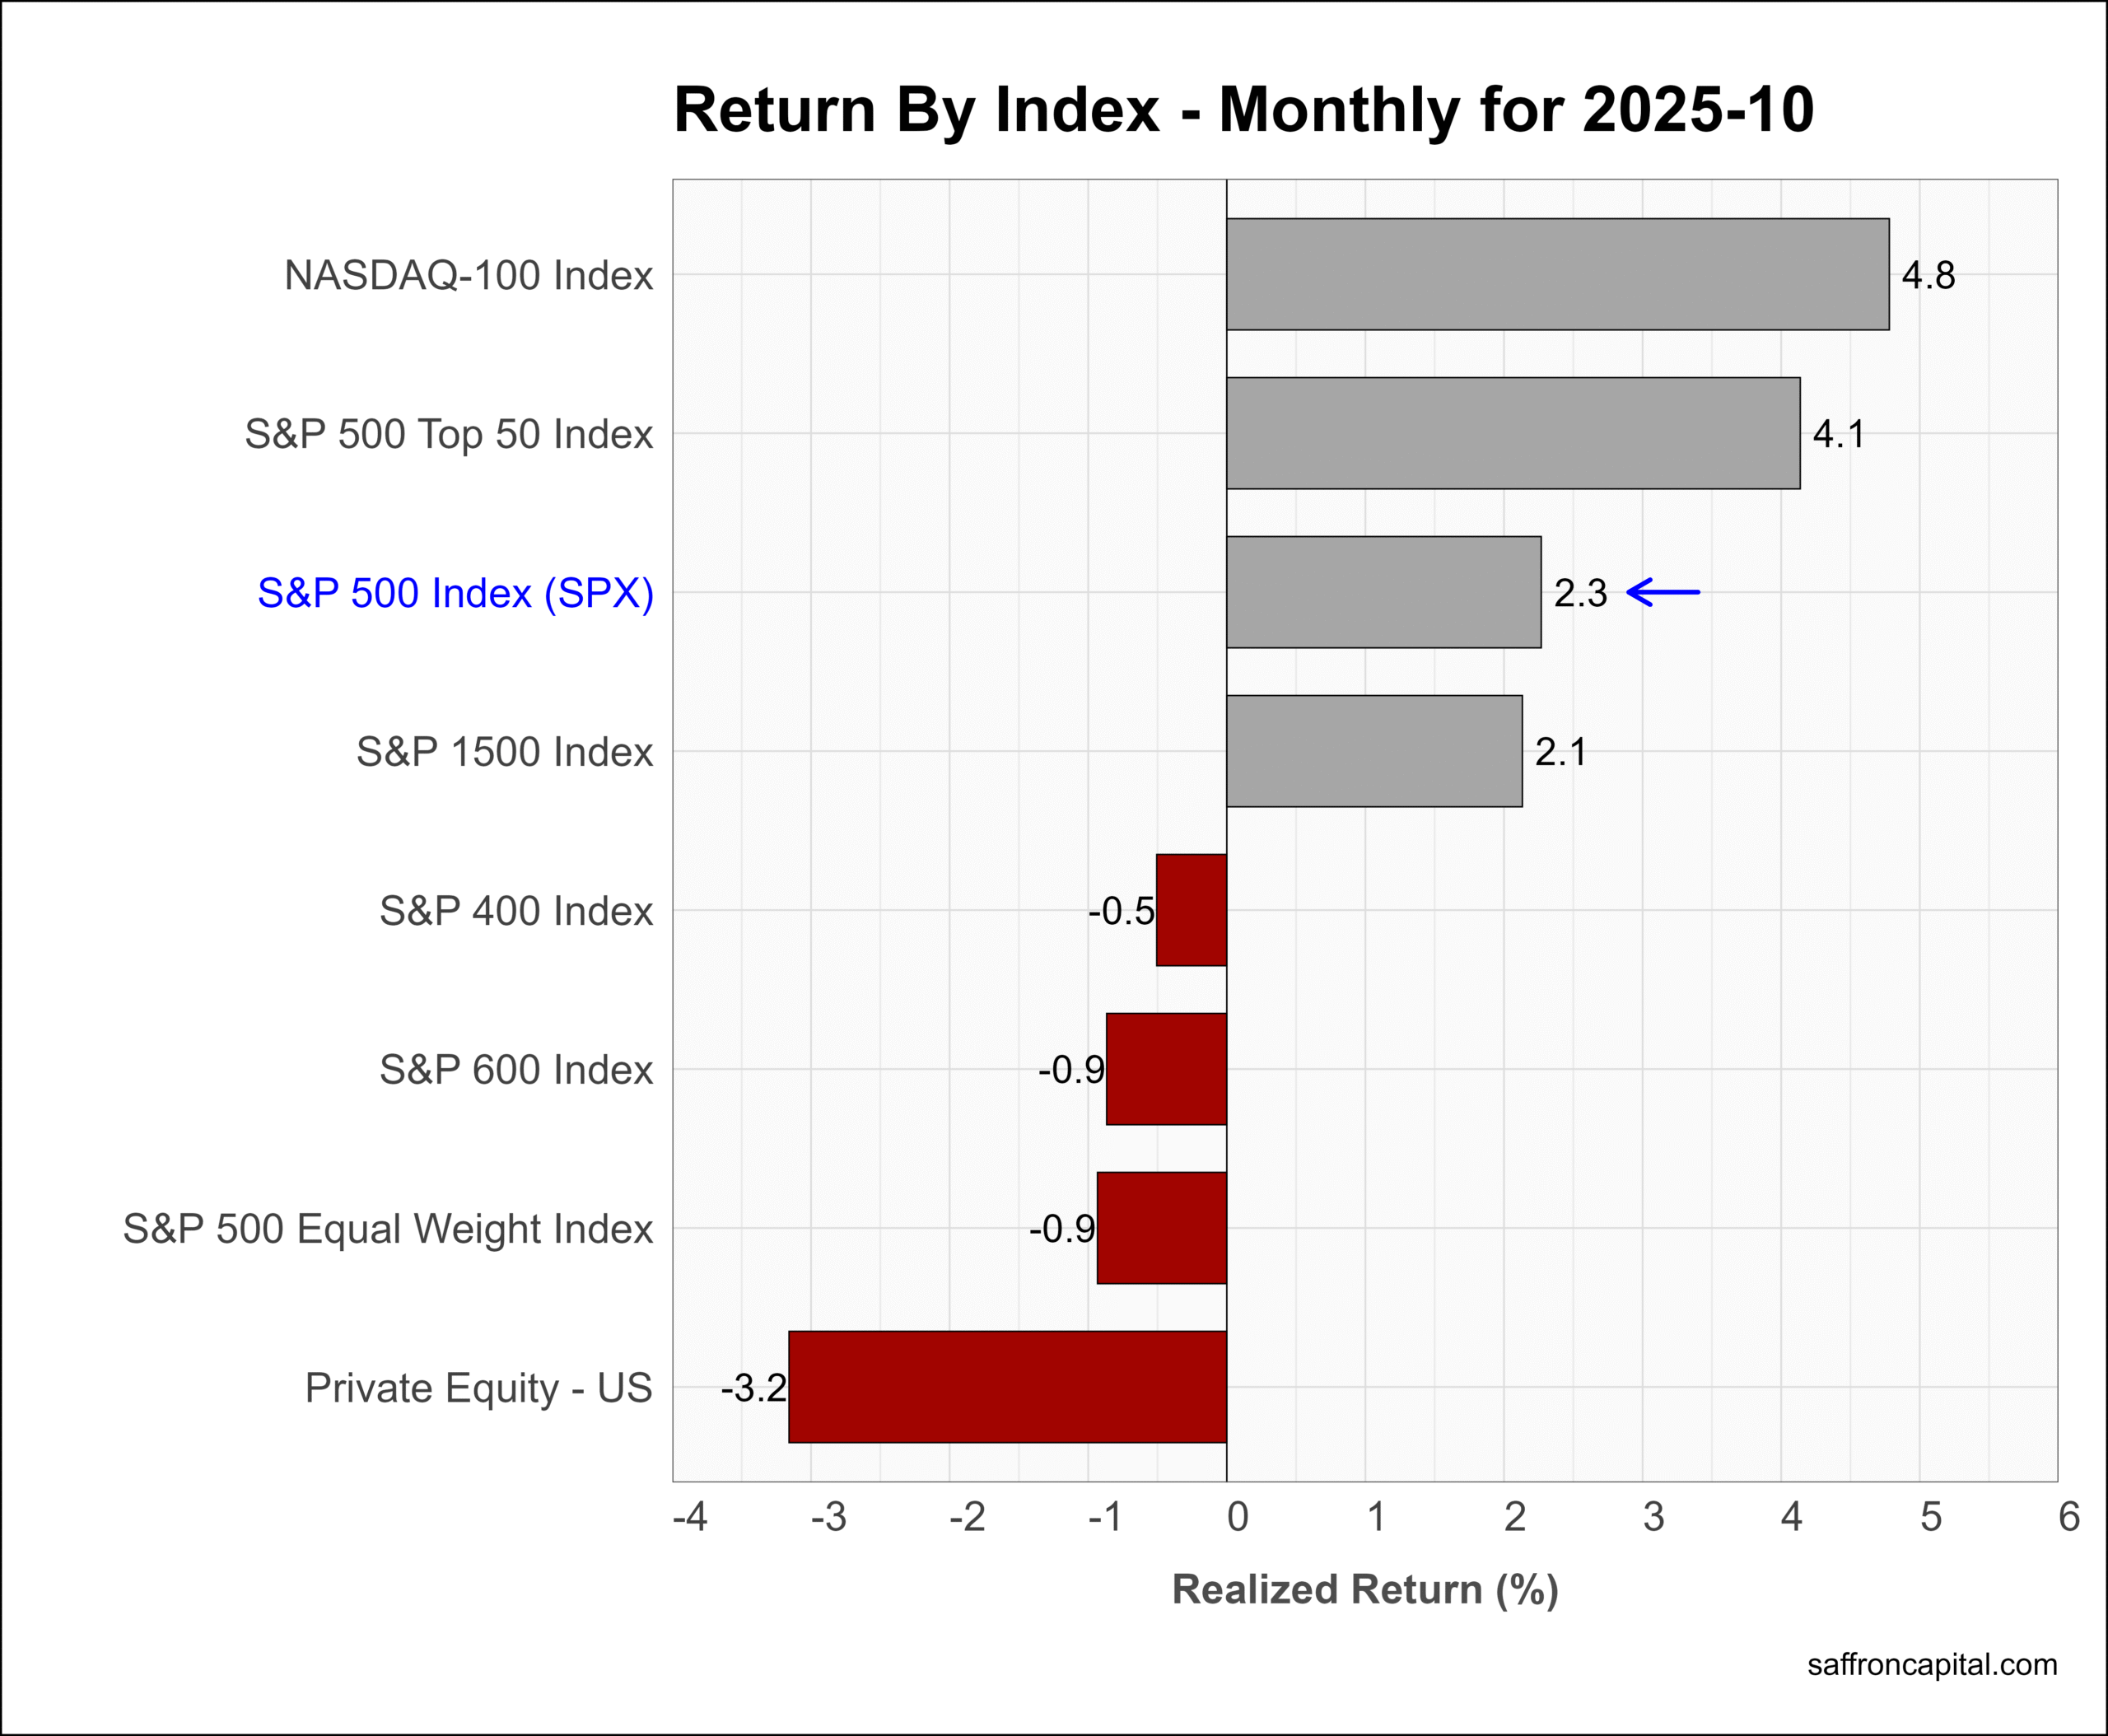
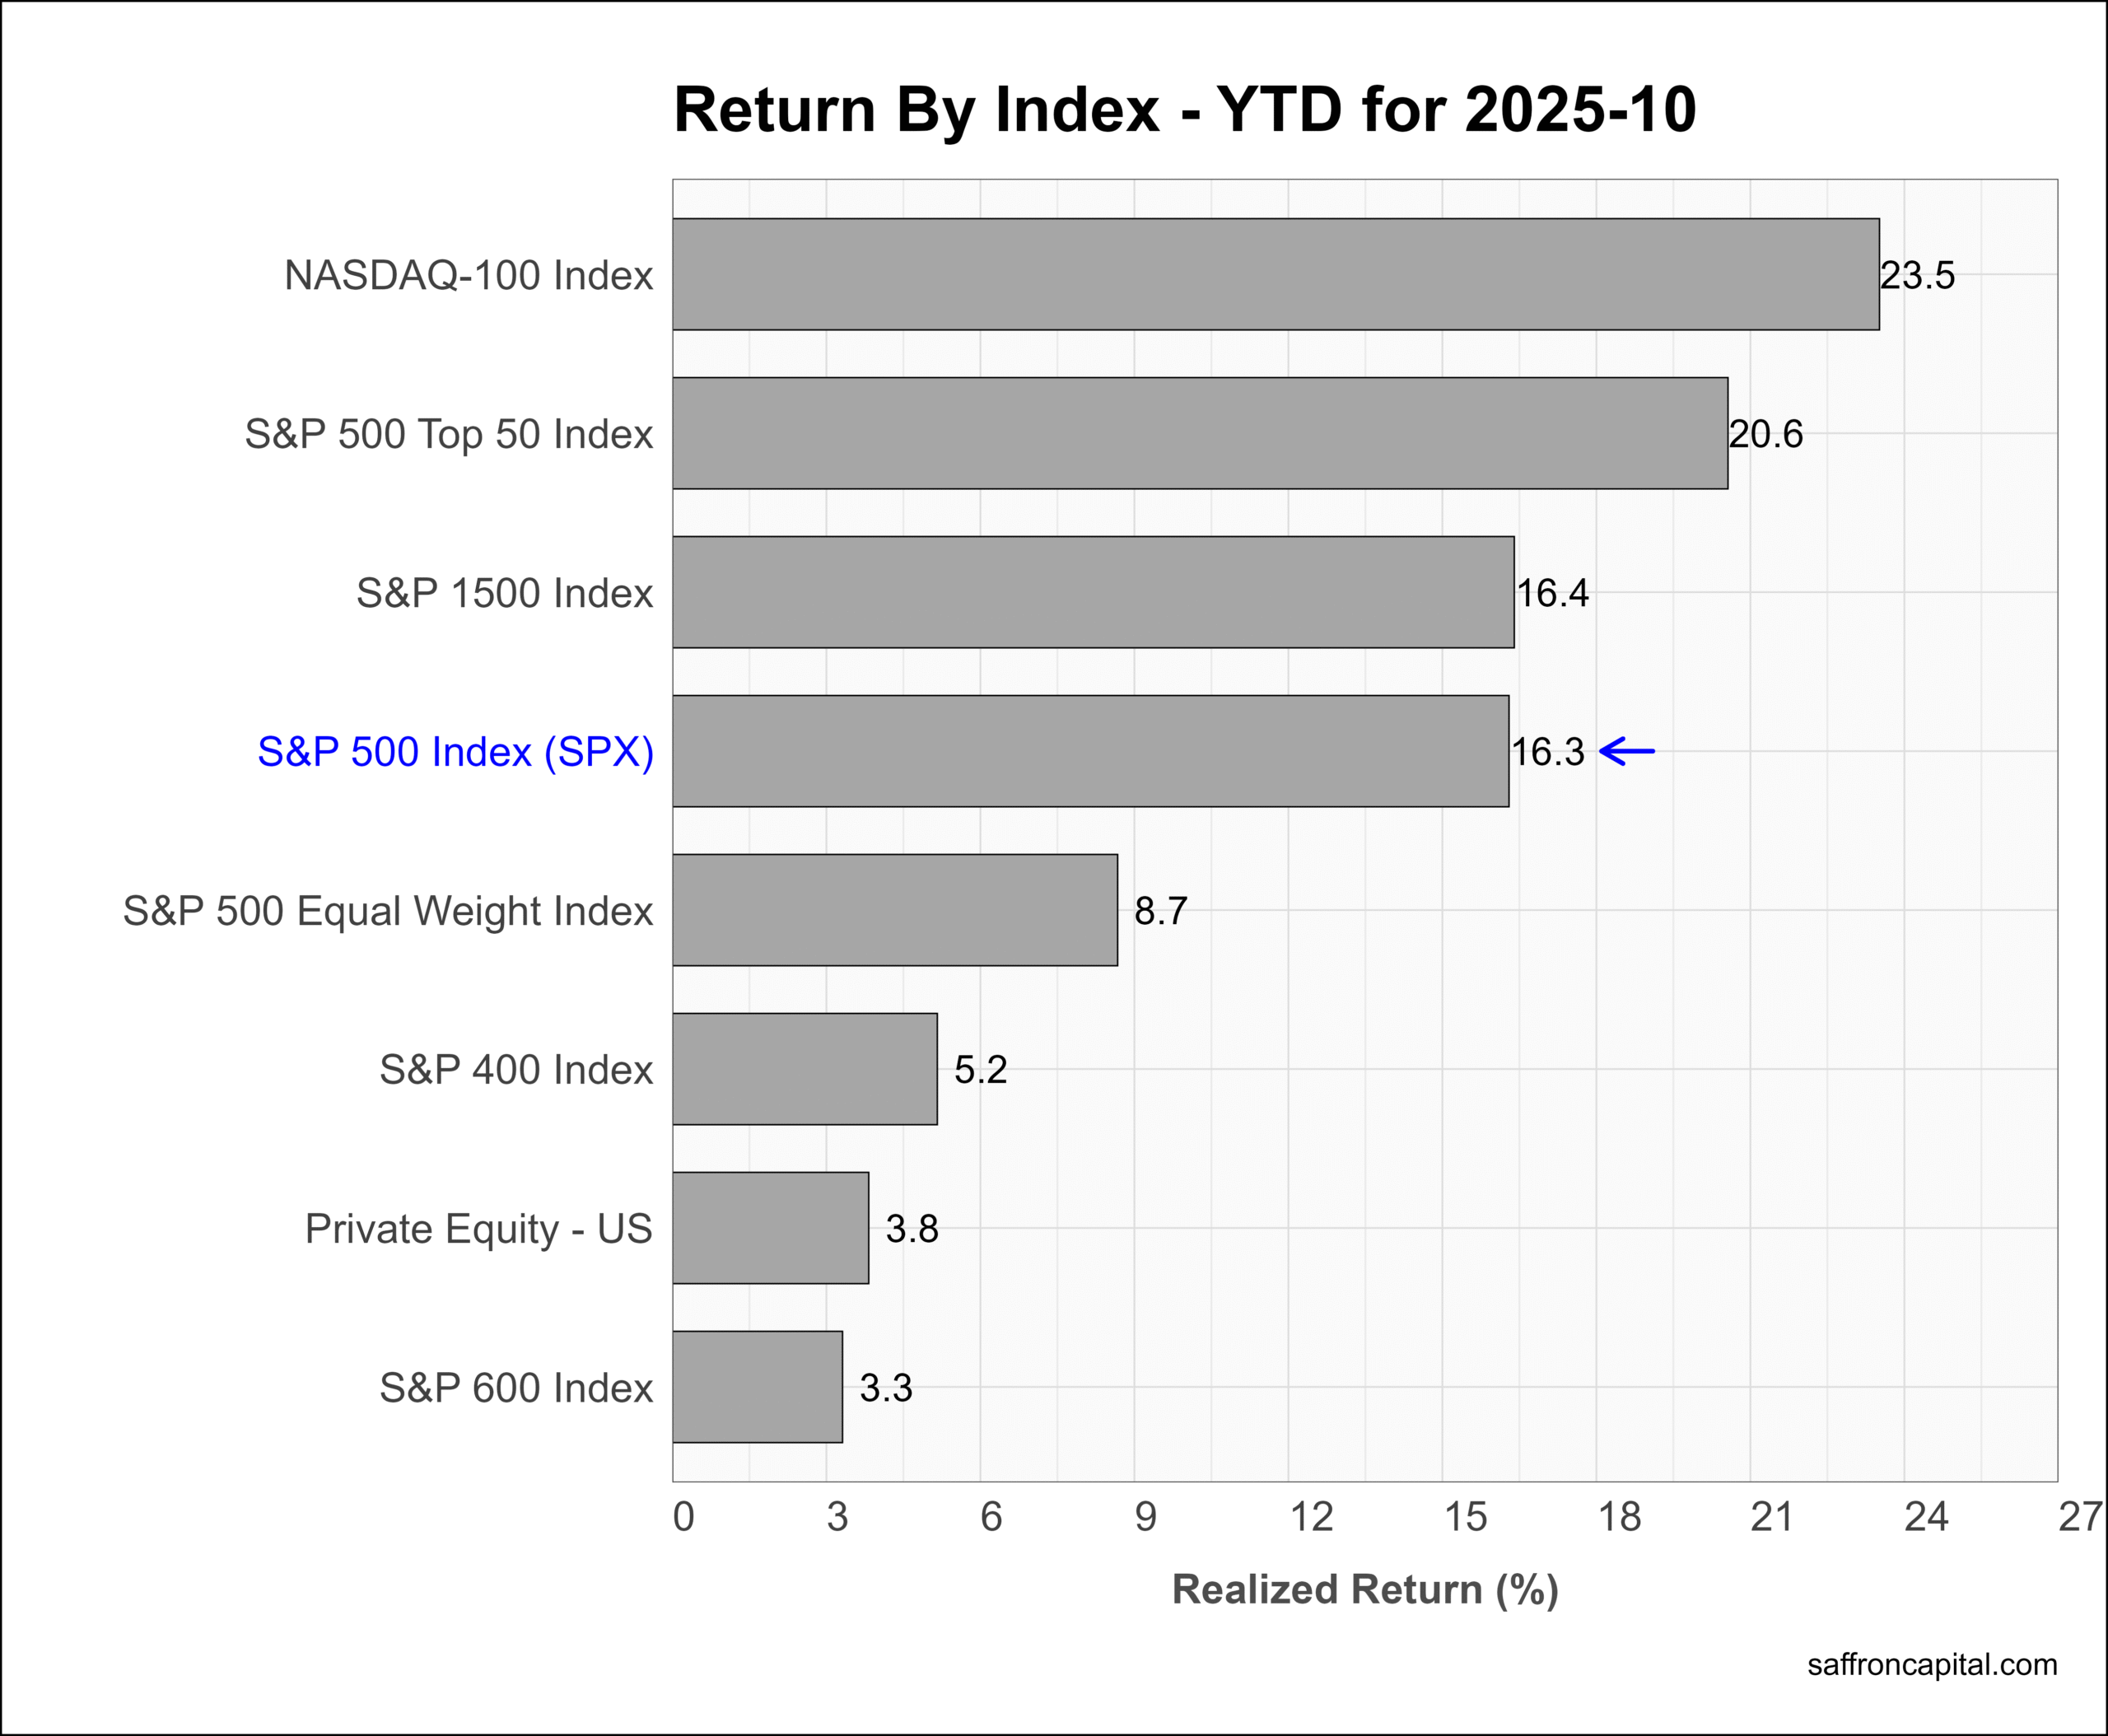
Core US Indices
The NASDAQ 100 index (+4.8%) again topped the headline indices in October and was followed by mega large-cap shares in the S&P 500 Top 50 (+4.1%). Market breadth was weak as the S&P 500 Equal Weight Index (-0.9%) was down, while Private equity funds (-3.2%) were down notably. Year-to-date, the Equal Weight Index (+8.7%) trails the S&P 500 Index (+16.3%) and the S&P 500 mega-caps (+20.6%).
Click to enlarge
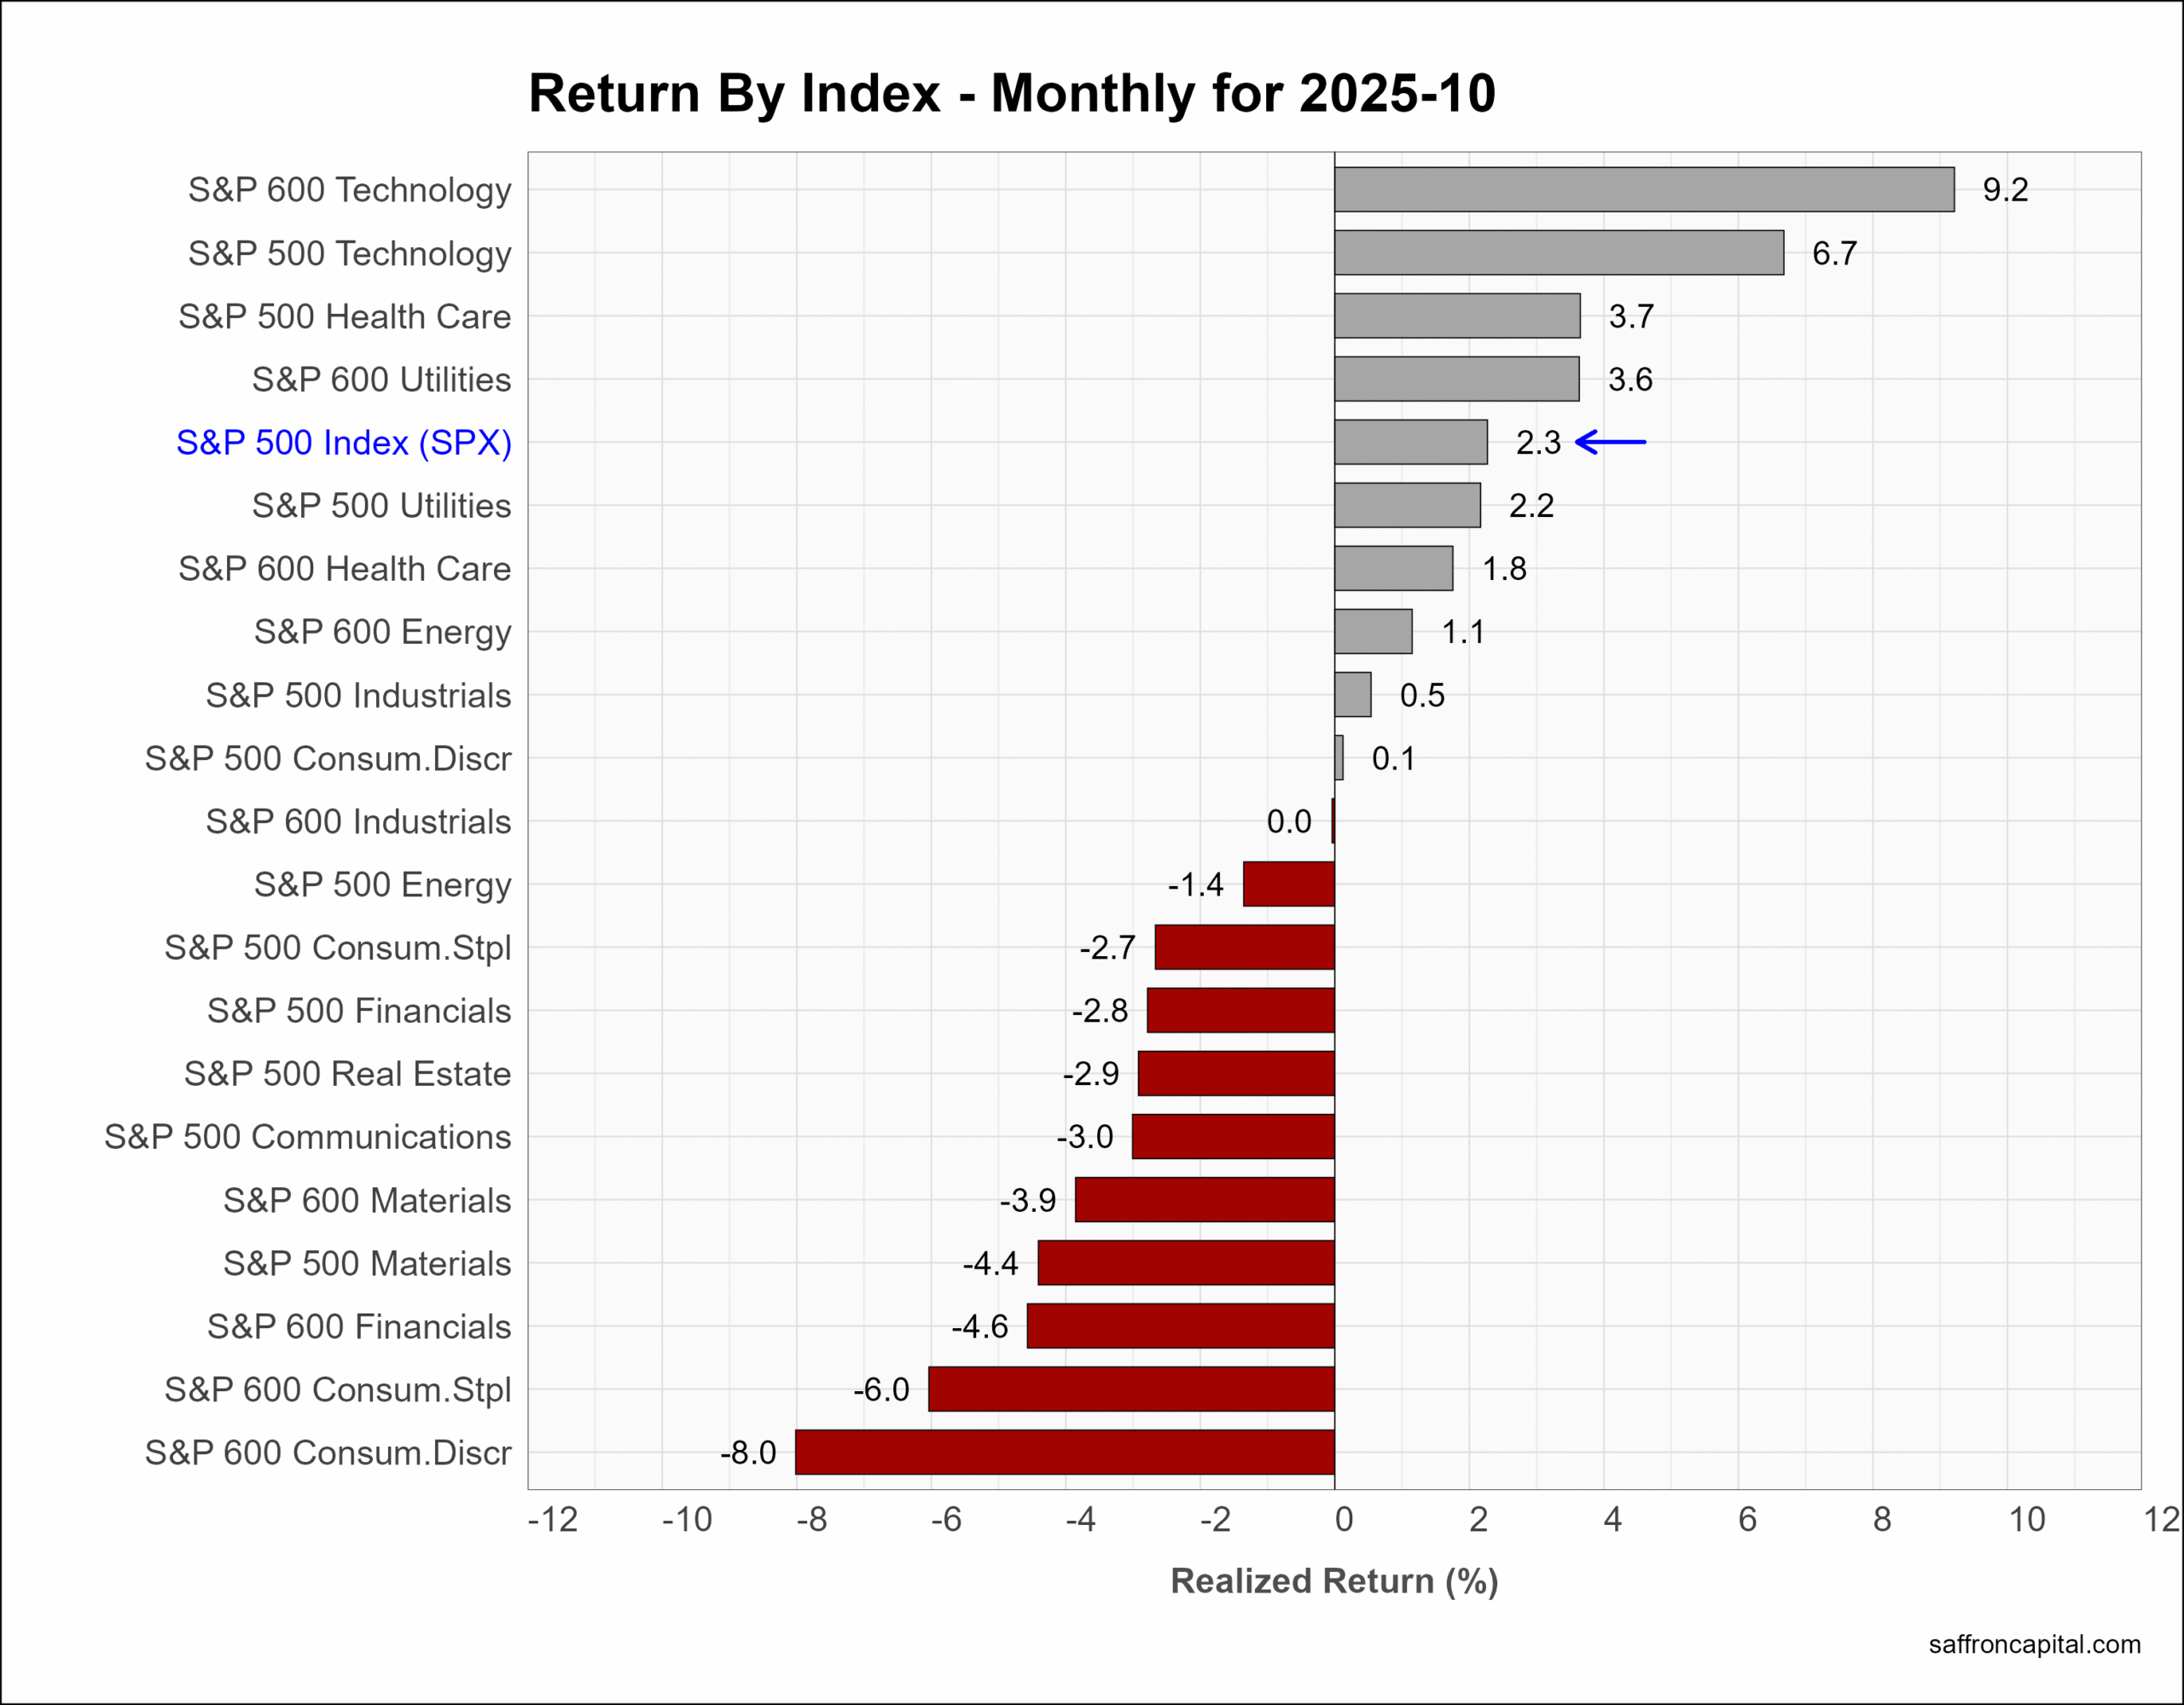
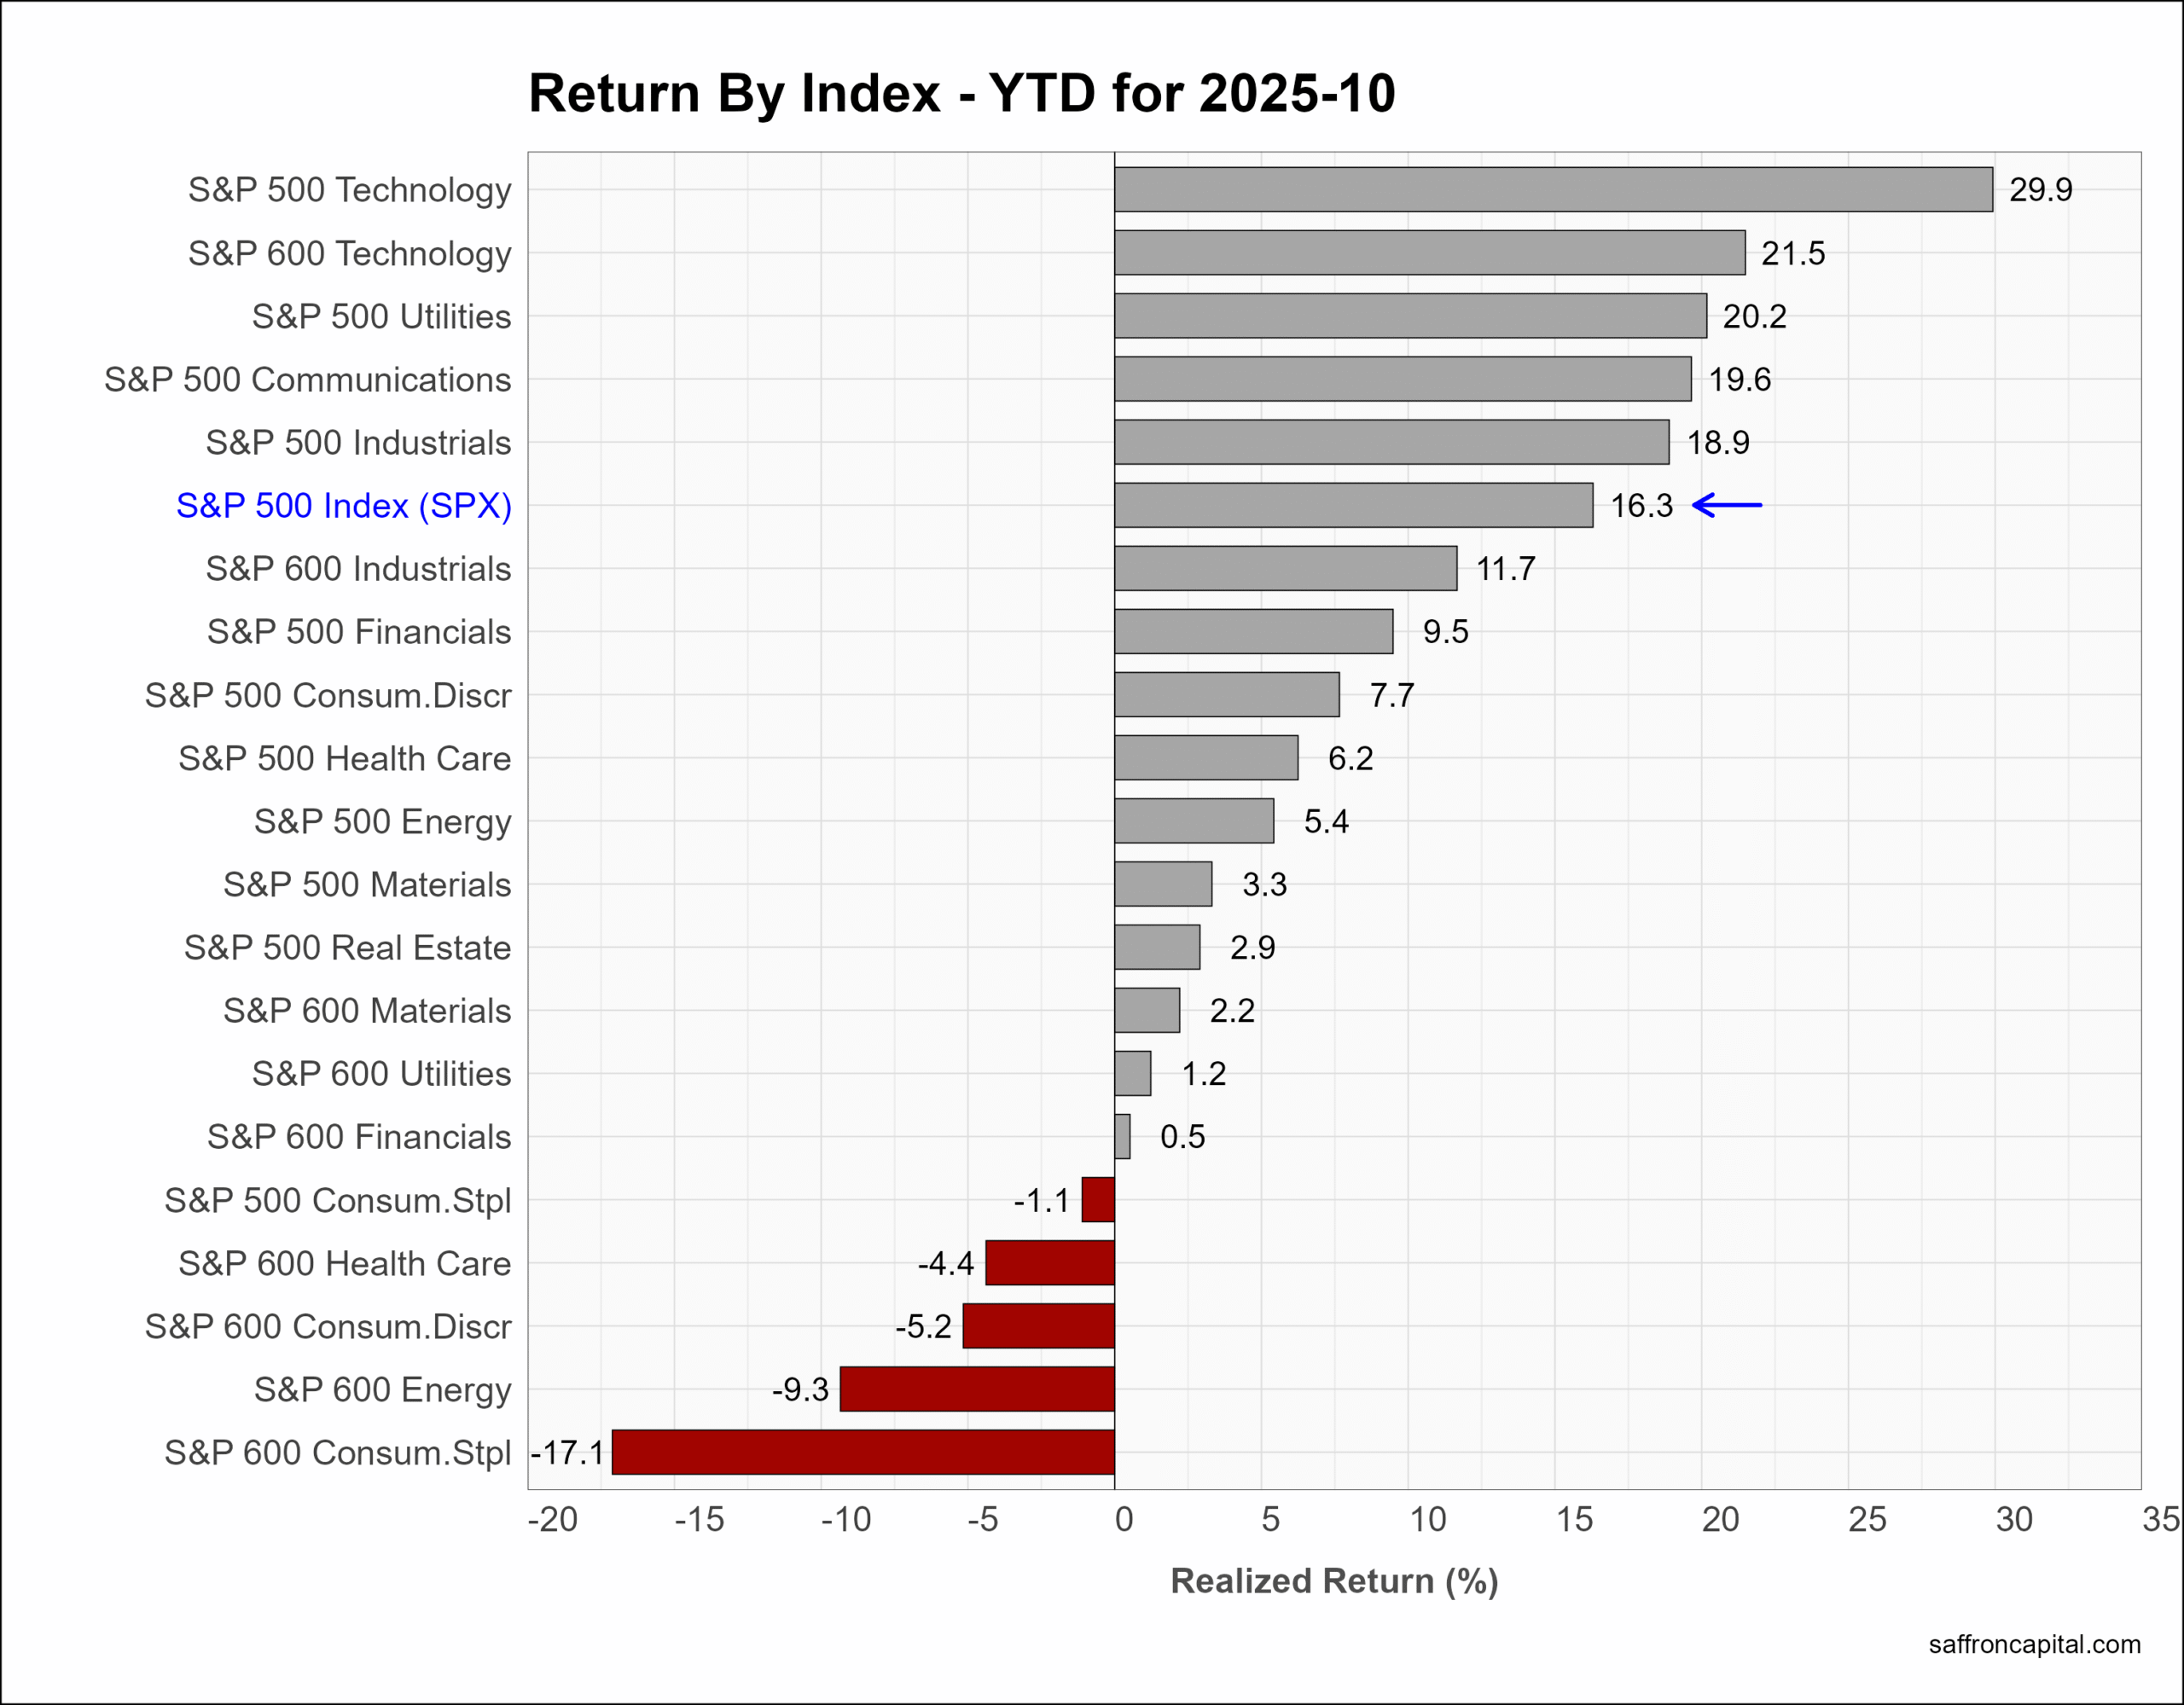
US Sector Indices
October returns saw sector rotations into large cap Technology (+6.7%), Health care (+3.7%), and Utilities (+2.2%). Top laggards were Consumer Staples (-6.0%), Communication (-3.0%), and Real Estate (-2.9%). Year-to-date, the top returns are with large cap Technology (+29.9%), Utilities (+20.2%), and Communication Services (+19.6%). Companies responsible for Consumer Staples (-17.1%) are struggling.
Click to enlarge
US Factor Indices
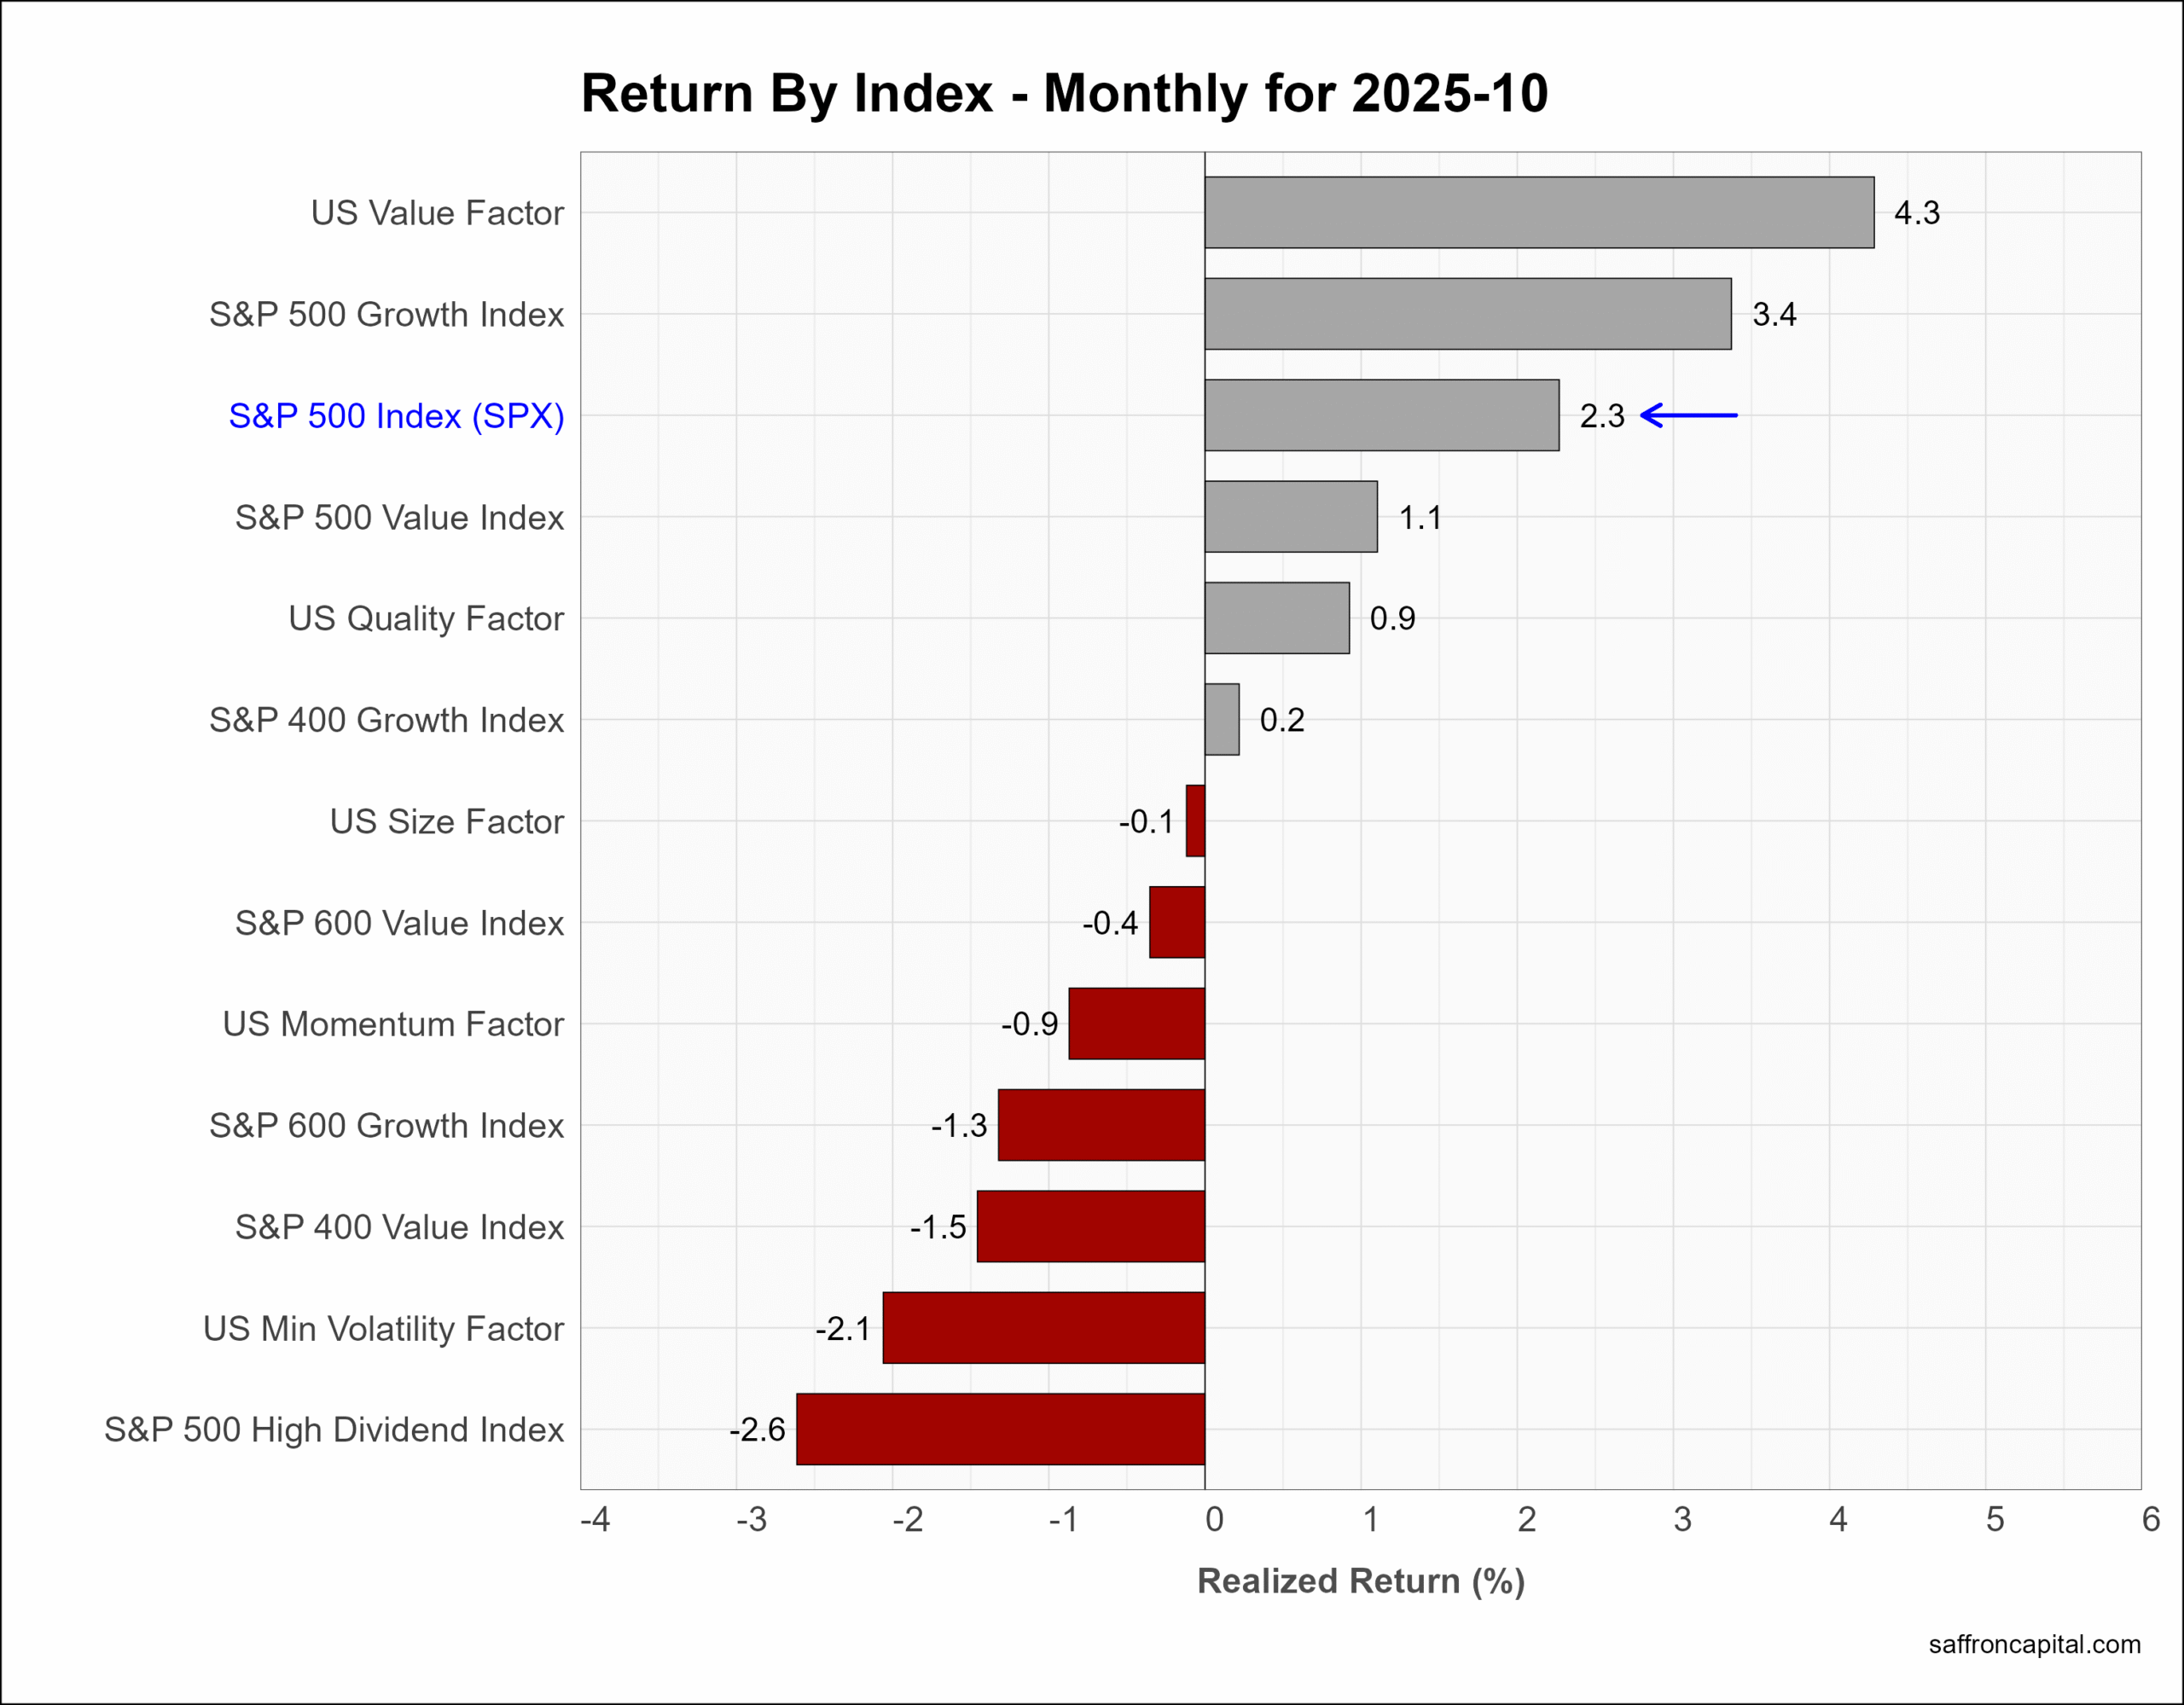
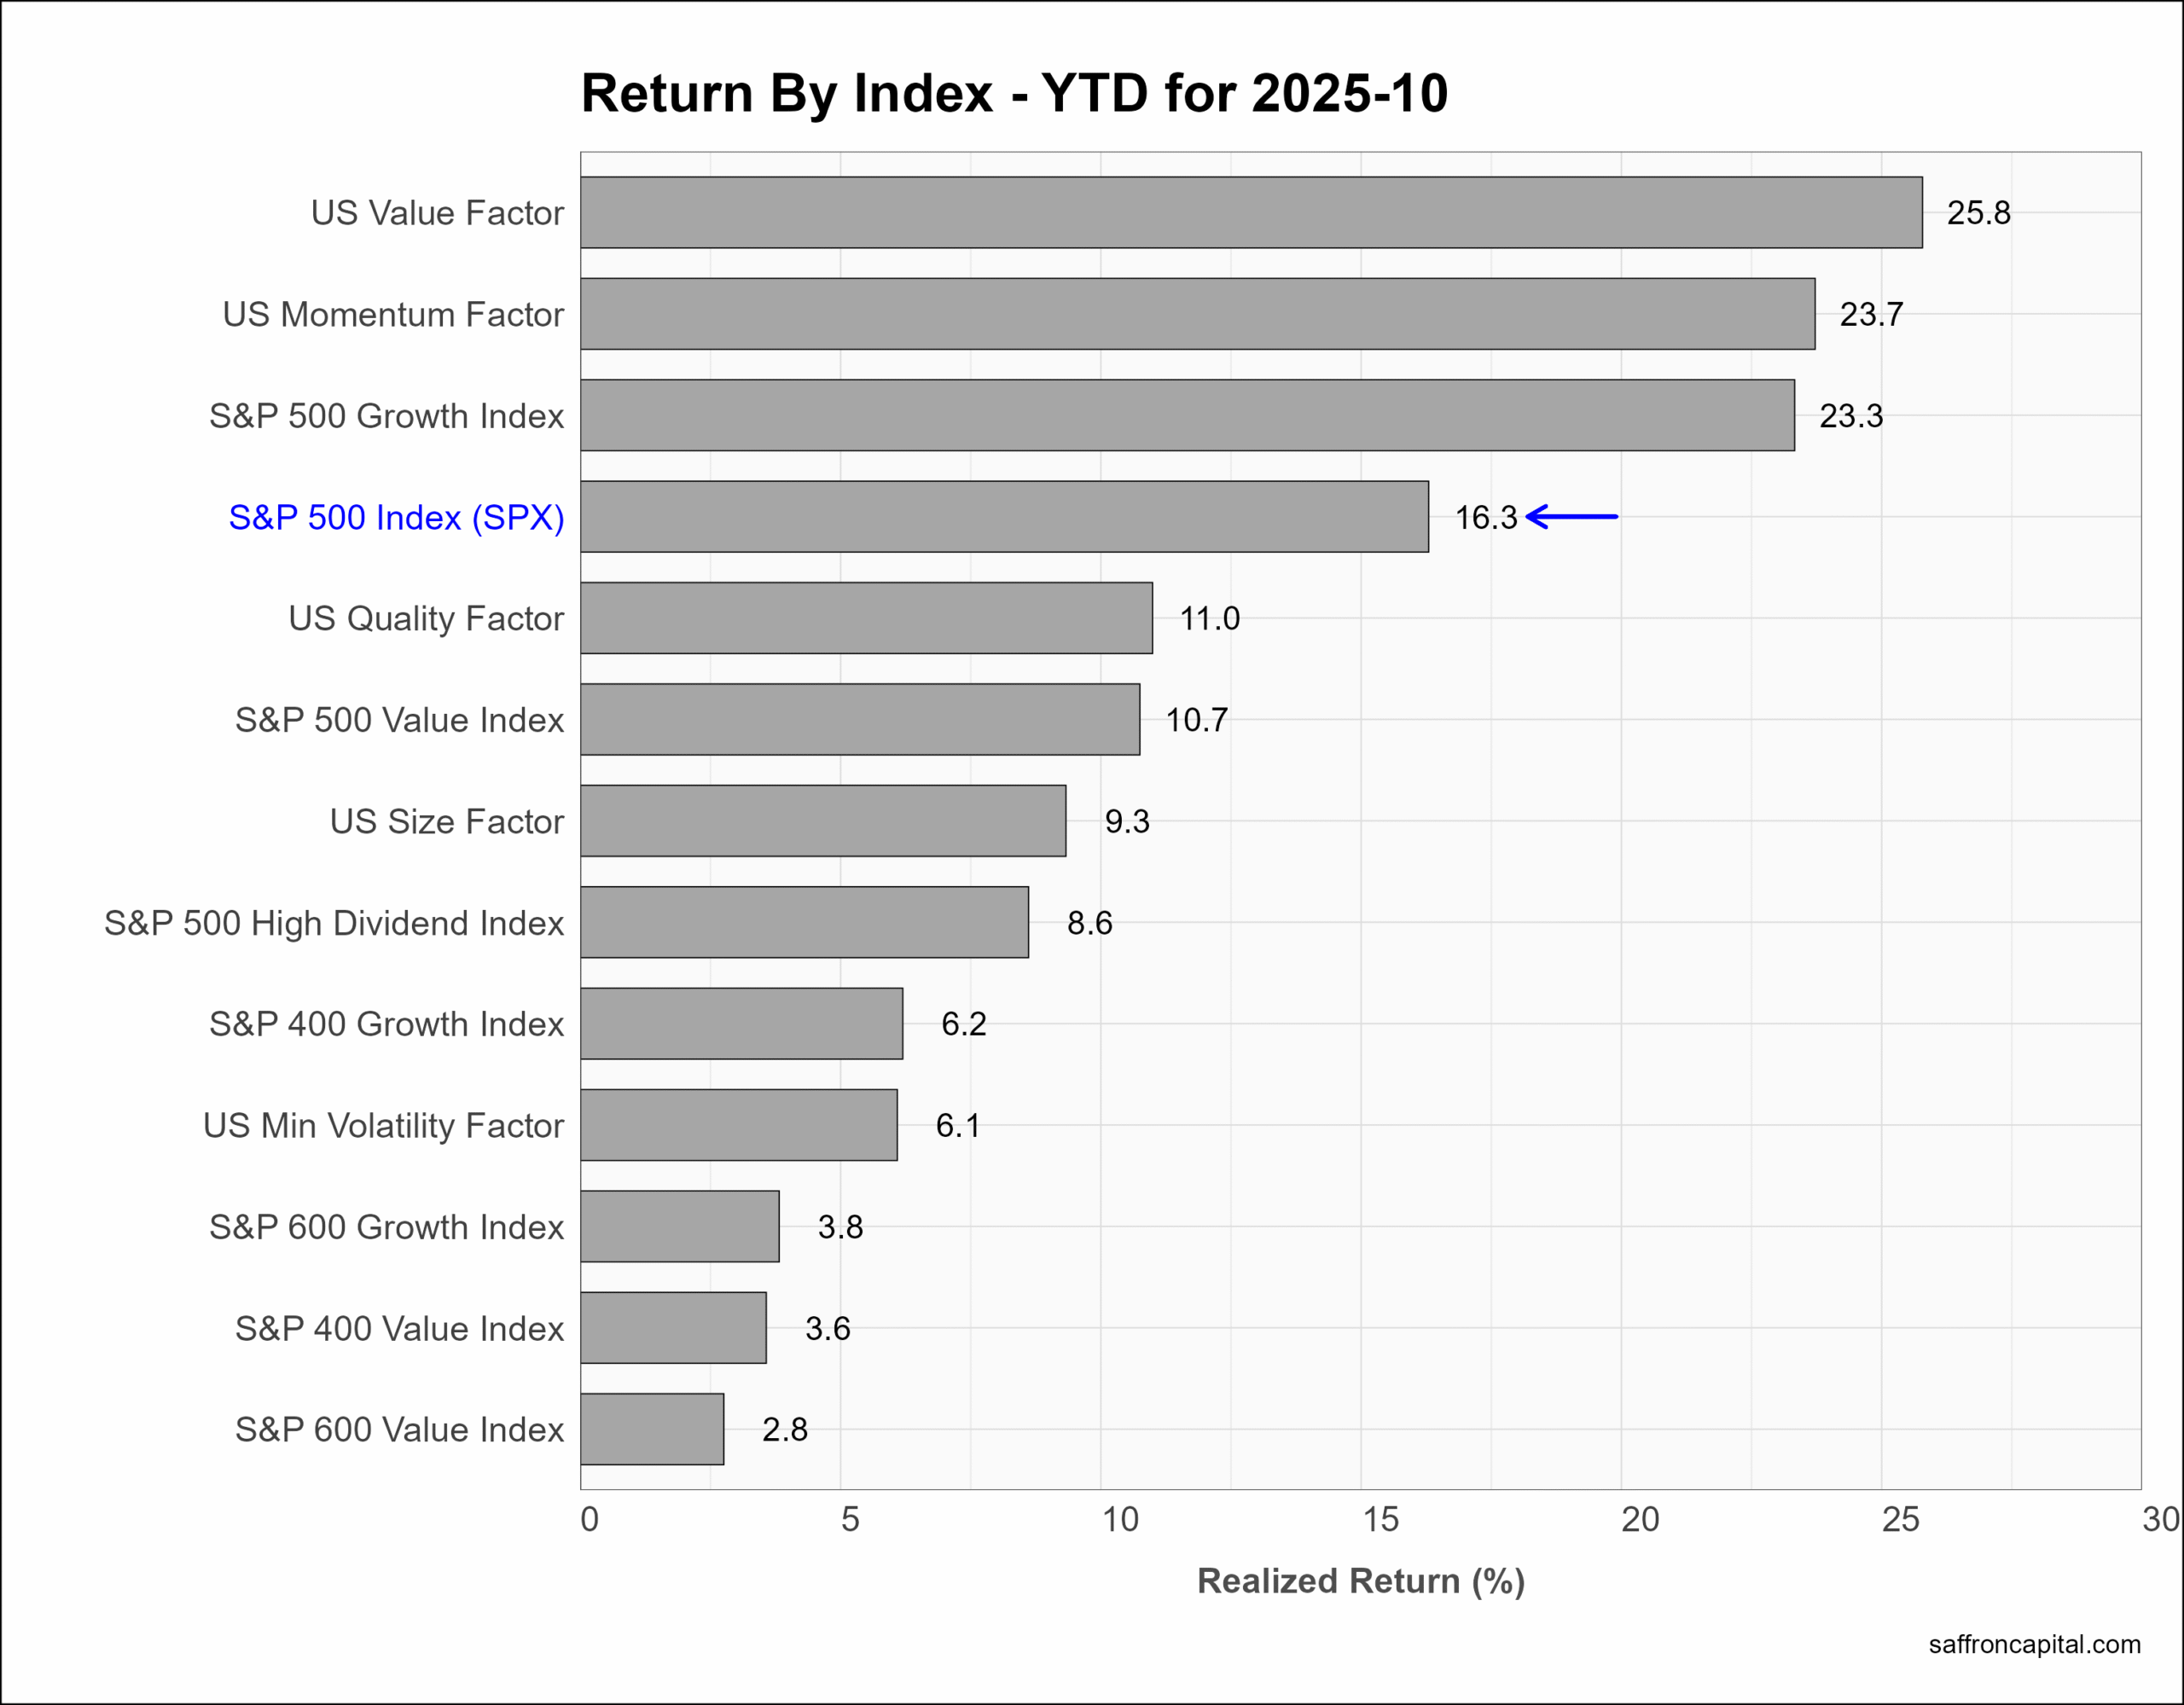
Factor portfolios are constructed to focus on the core drivers behind returns, including company size, value, profitability, growth, and momentum. Multi-factor portfolios combine two or more factors. In October, the top performing factor portfolios were Value (+4.3%) and Growth (3.4%). The Momentum portfolio (-0.9%) was weak, as were Minimum Volatility (-2.1%) and High Dividend (-2.6%) shares. Year-to-date, the factor portfolios with the strongest returns are Value (+25.6%), Momentum (+23.7%), and Growth (+23.3%). All three have outperformed the broader S&P 500 (+16.3%) Index.
Click to enlarge
US Thematic Portfolios
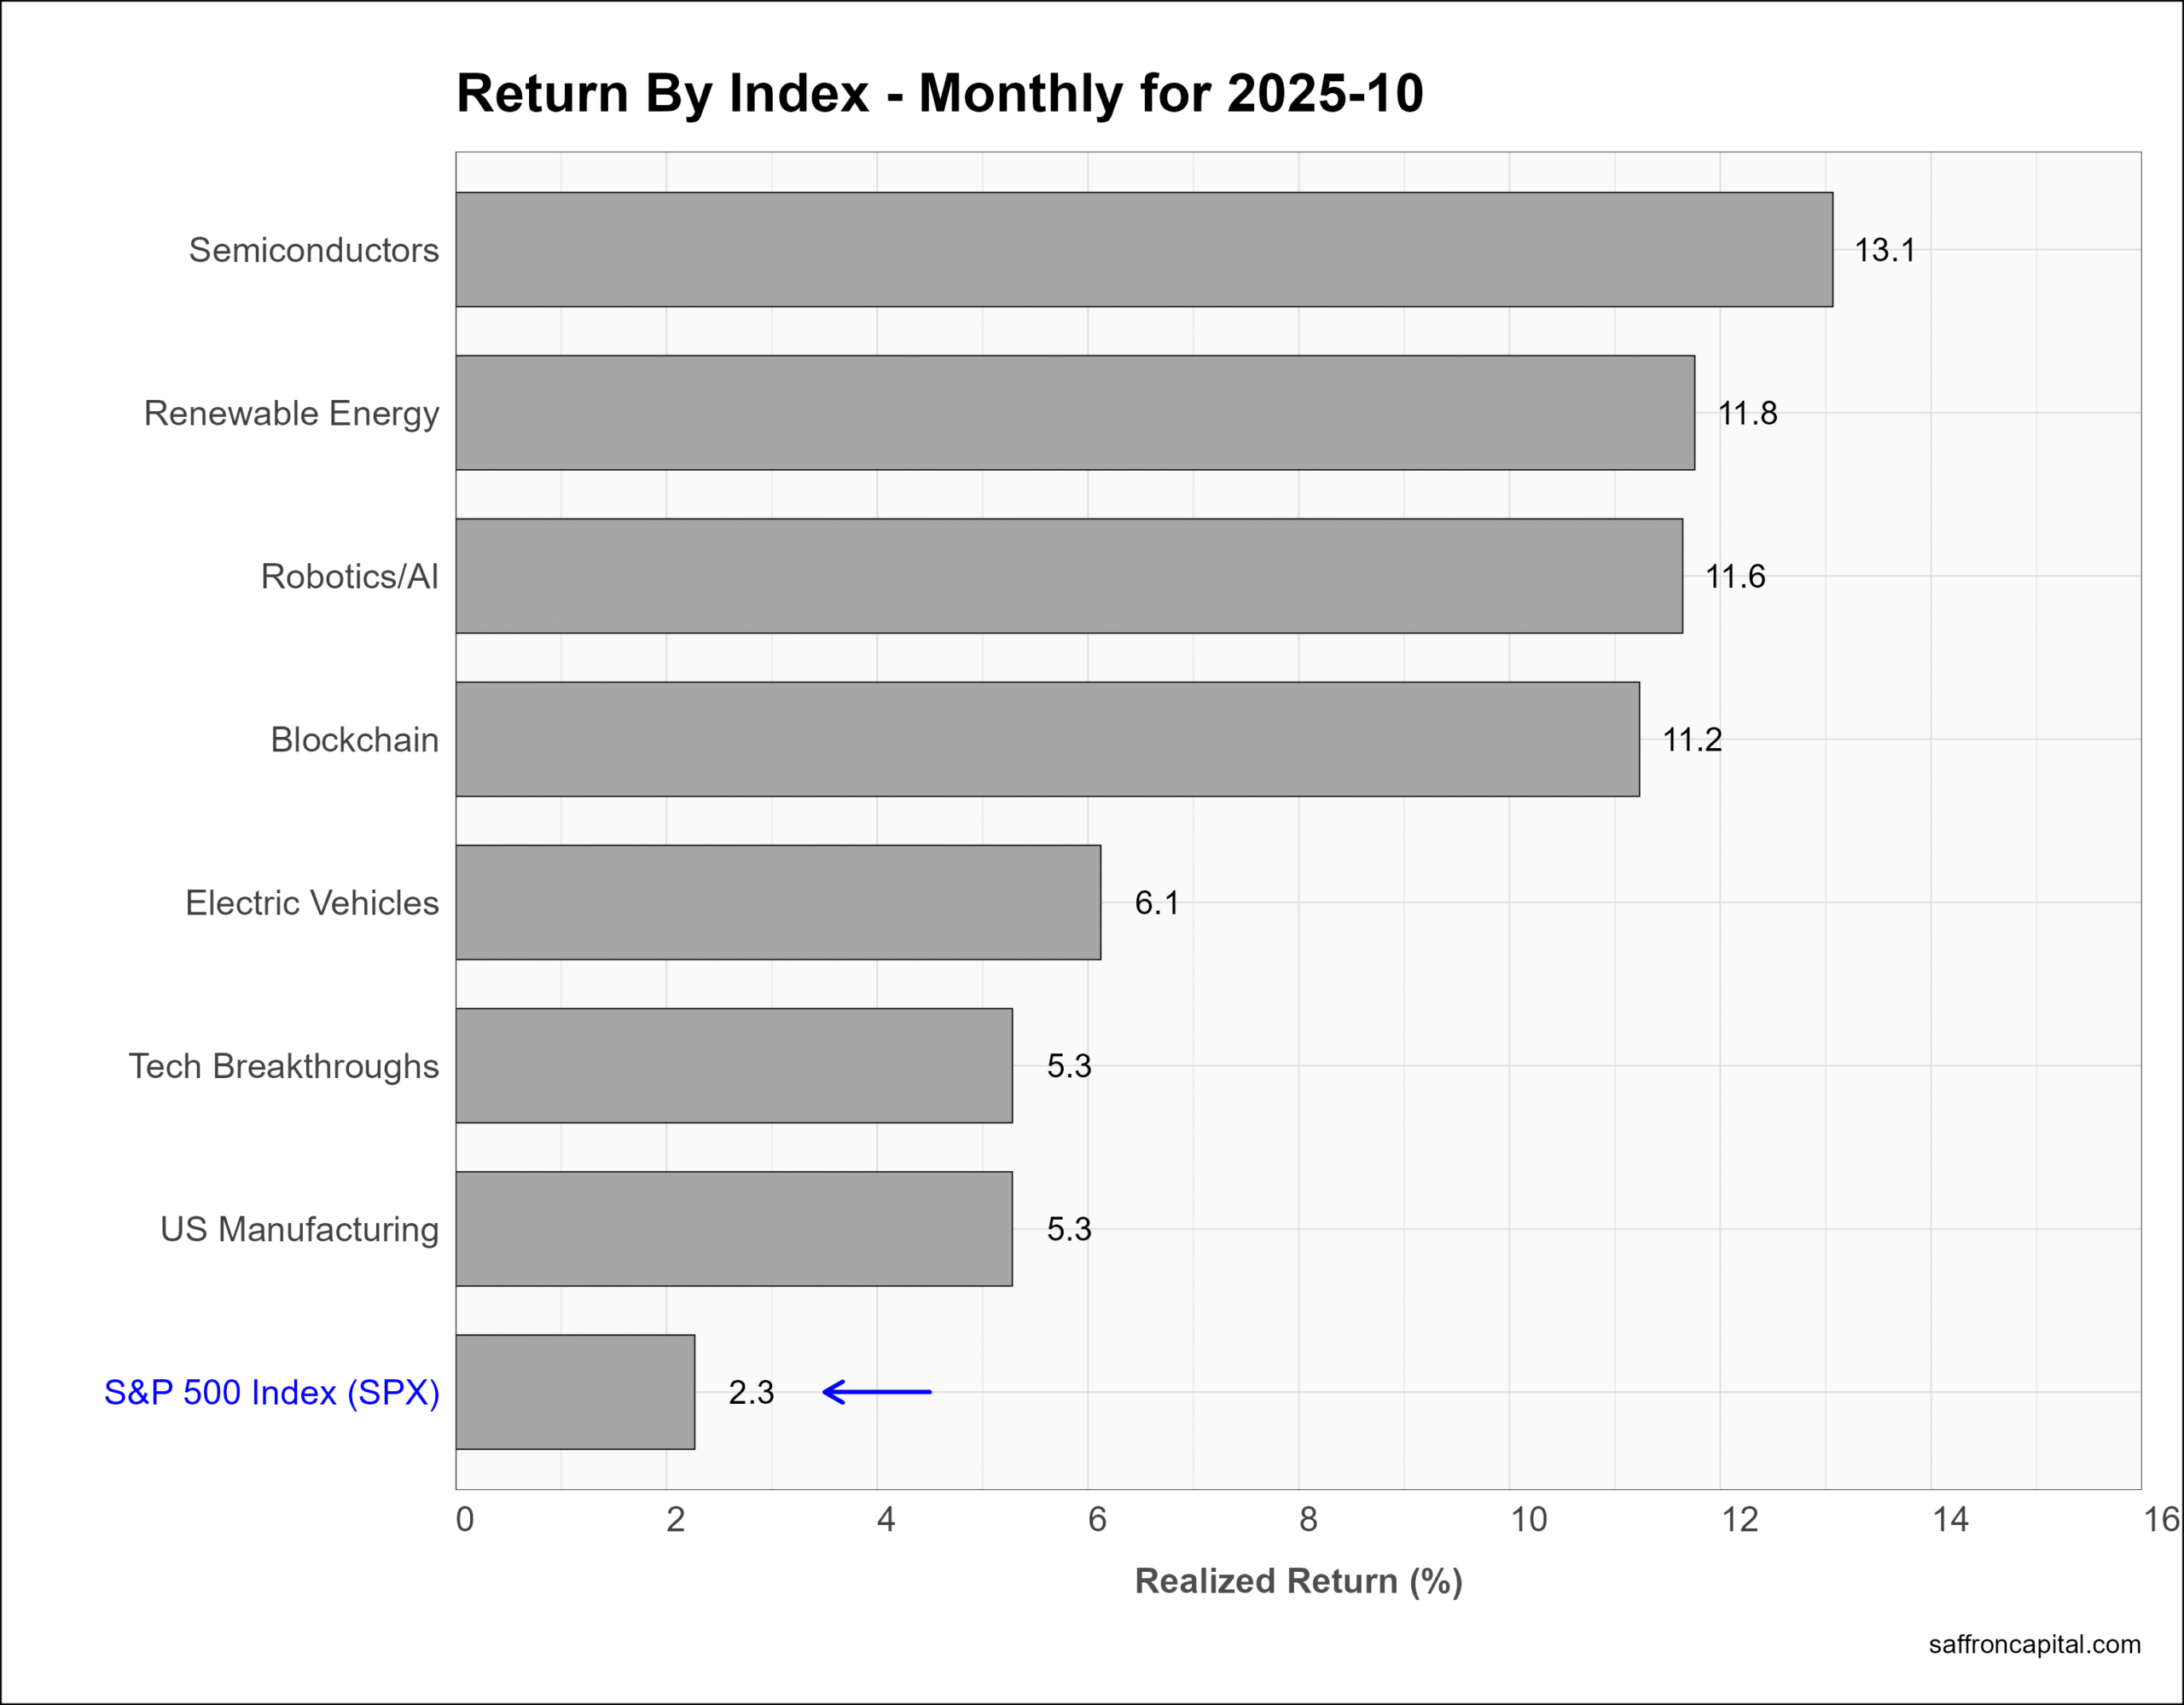
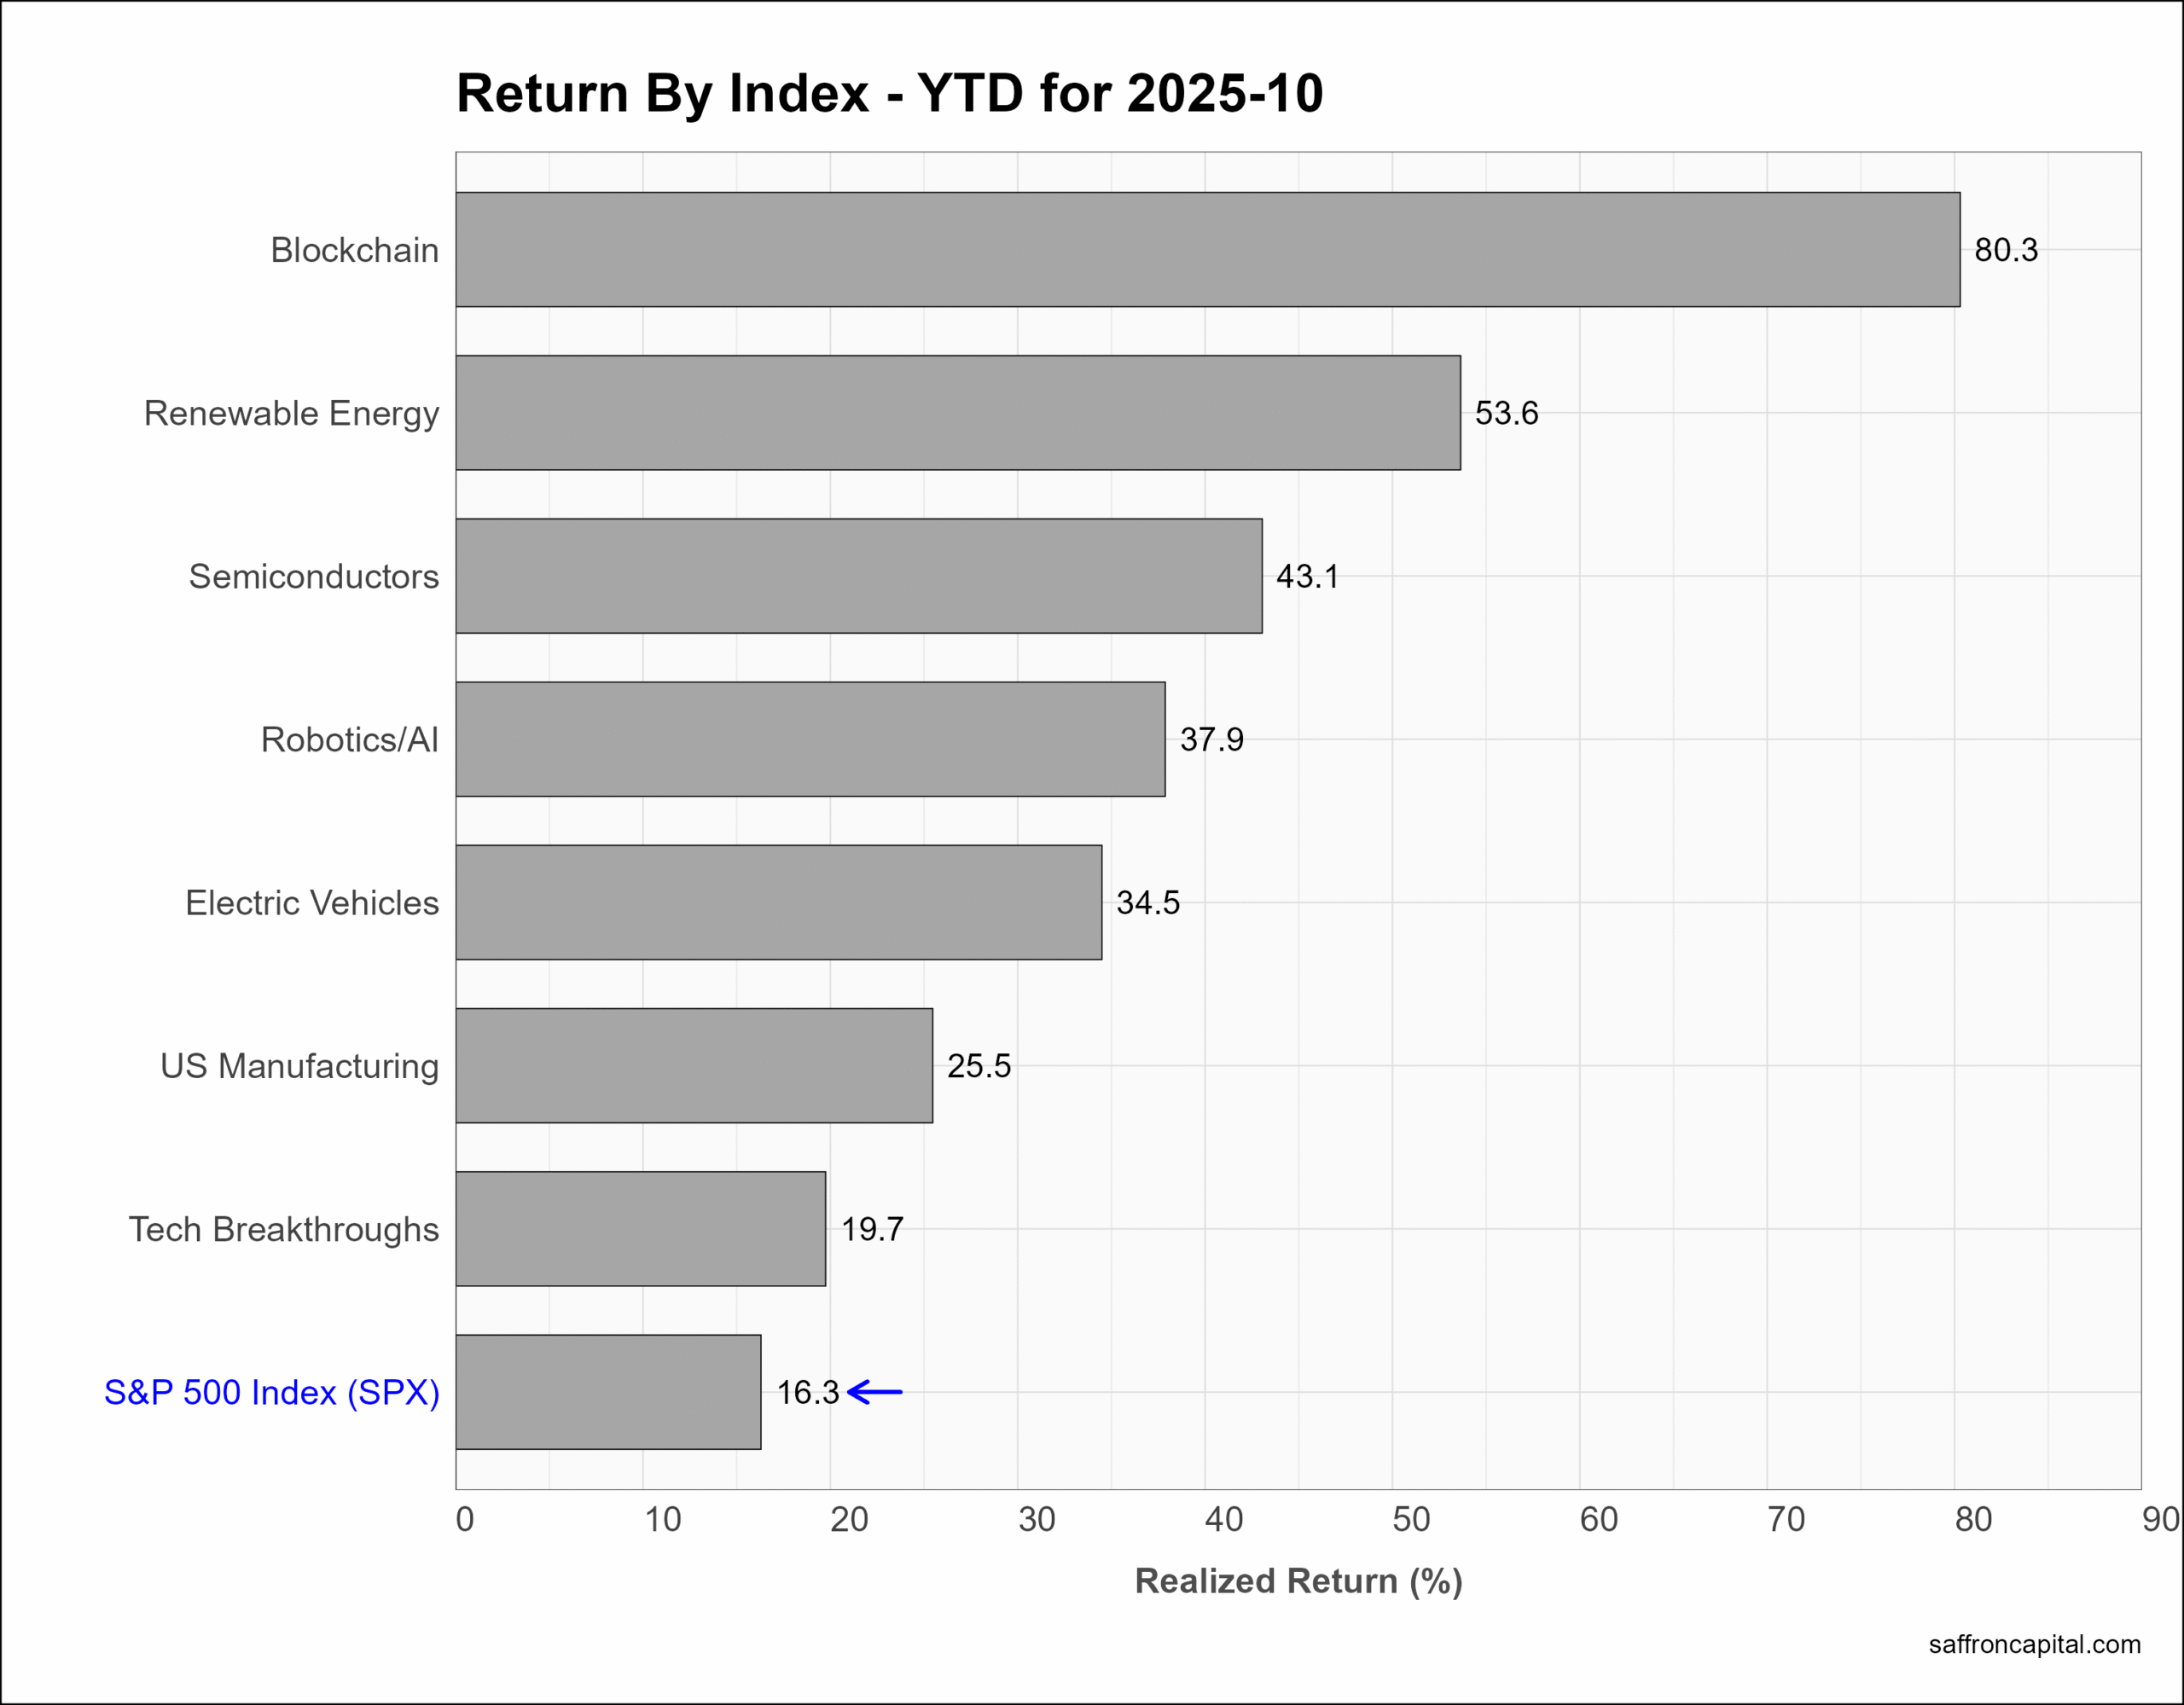
US thematic portfolios are company clusters or networks that represent primary growth trends of the U.S. economy. October returns were led by a Semiconductors (+13.1%), Renewable Energy (+11.78%), and Robotics/AI (+11.6%). Since January, all the thematic portfolios tracked are outperforming the S&P 500 index. The top spot goes to Blockchain shares (+80.3%), Renewable Energy (+53.6%), and Semiconductors (+43.1%).
Click to enlarge
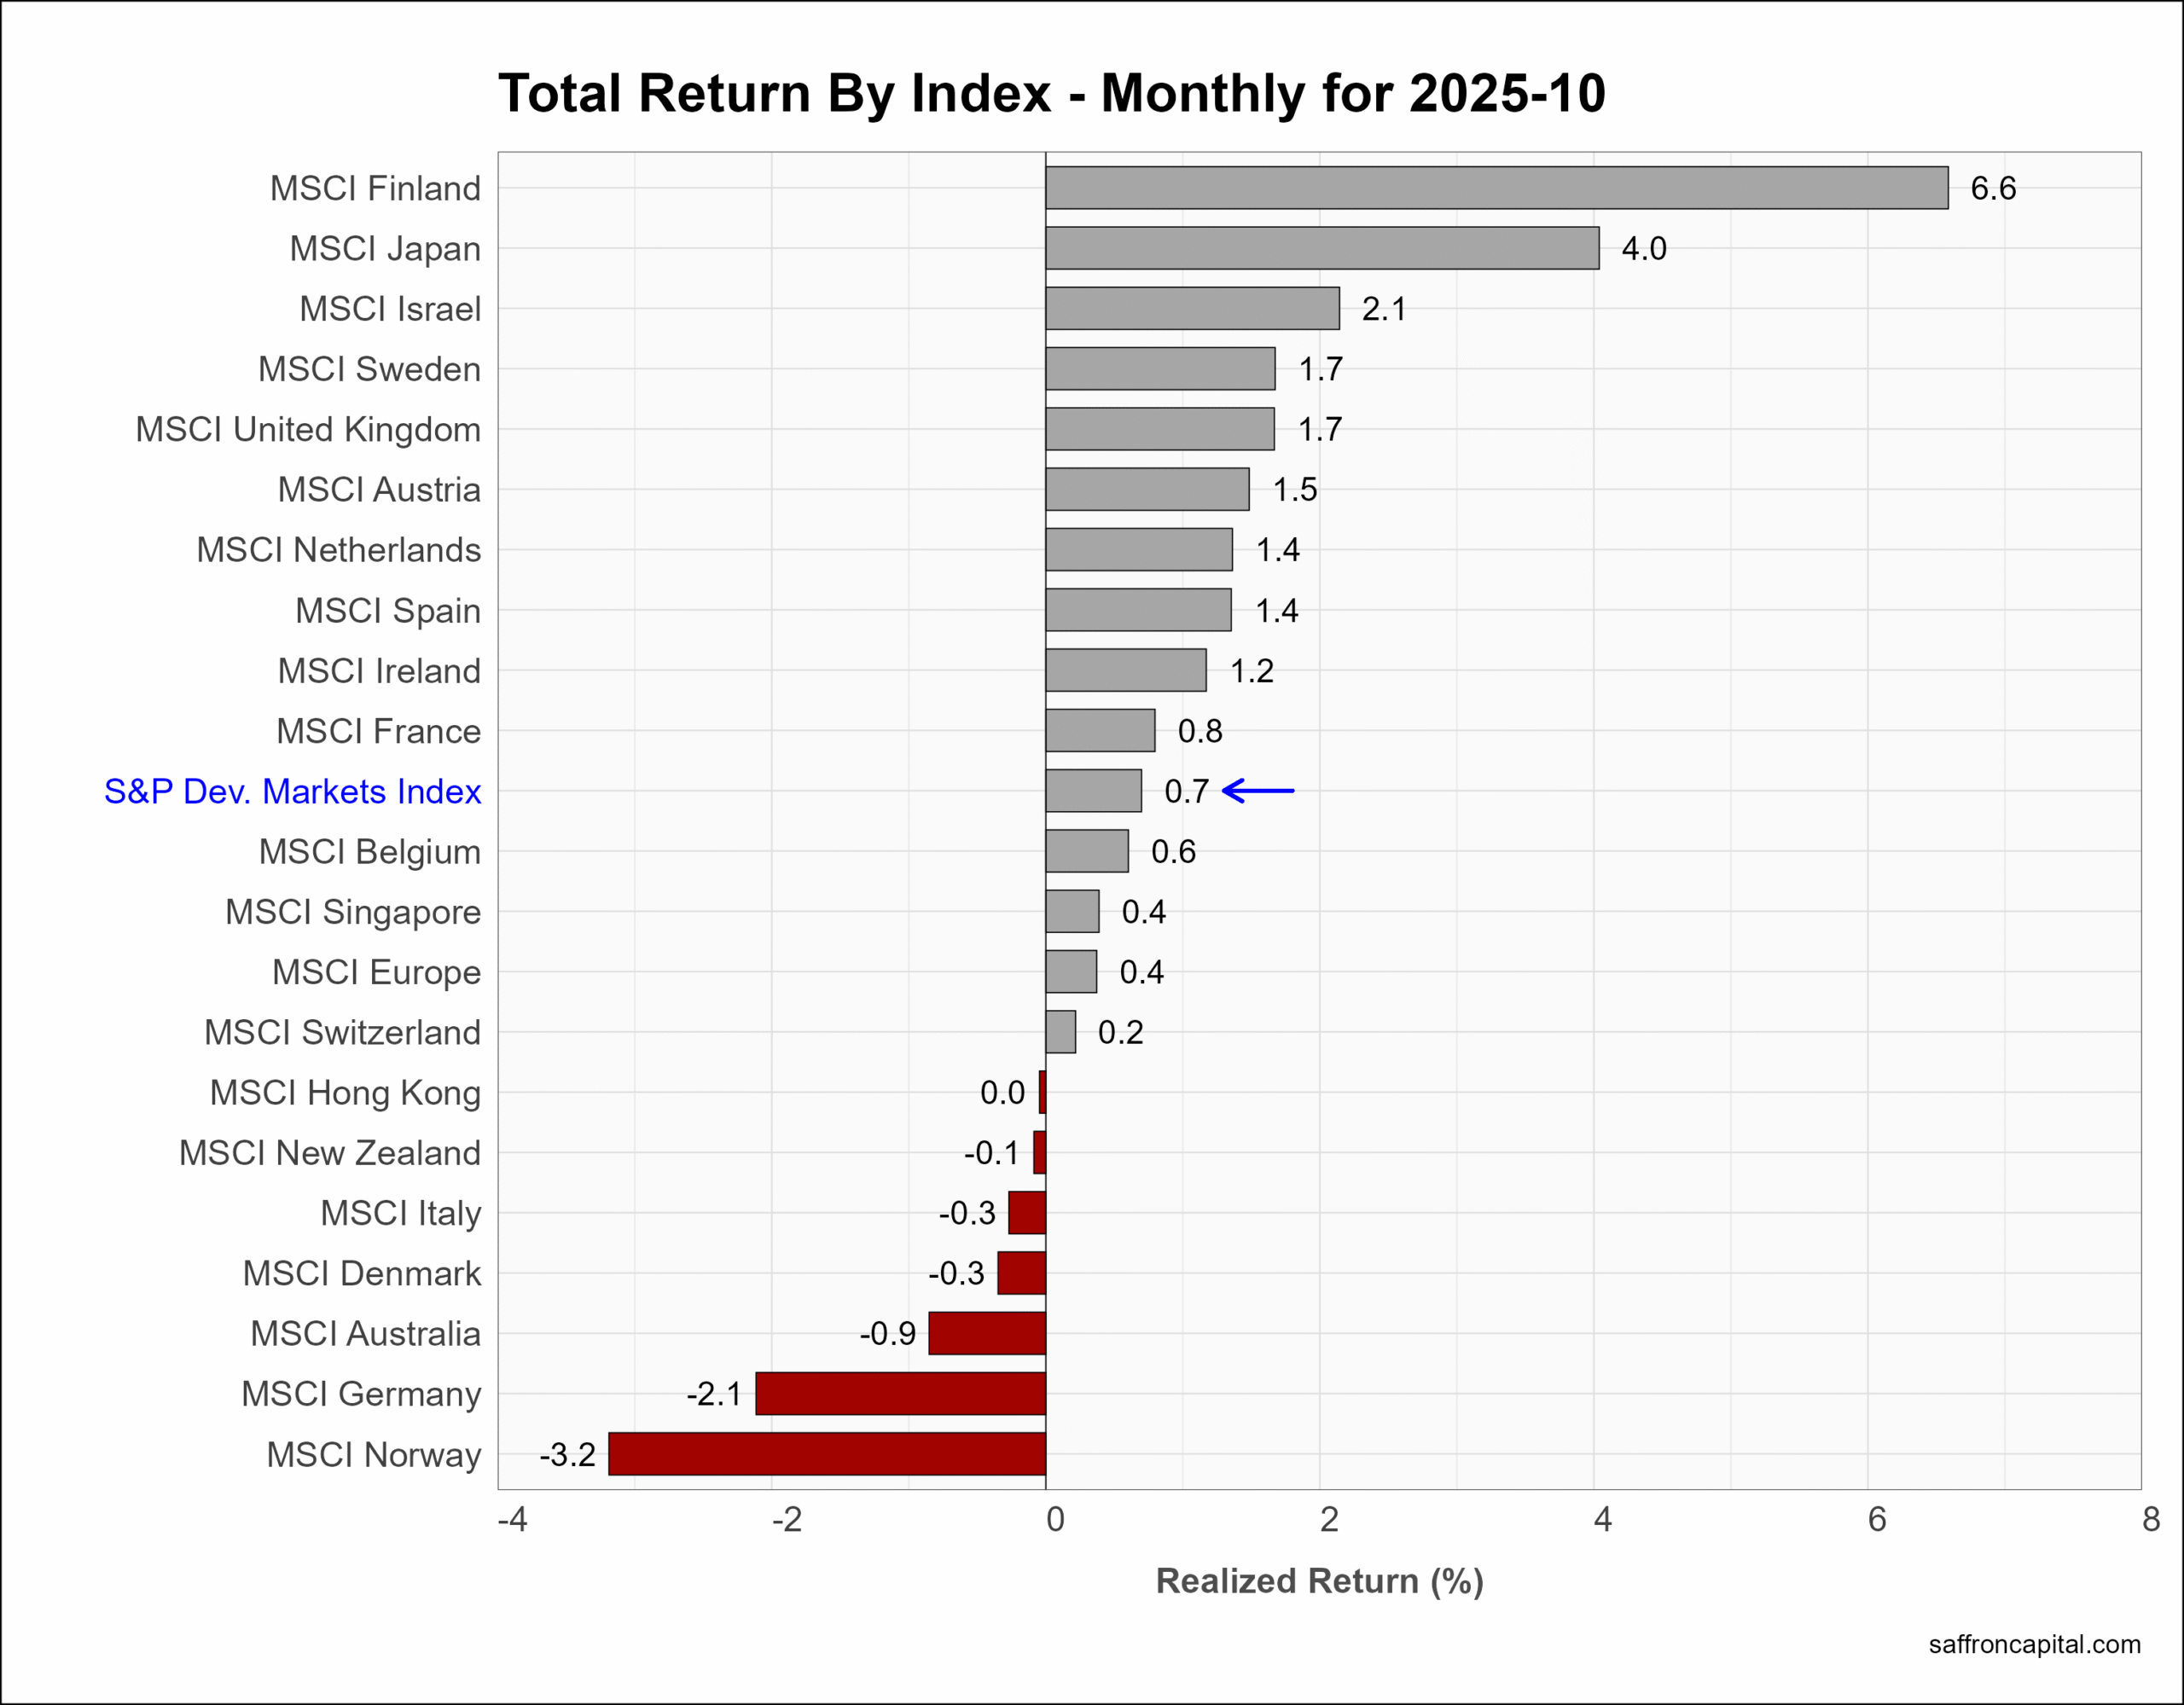
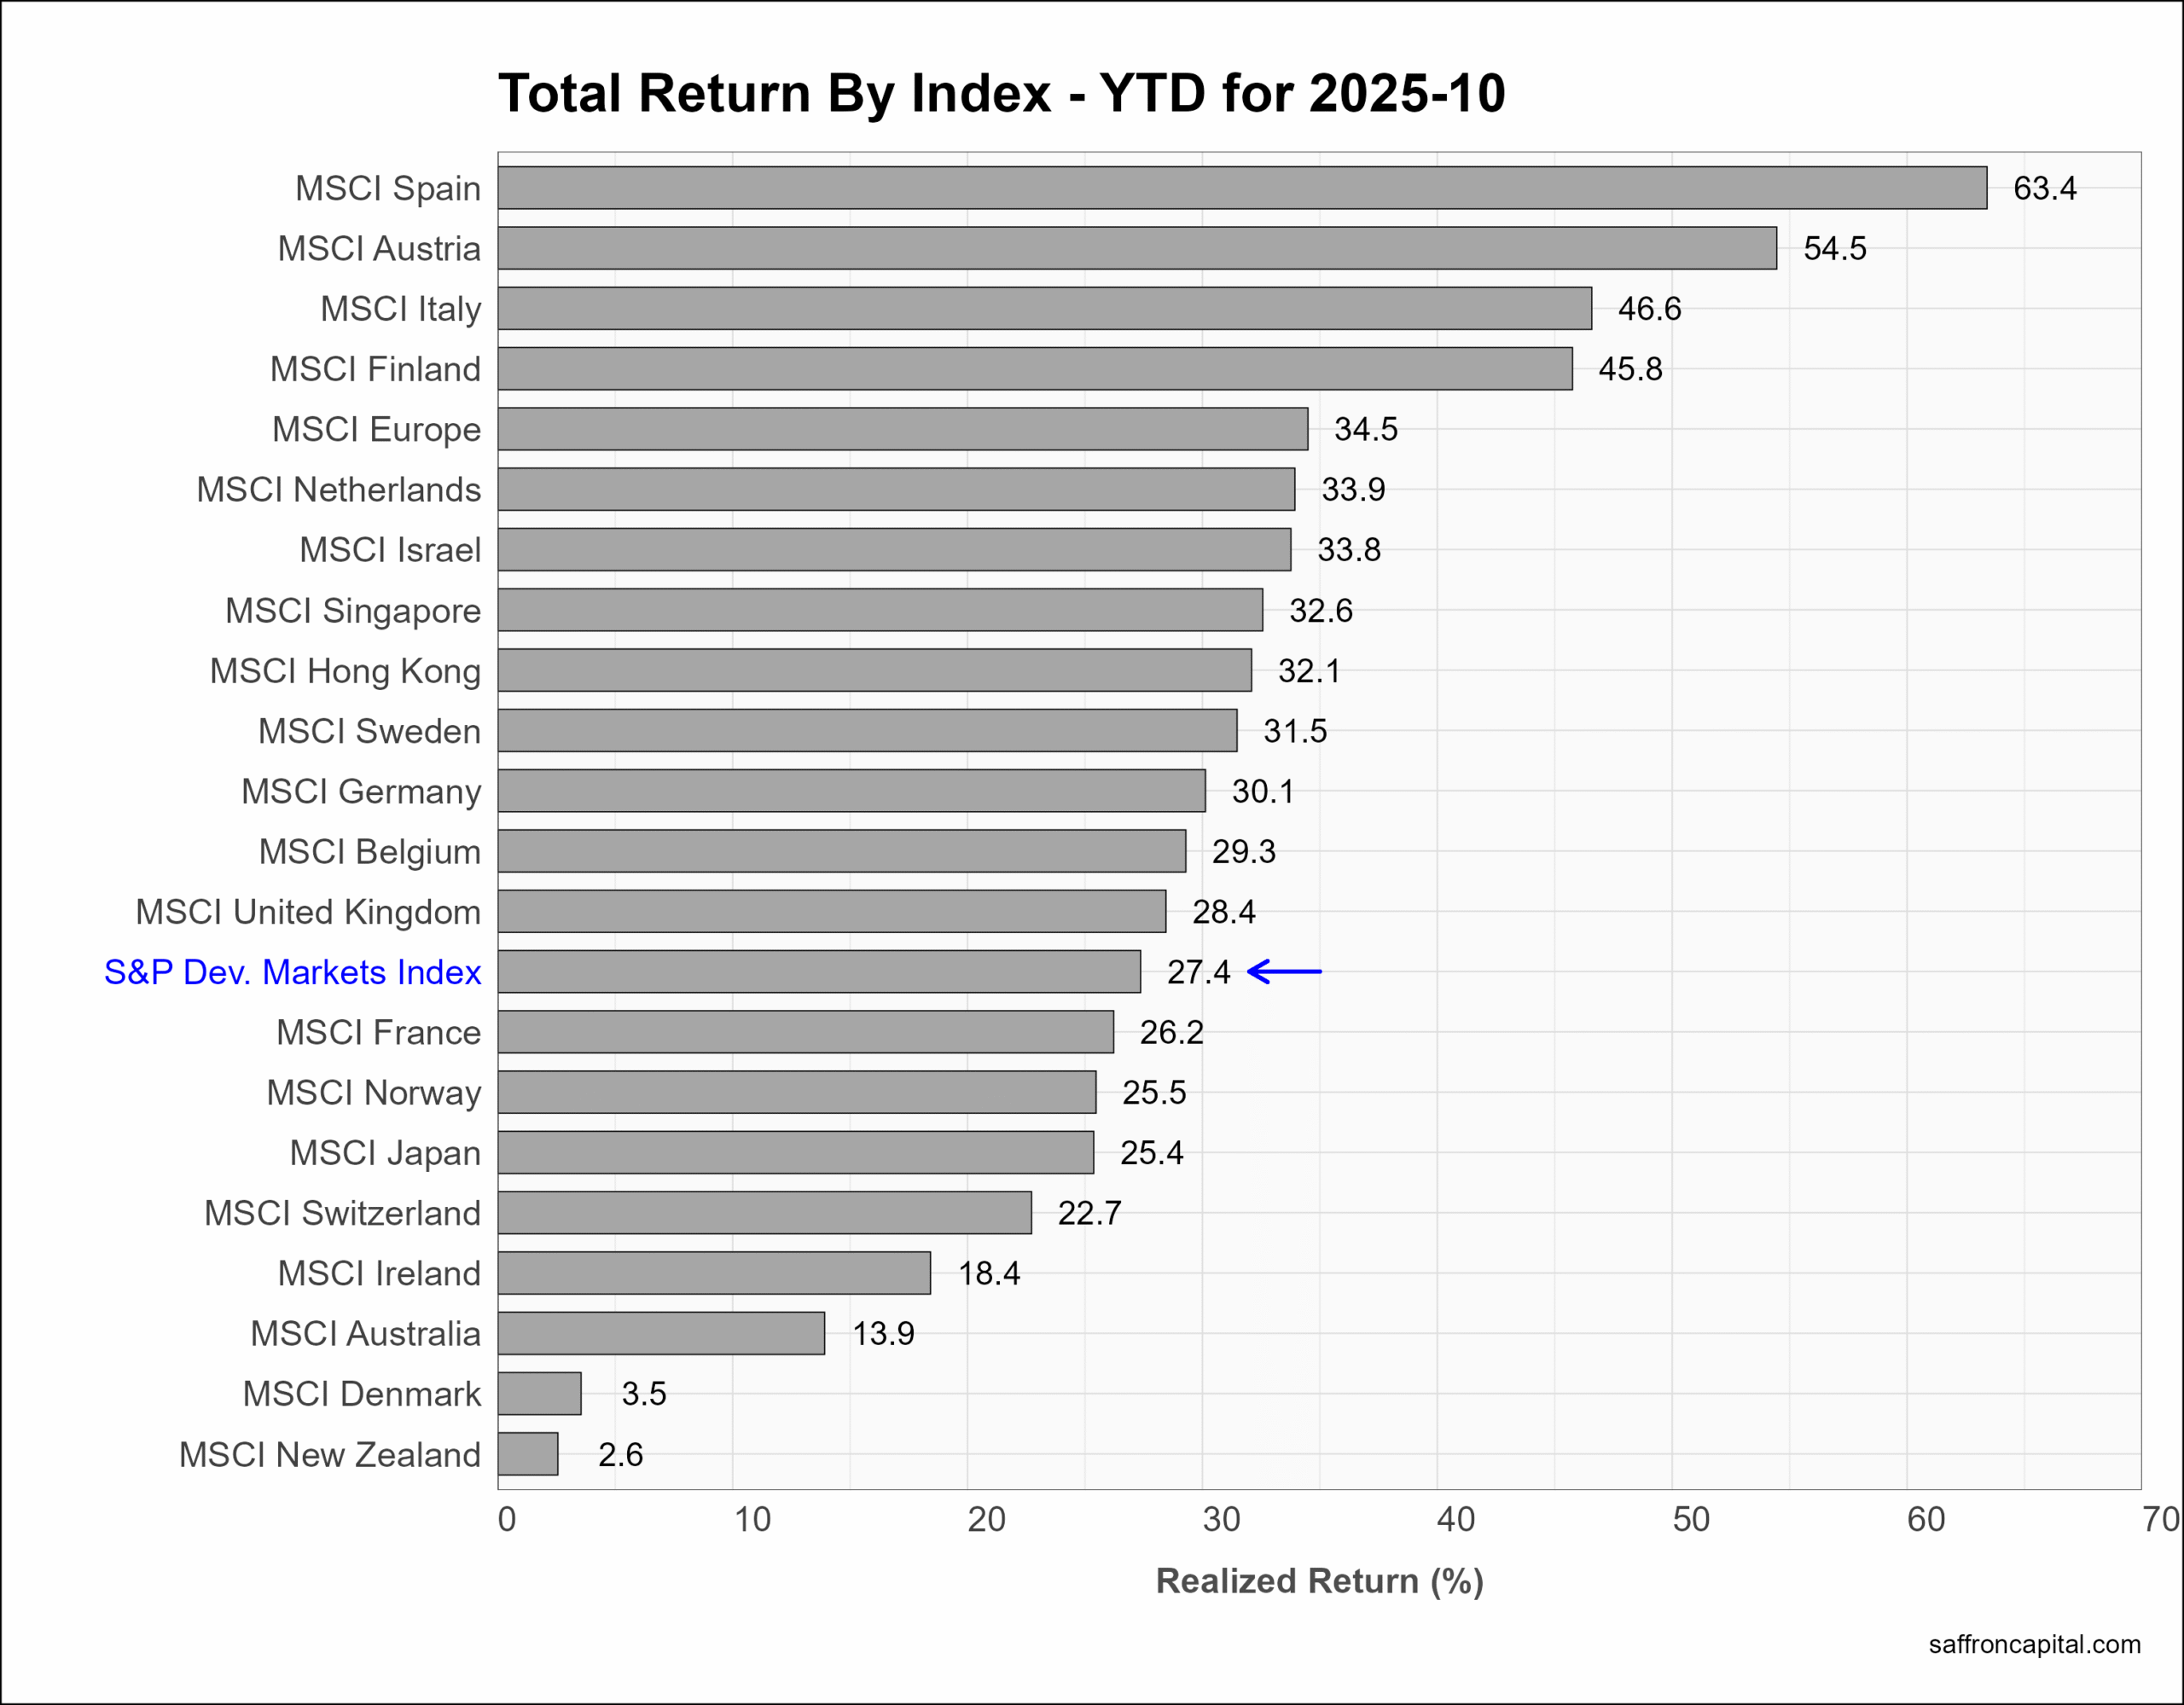
Developed Market Equities
The S&P Developed Markets index (+0.7%) lagged US benchmarks in October, but notable performance was seen in Finland (+6.6%), Japan (+4.0%), and Isreal (+2.1%). The MSCI Europe Index (+0.4%) was neutral-to-up, dragged down by Italy (-0.3%) and Germany (-2.1%). The best markets year-to-date include Spain (+63.4%), Austria (+54.5%), and Italy (+47.0%).
Click to enlarge
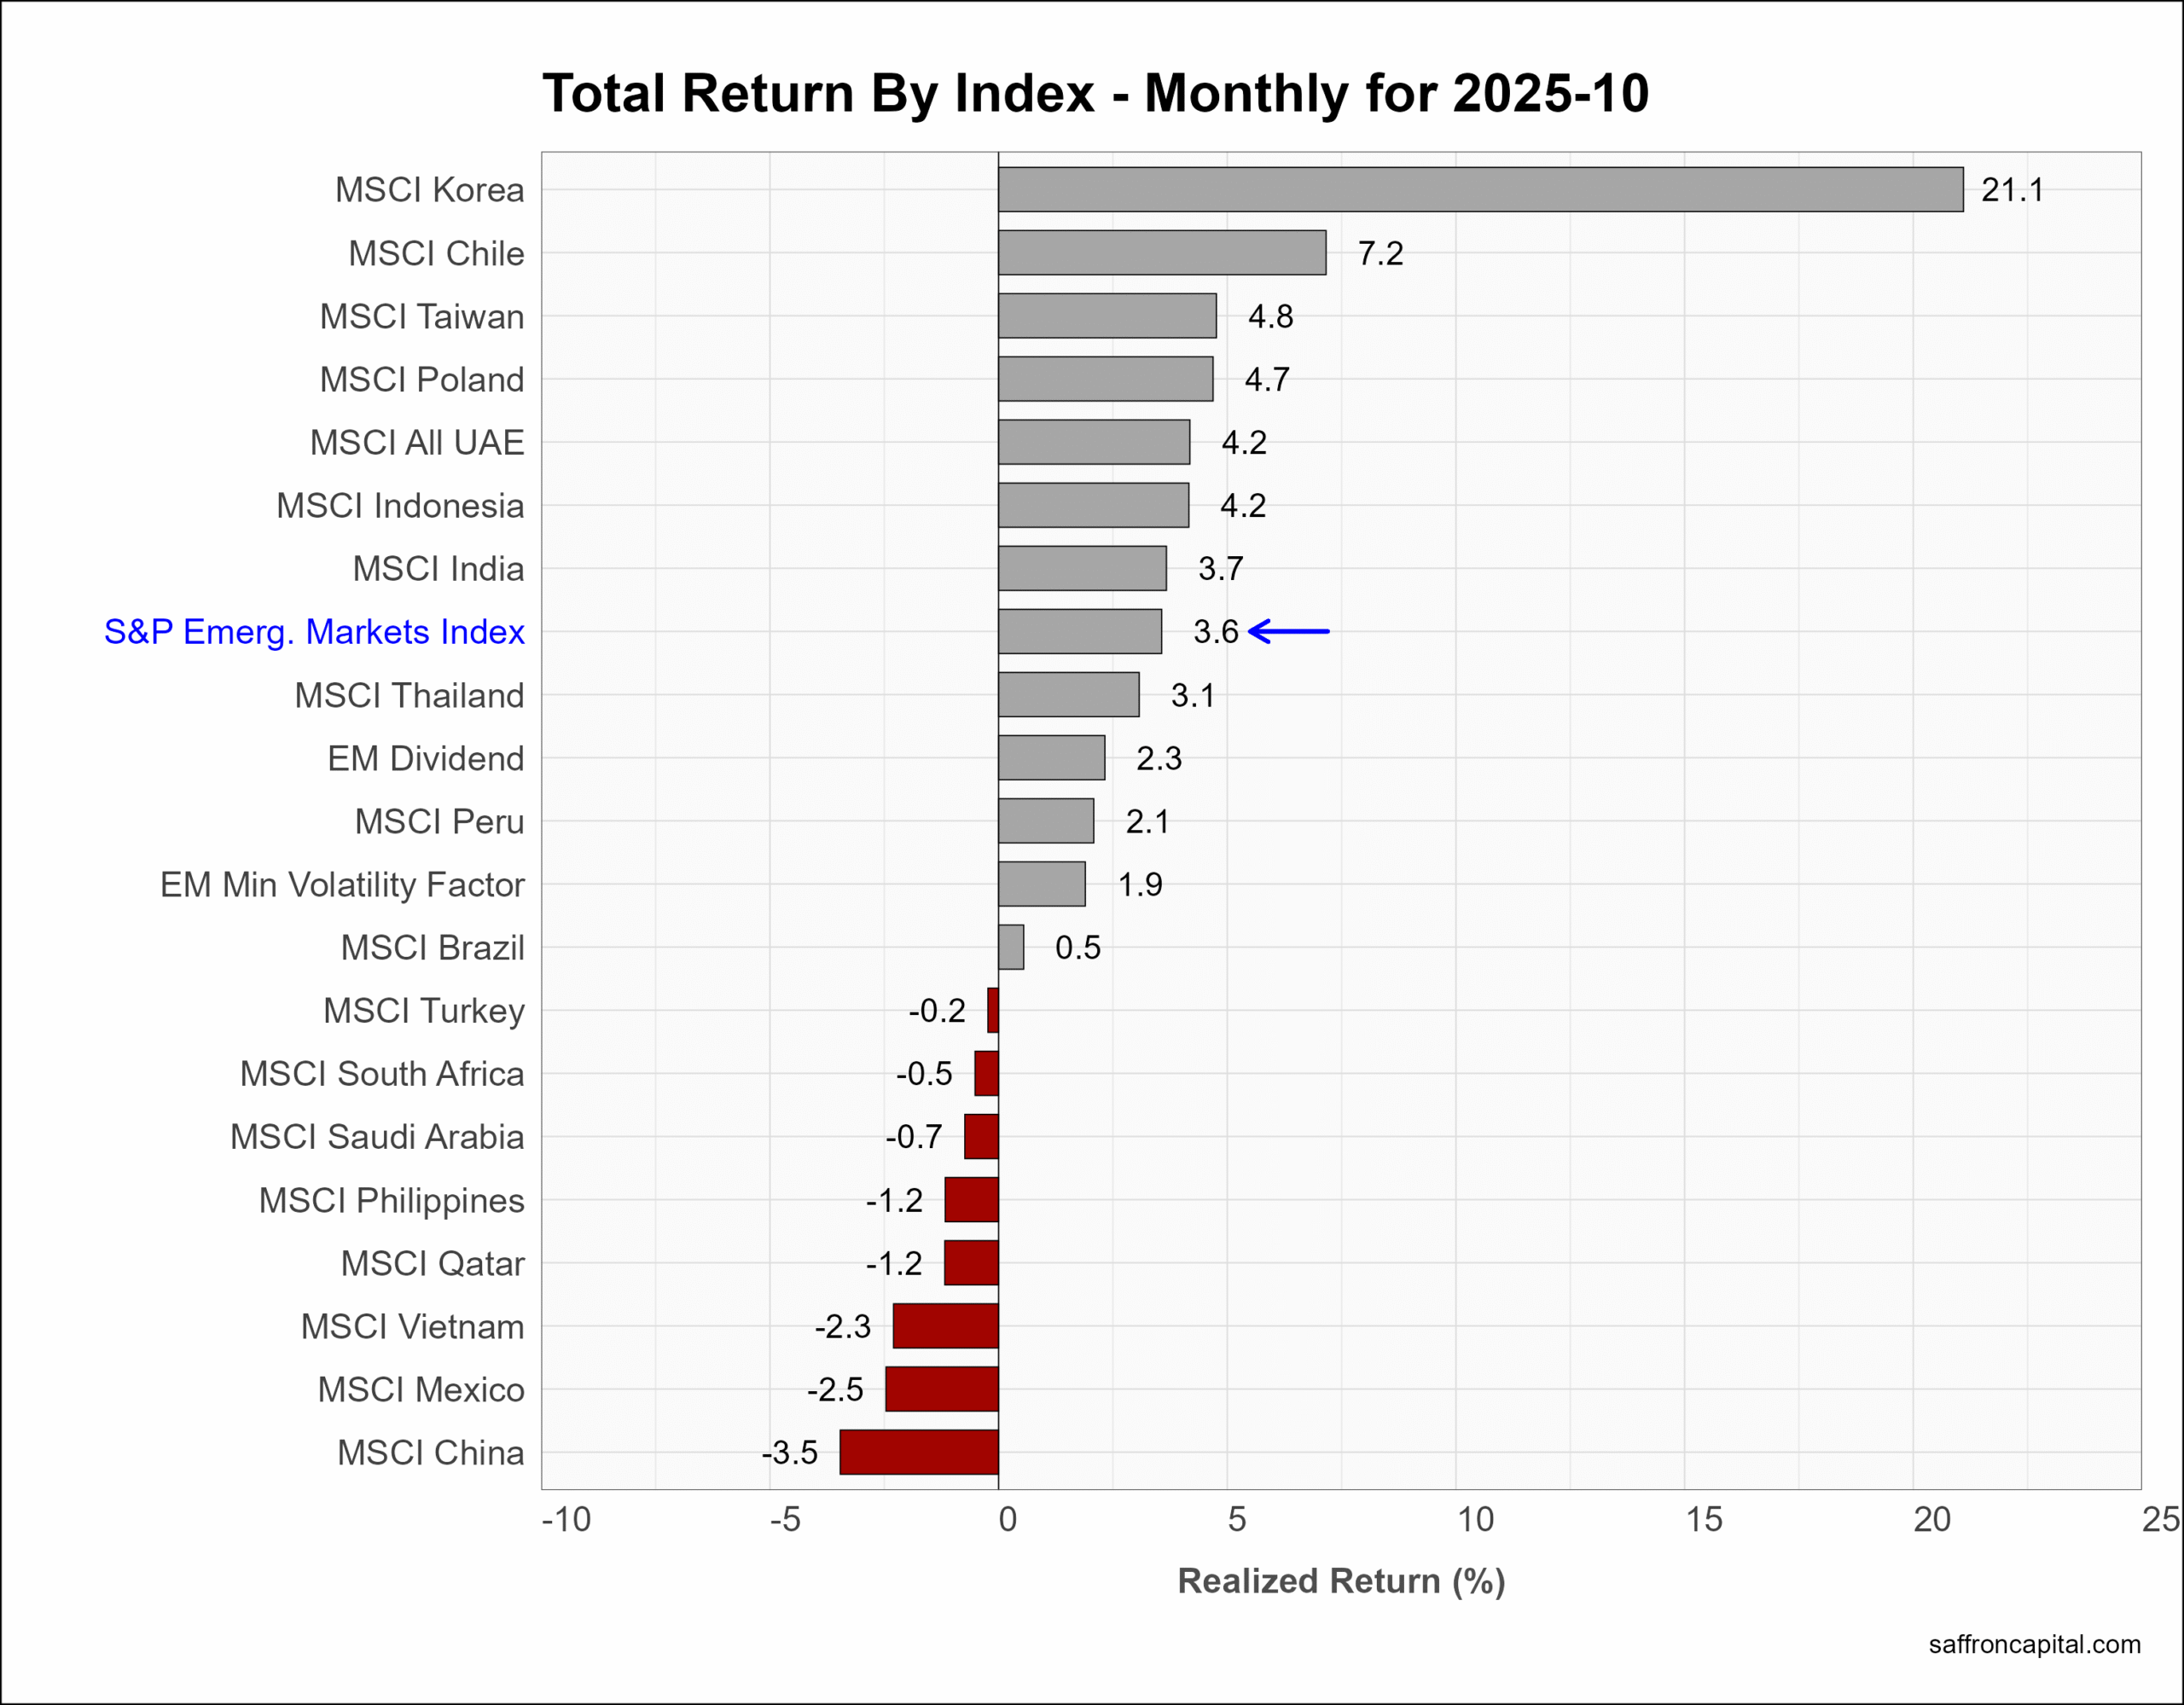
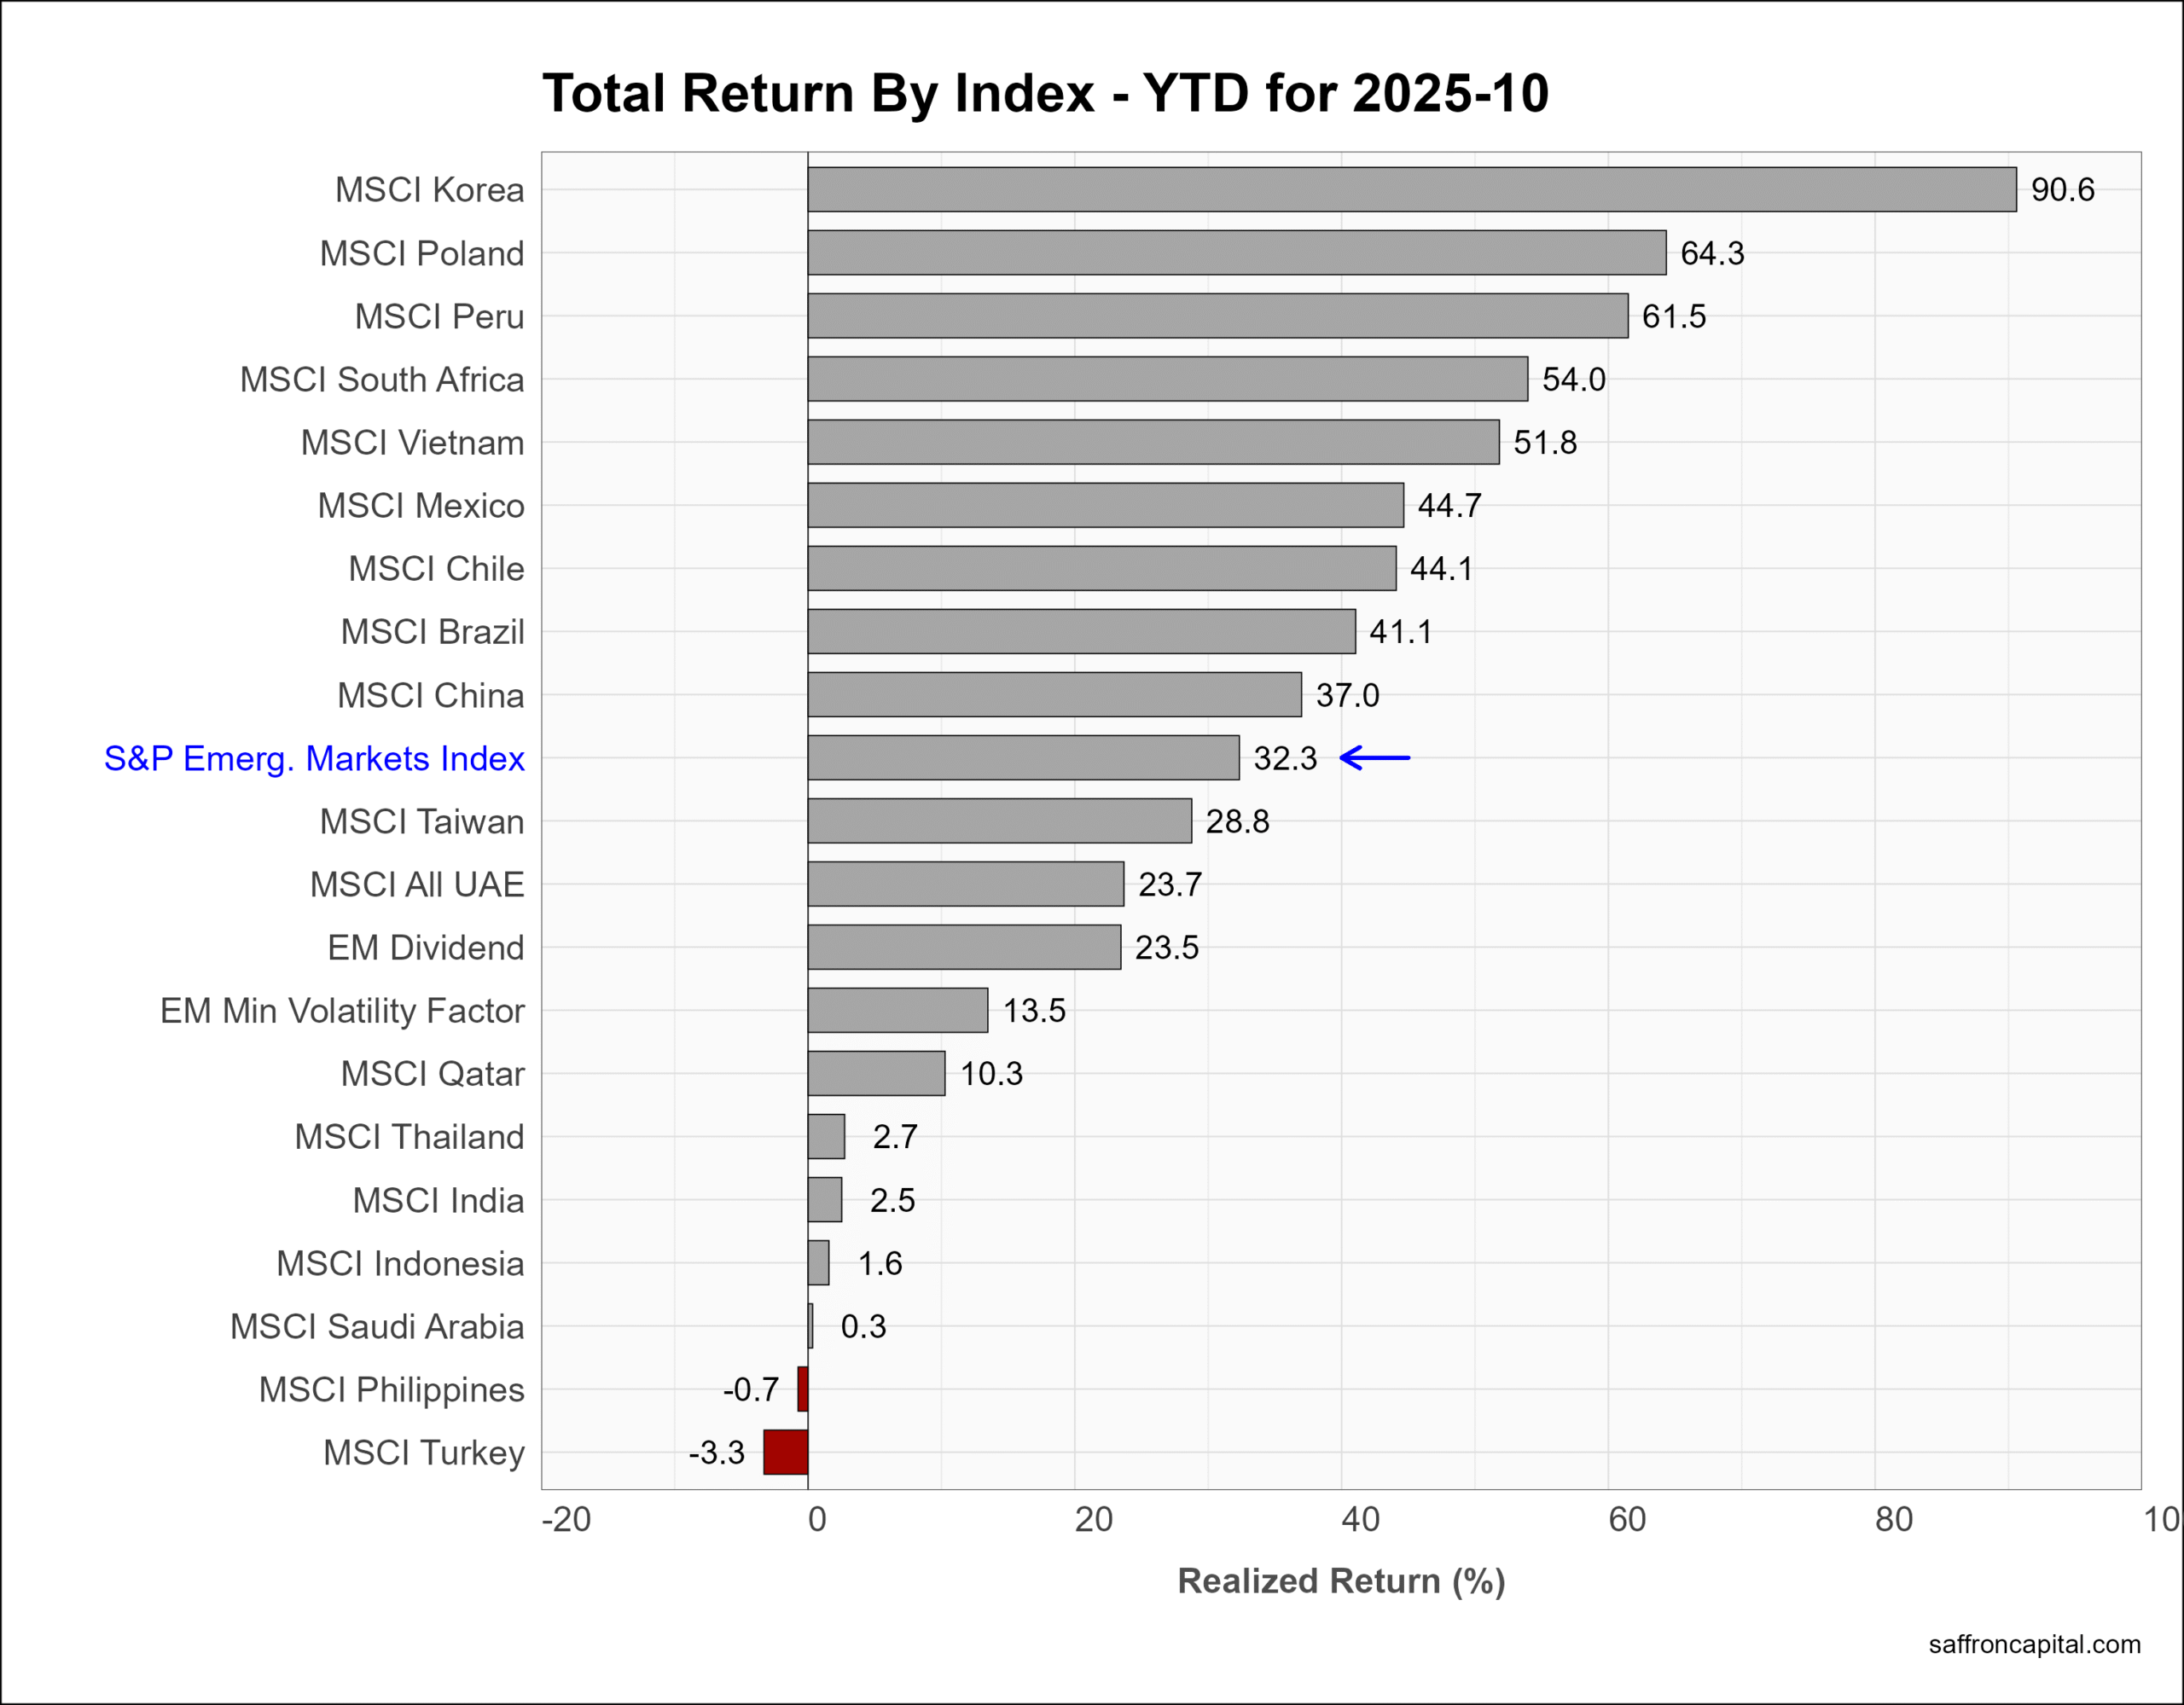
Emerging Market Equities
The S&P Emerging Markets Index (+3.6%) has now beat the S&P 500 index two months in a row. Returns were led by Korea (+21.1%), Chile (+7.2%), and Taiwan (+4.8%). Key laggards in October include export powerhouses included Vietnam (-2.3%), Mexico (-2.5%) and China (-3.5%). Year-to-date performance is led by Korea (+90.6%), Poland (+64.3%) and Peru (+61.5%).
Click to enlarge
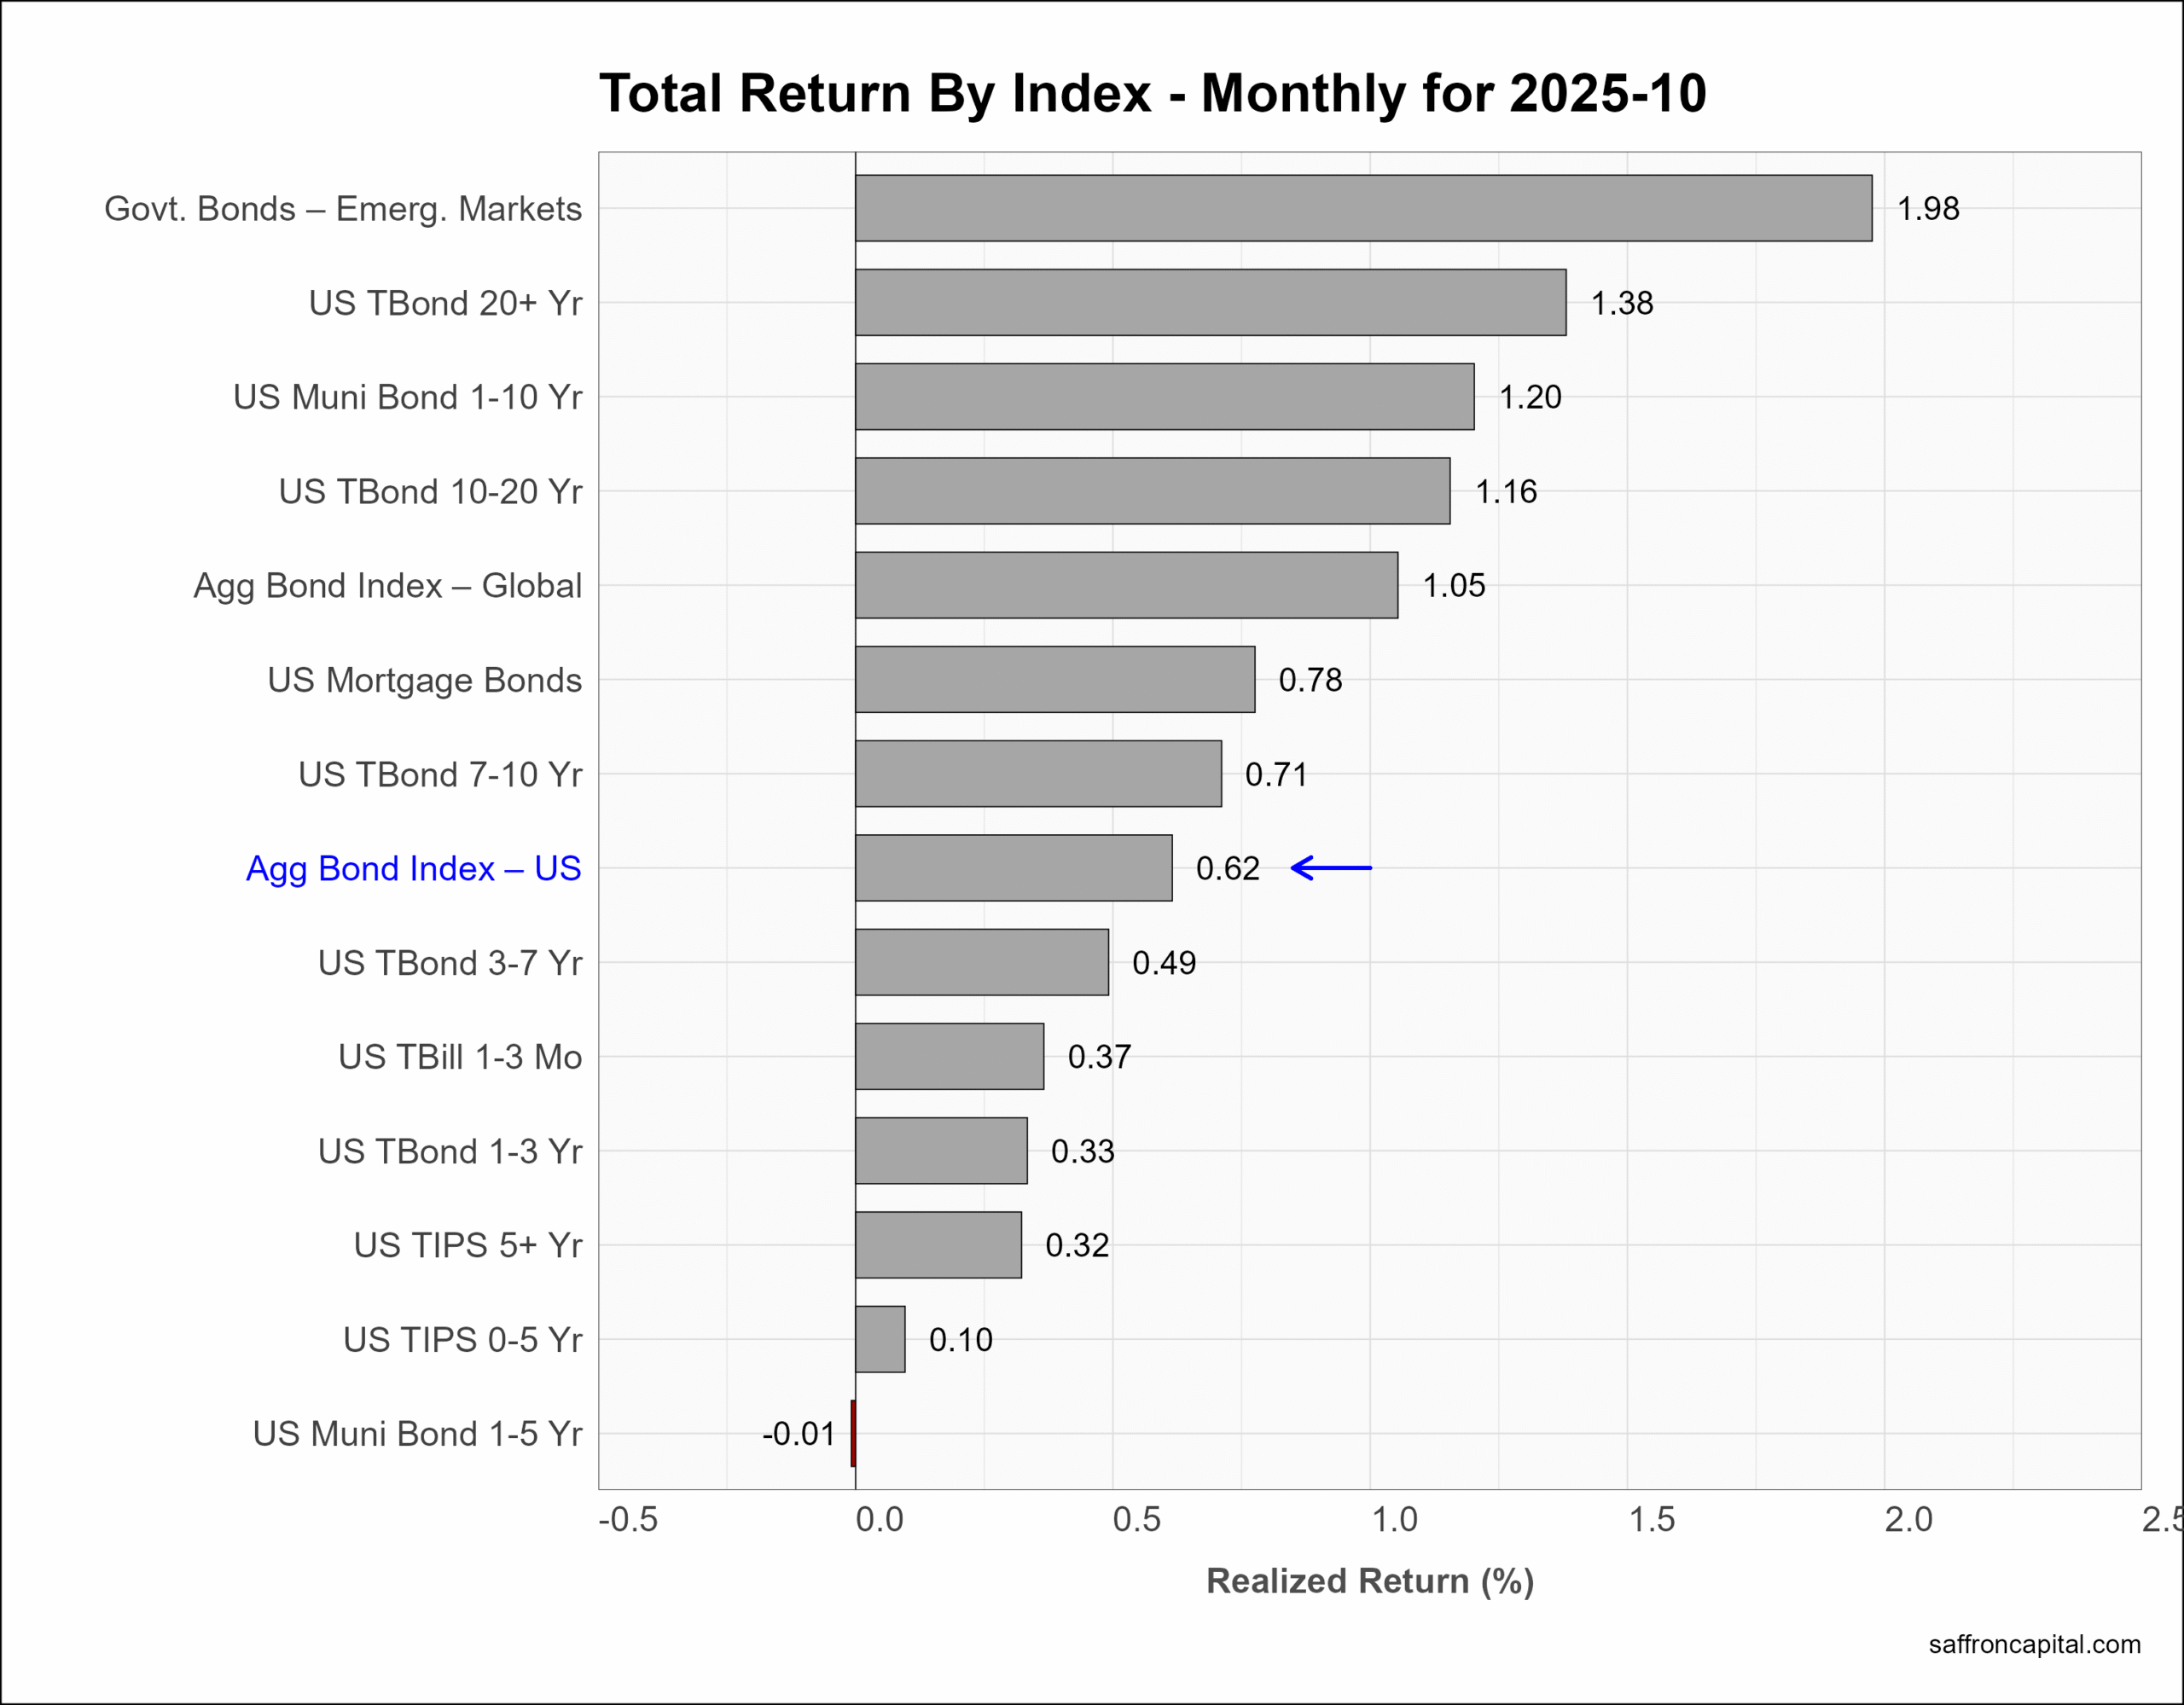
Government Bonds
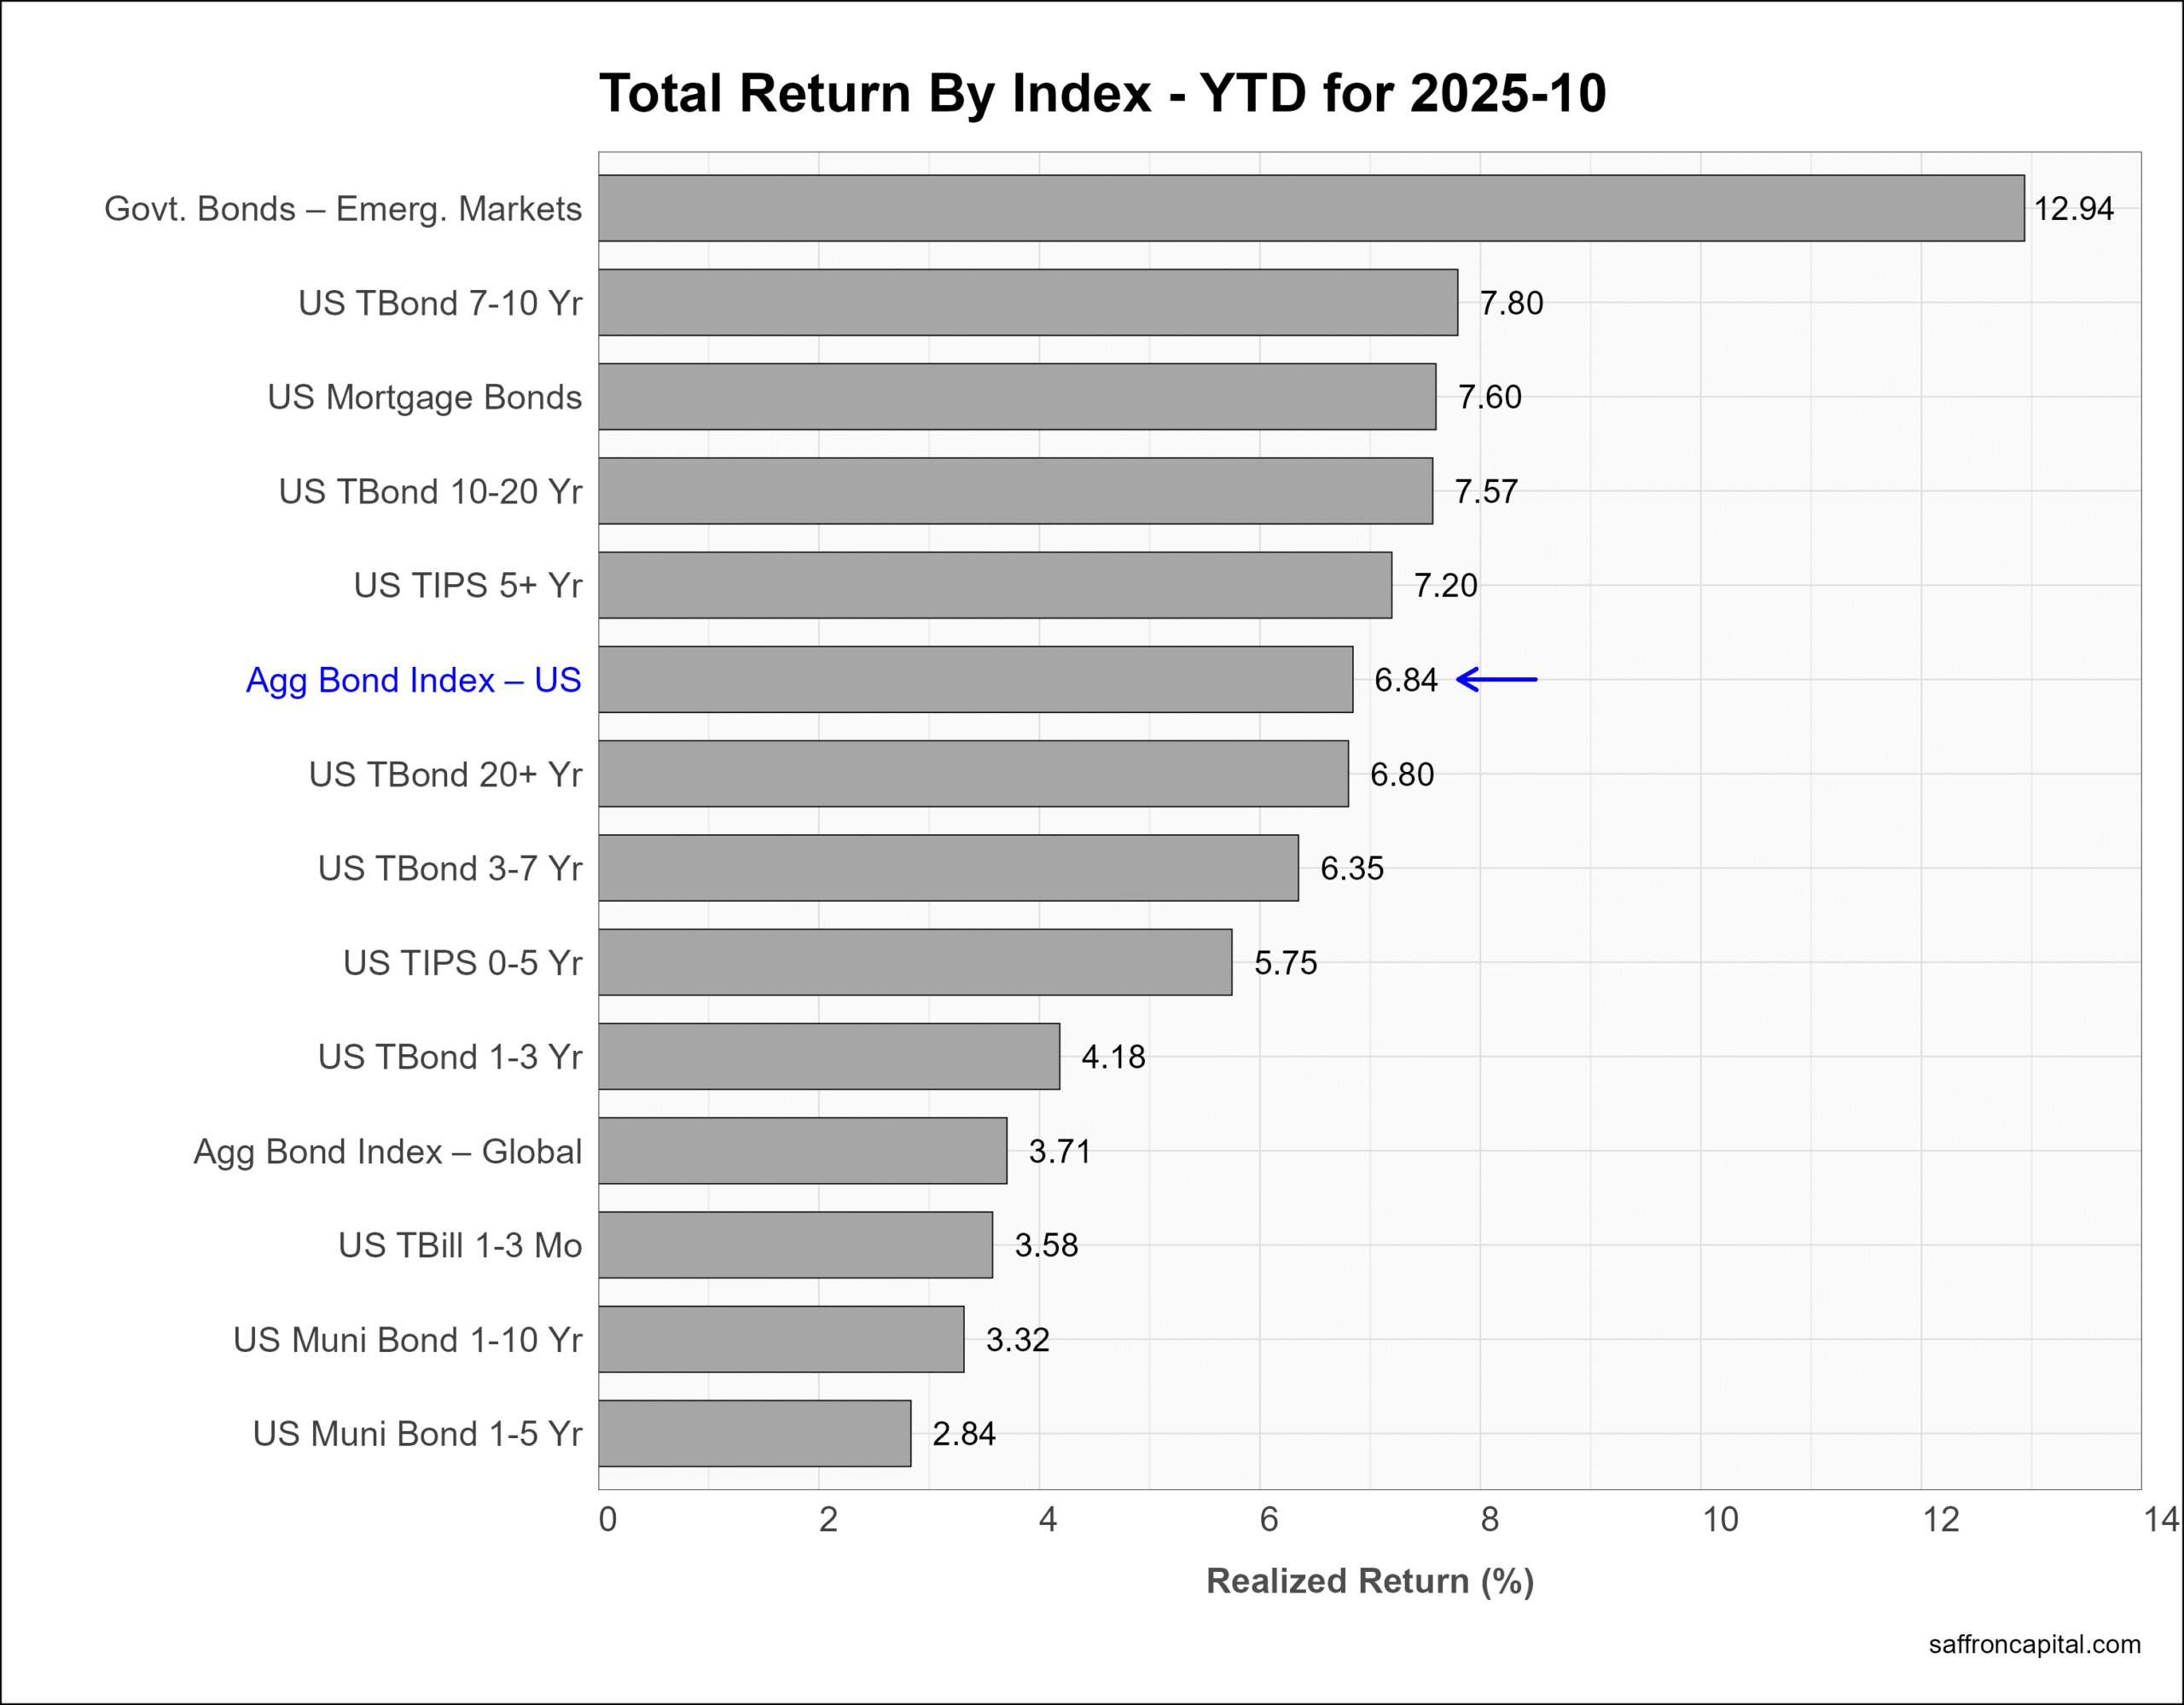
During October, the yield on the 10-year Treasury Note was unchanged and ranged between 4.16% and 3.93%, before settling near the high. The US Aggregate Bond Index (+0.62%) saw only modest gains. Emerging Market Government Bonds (+1.98%) and long duration US Treasury Bonds (+1.38%) were strong performers, as were US Municipal bonds (+1.2%) on a pre-tax basis. Year-to-date, the US Aggregate Bond Index (+6.84%) is lagging behind Emerging Market Government Bods (+12.94%), 7- to 10-year Treasuries (+7.80%), and US Mortgage Bonds (+7.60%).
Click to enlarge
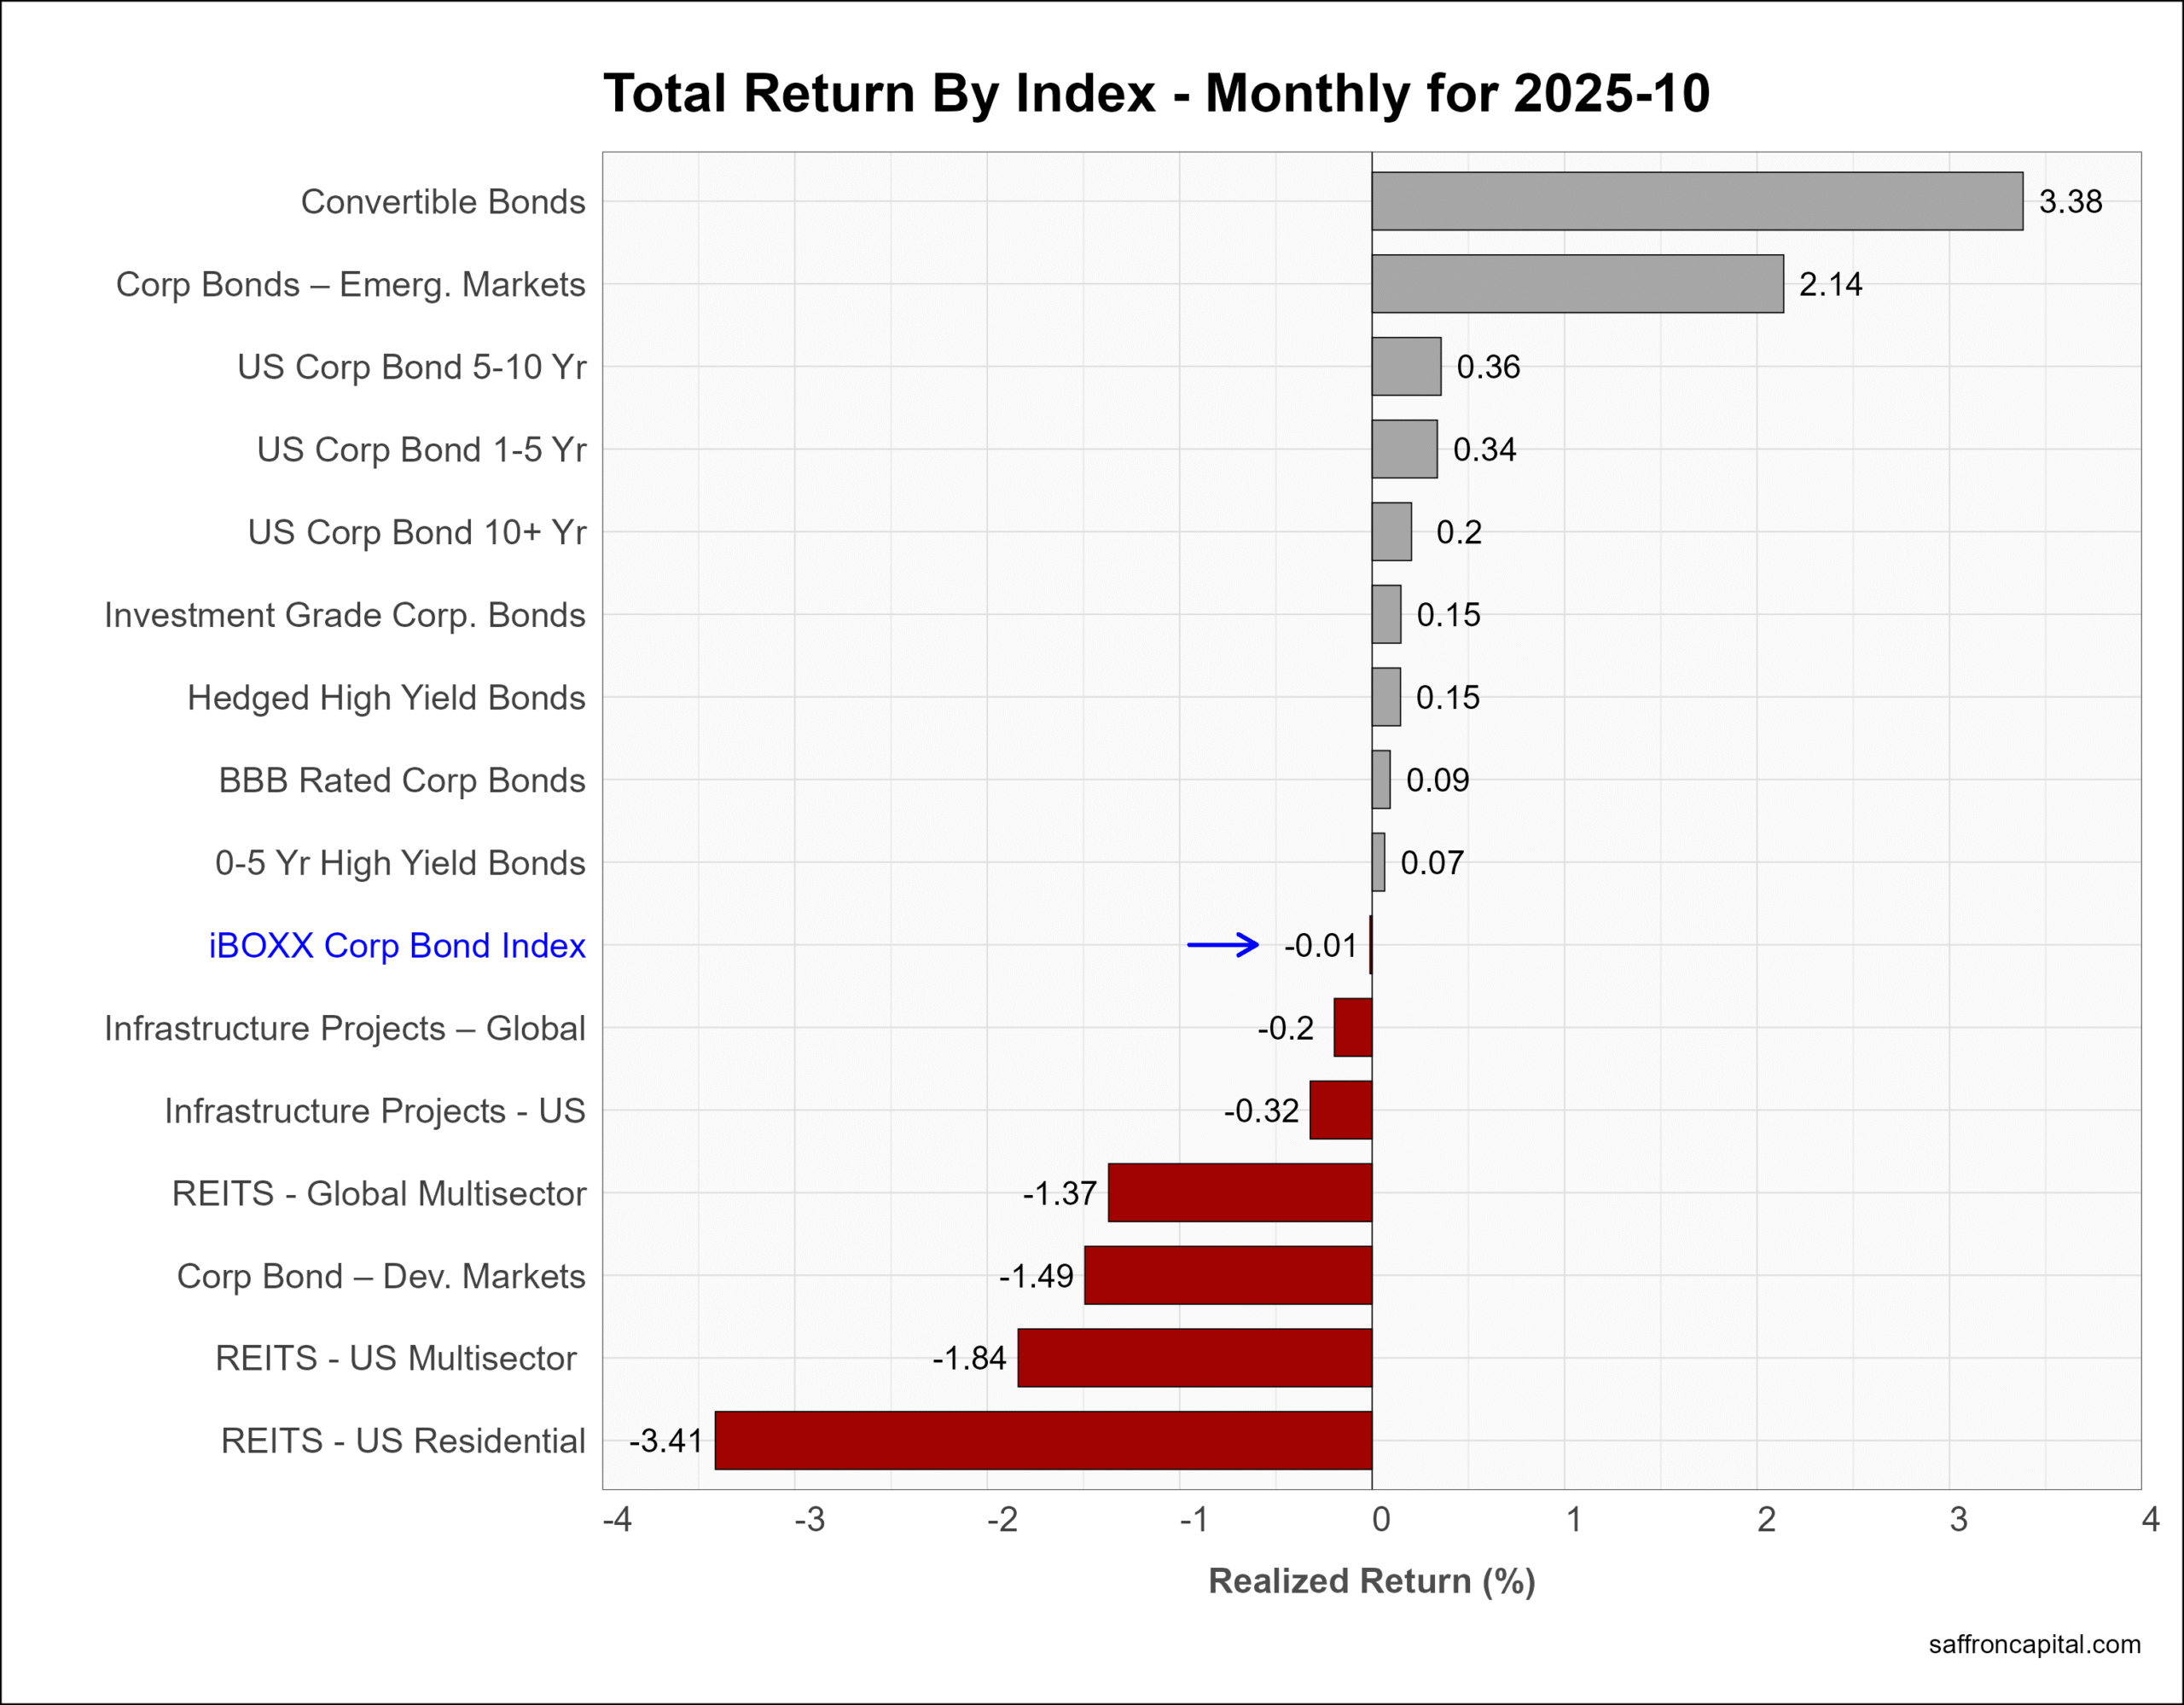
Corporate & Infrastructure Bonds
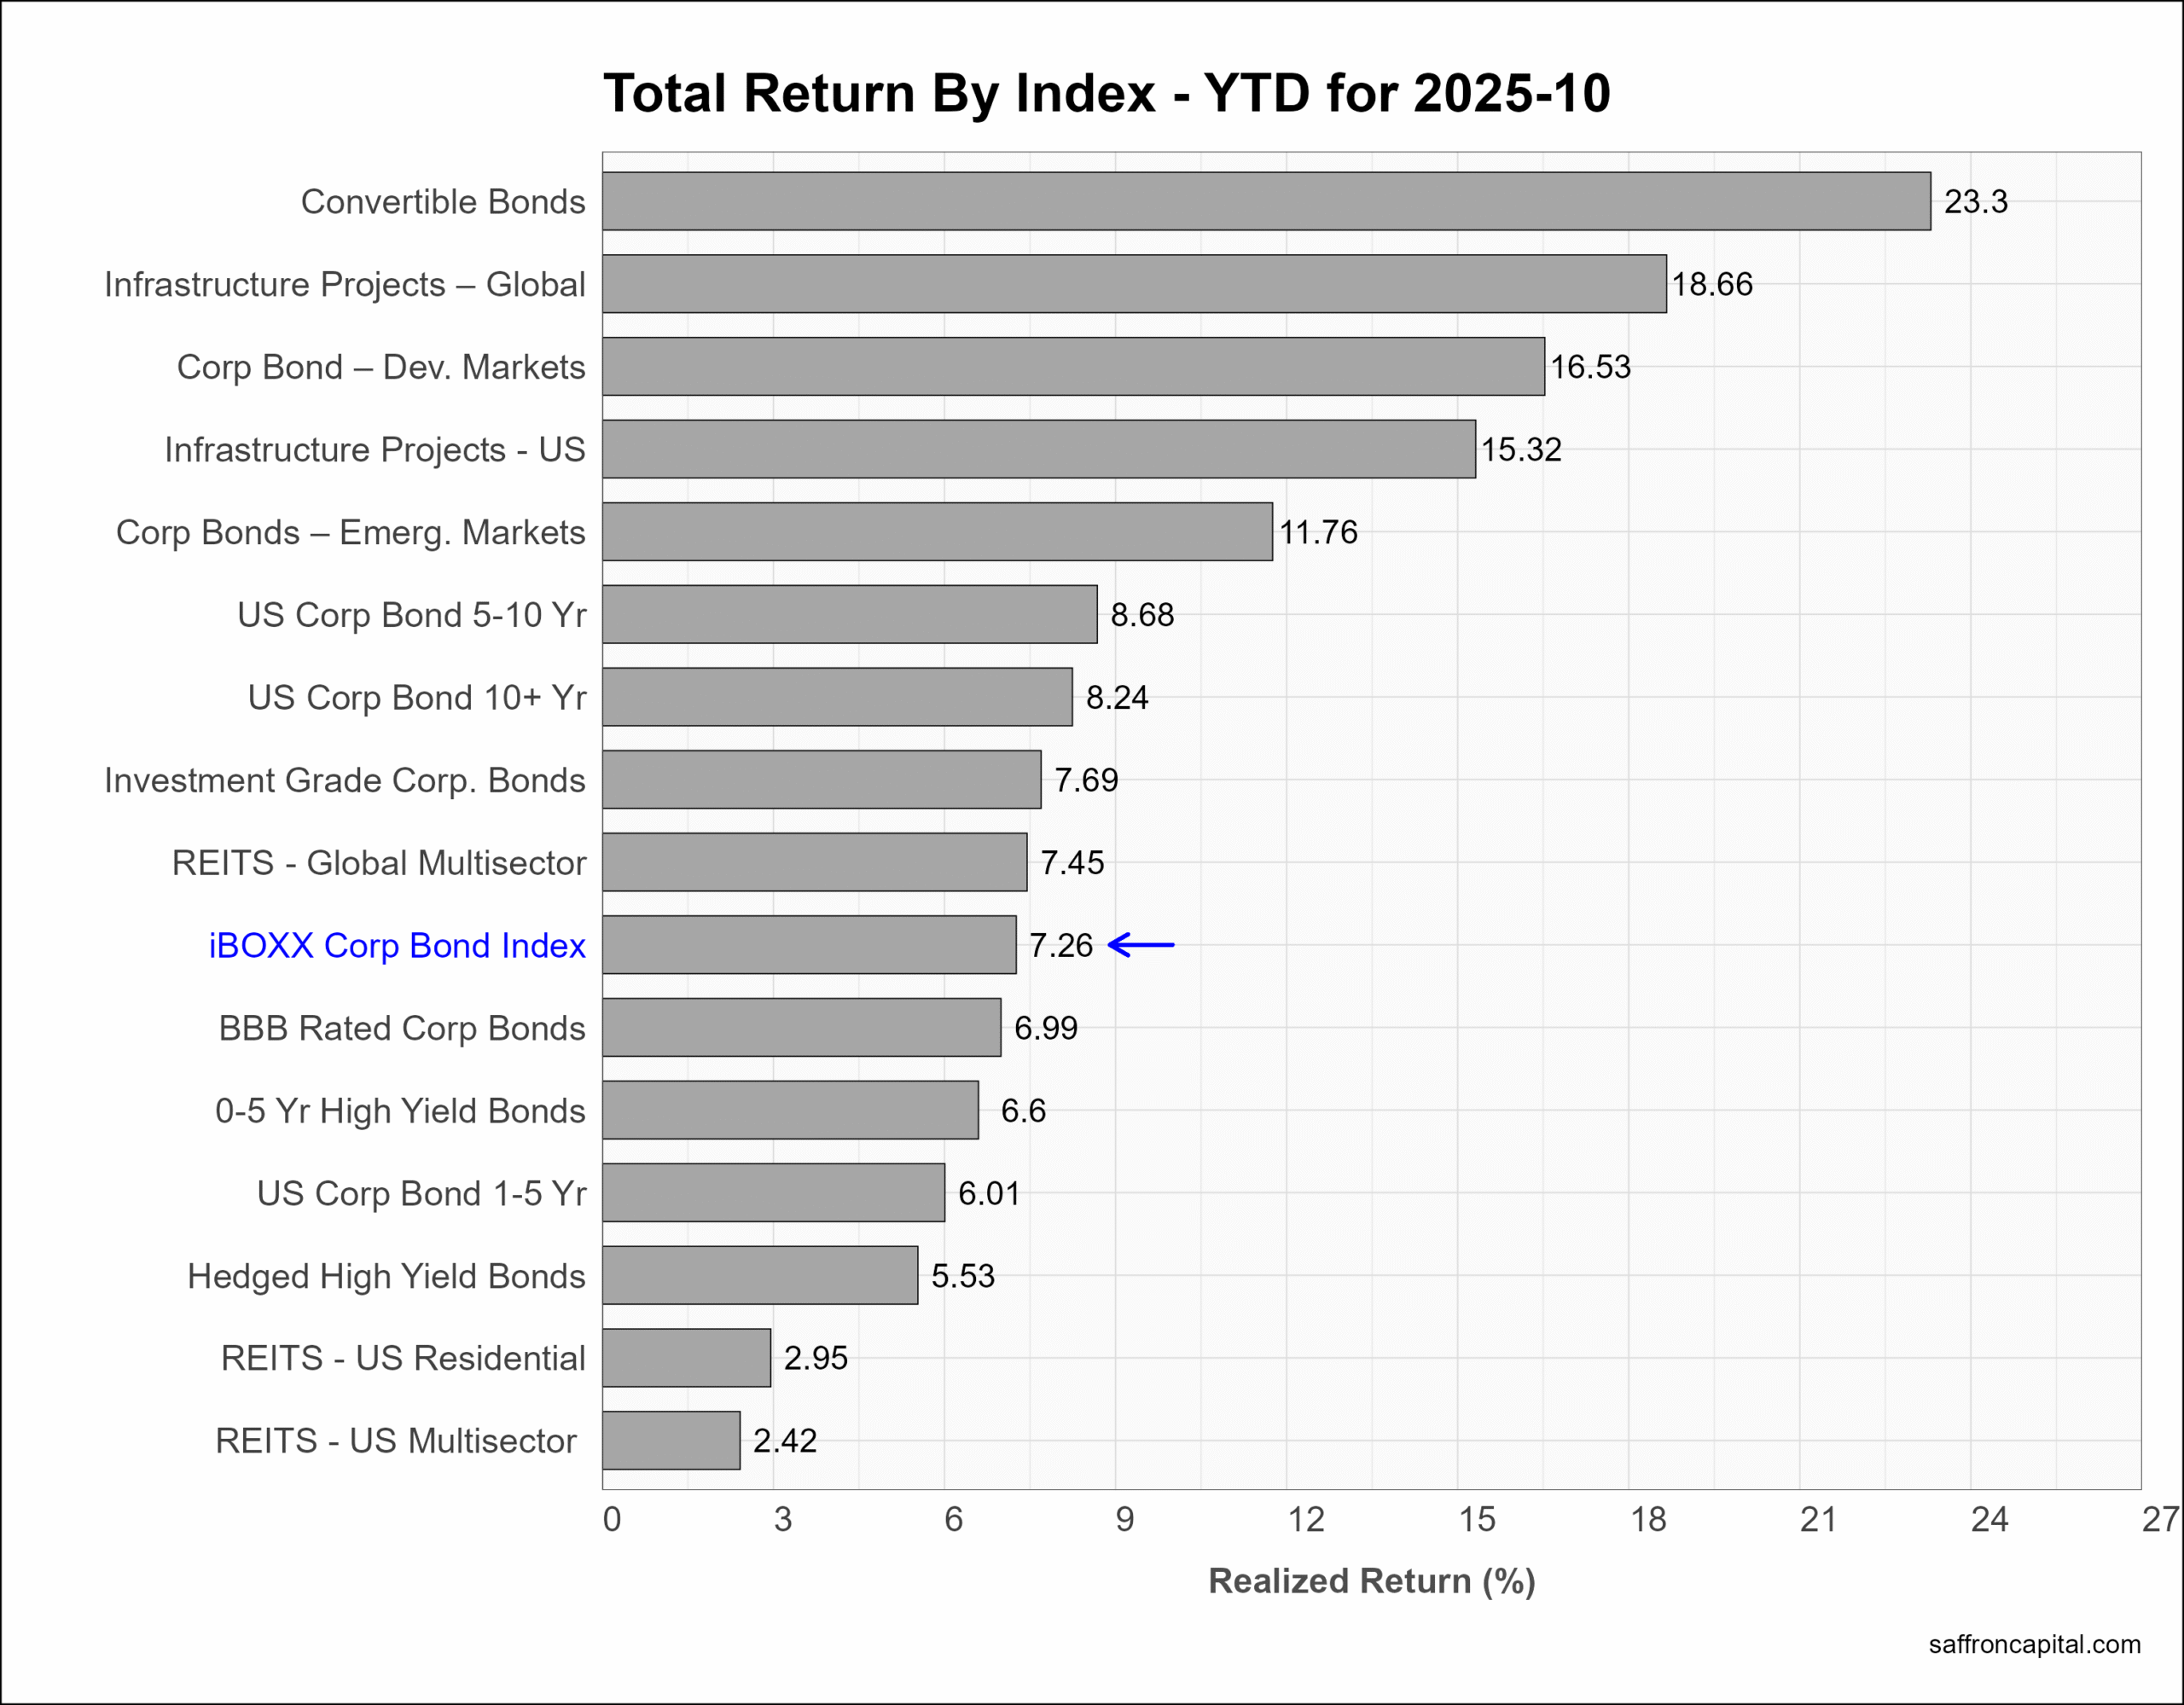
The benchmark iBoxx Corporate Bond Index (-0.01%) was unchanged, while infrastructure projects were neutral-to-down as seen with Global Projects (-0.2%) and US Projects (-0.32%). Weakness across the REIT sectors was more pronounced. US Multisector (-1.84%) and Residential (-3.41%) REITS had notable losses. The top performing returns since January include Convertible Bonds (+23.3%), Global Infrastructure Projects (+18.66%), and Developed market IG bonds (+16.53%).
Click to enlarge
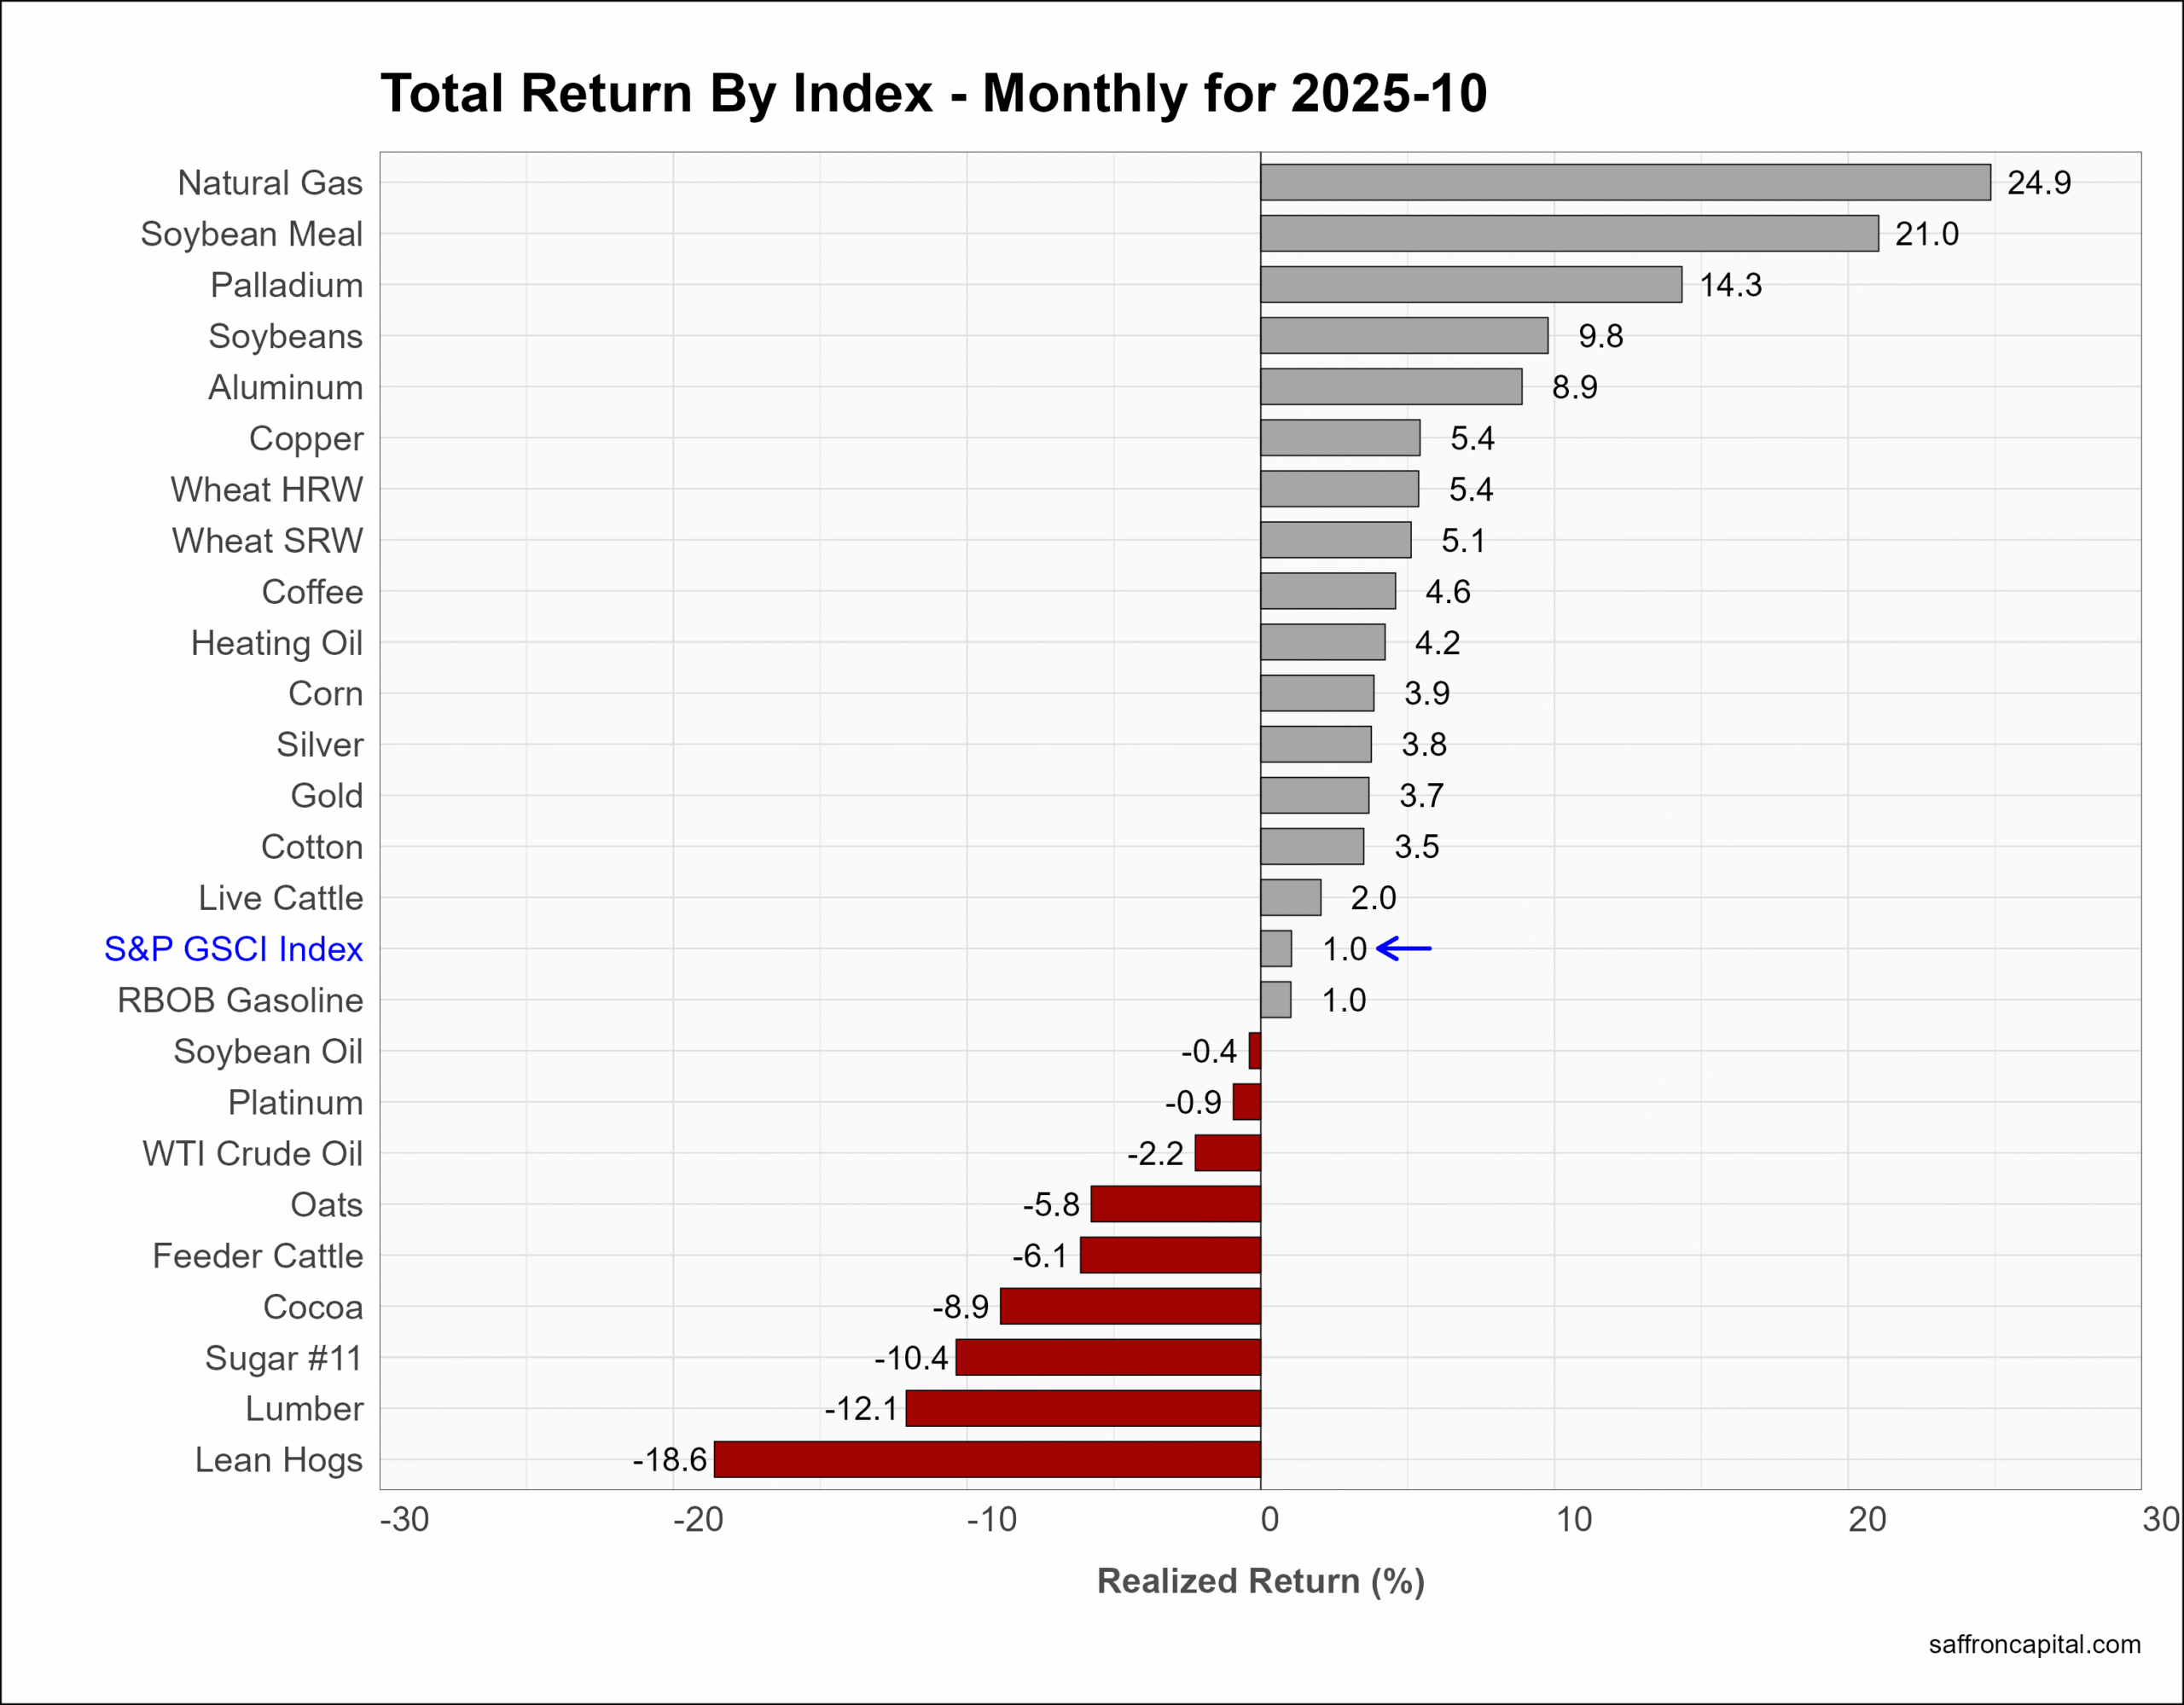
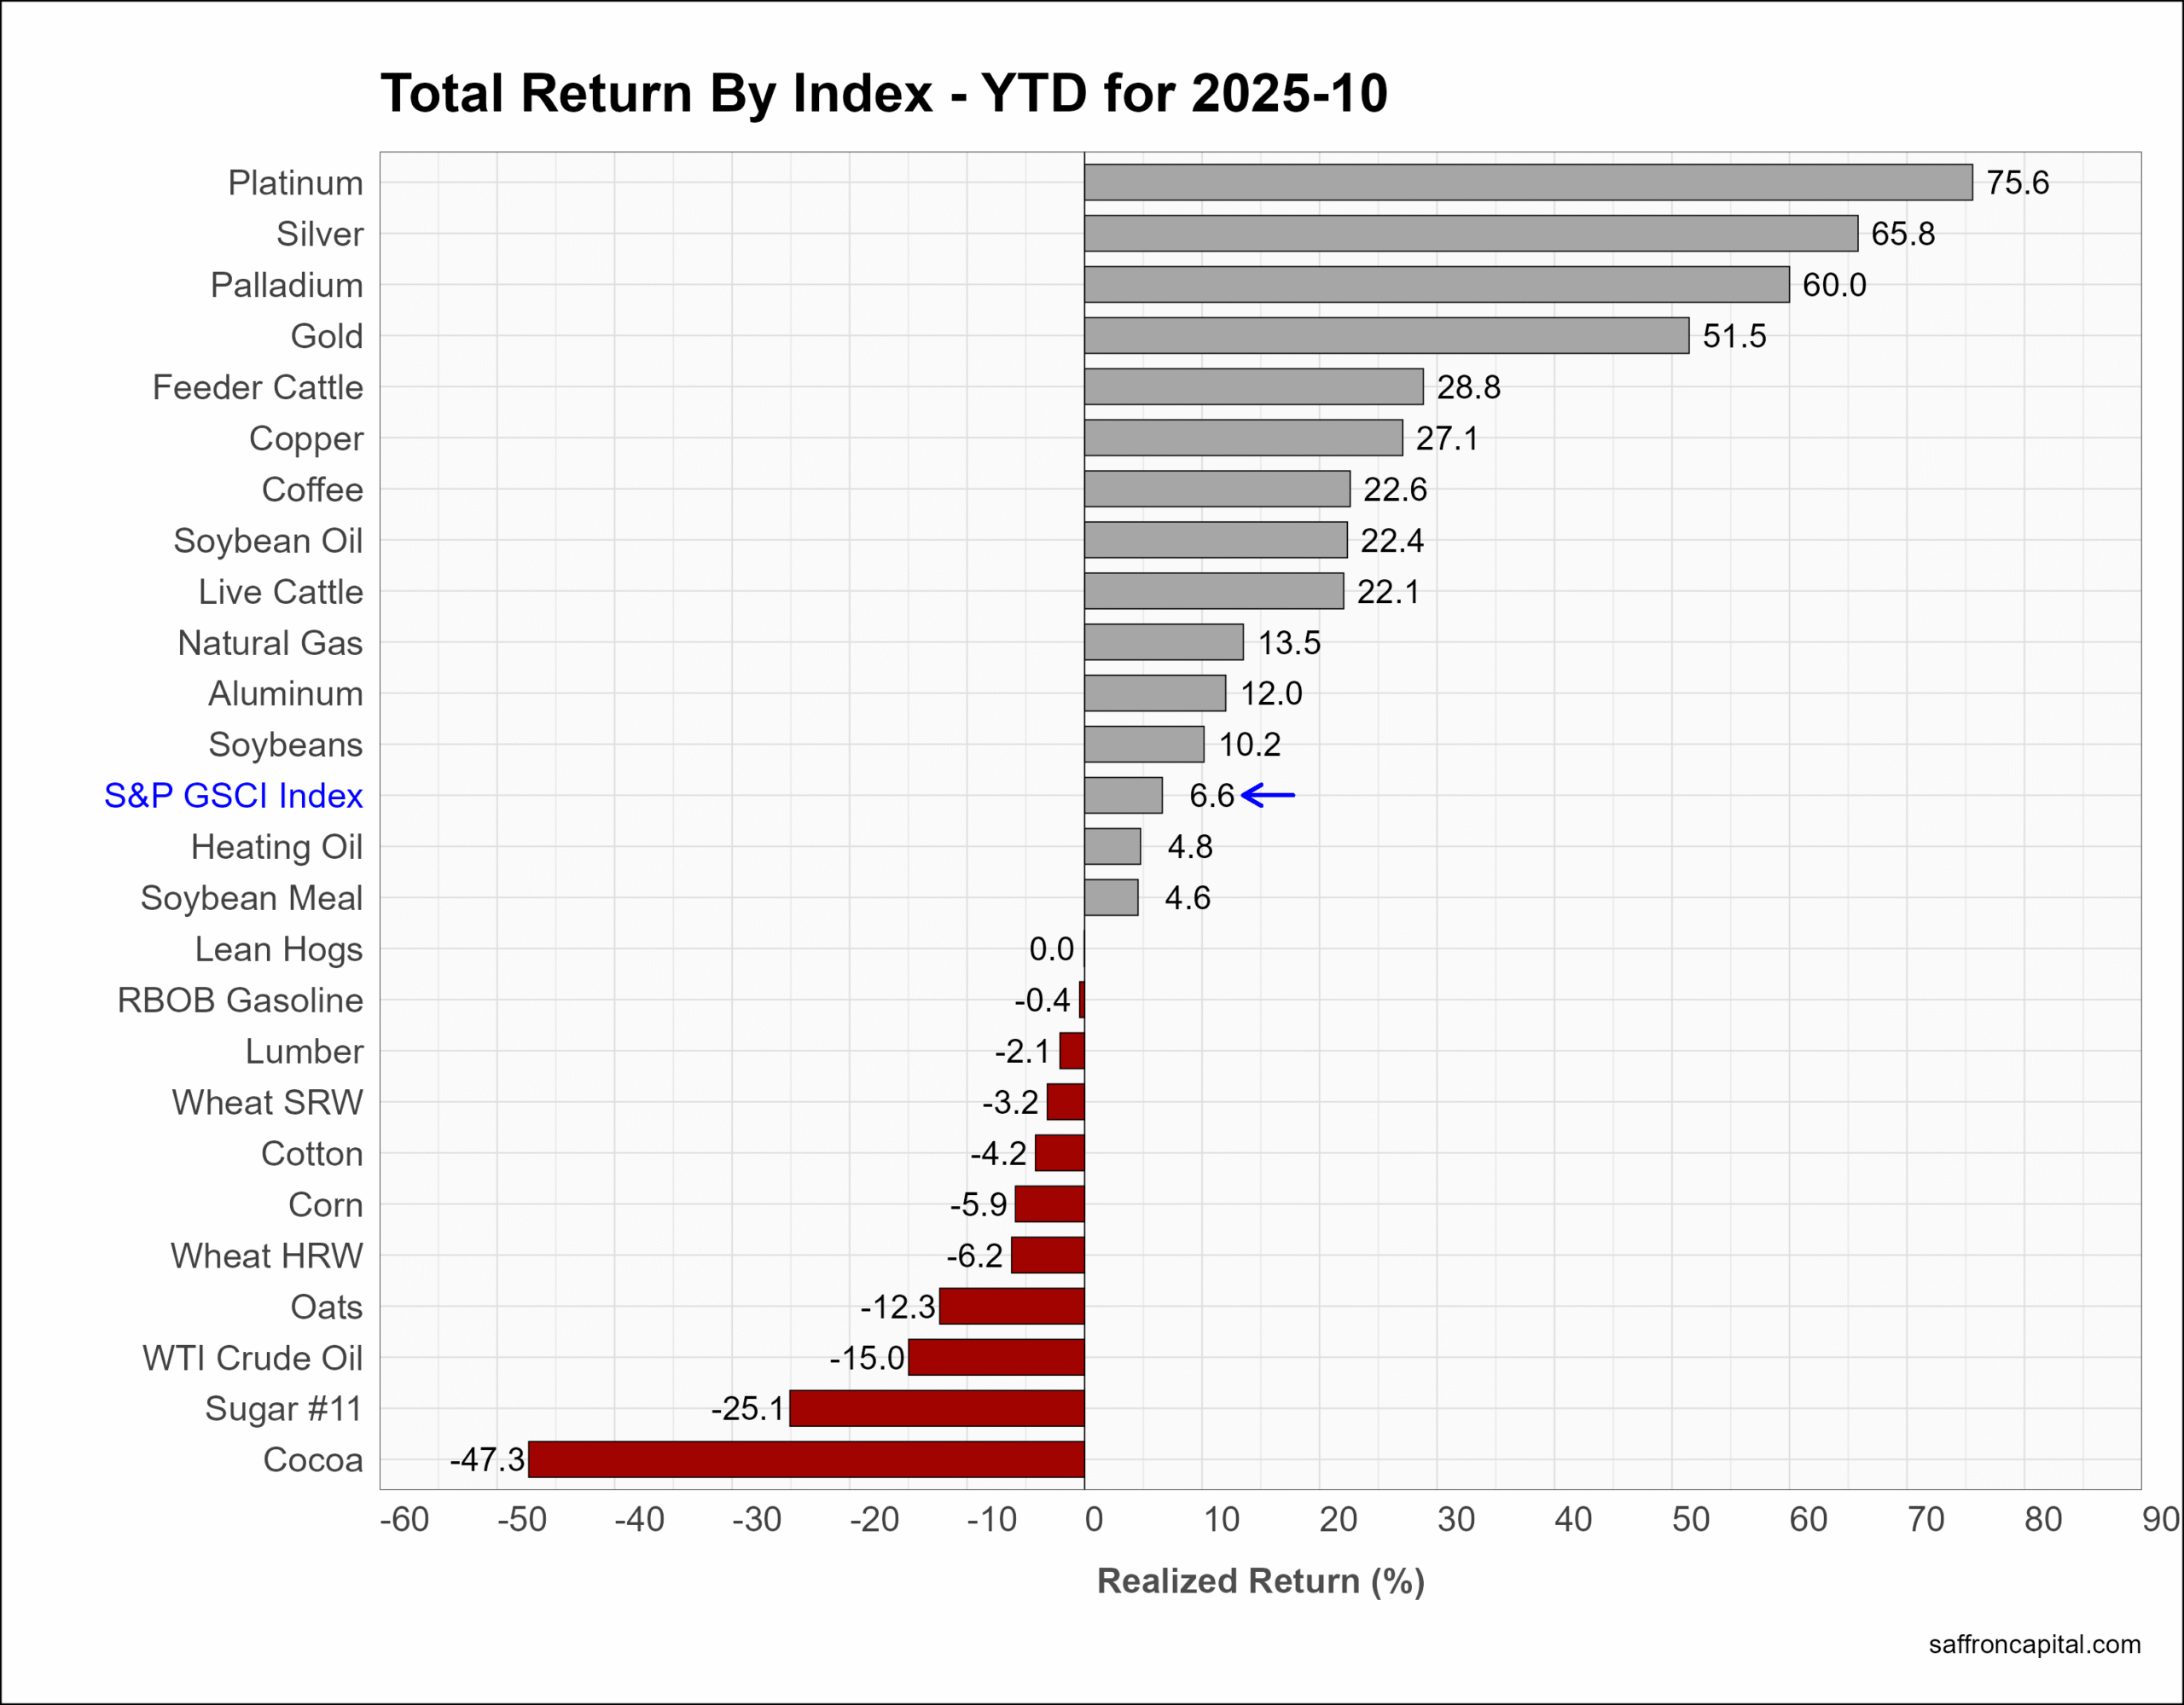
Commodities
Commodity returns, as measured by the S&P GS Commodity Index (+1.0%), were modest in October. Natural Gas (+24.9%), Soybean Meal (21.0%), and Palladium (+14.3) topped the list. Silver (+3.8%) and Gold (+3.7%) held onto positive gains despite large drawdowns from monthly highs. Lumber (-12.1%), which is a key indicator for many consumers’ more significant purchases, was notably weak. For 2025, the commodity index (+6.6%) lags behind US stock and bond returns. However, top performers in the precious metals group include Platinum (+75.6%), Silver (+65.8%), and Palladium (+60.0%).
Click to enlarge
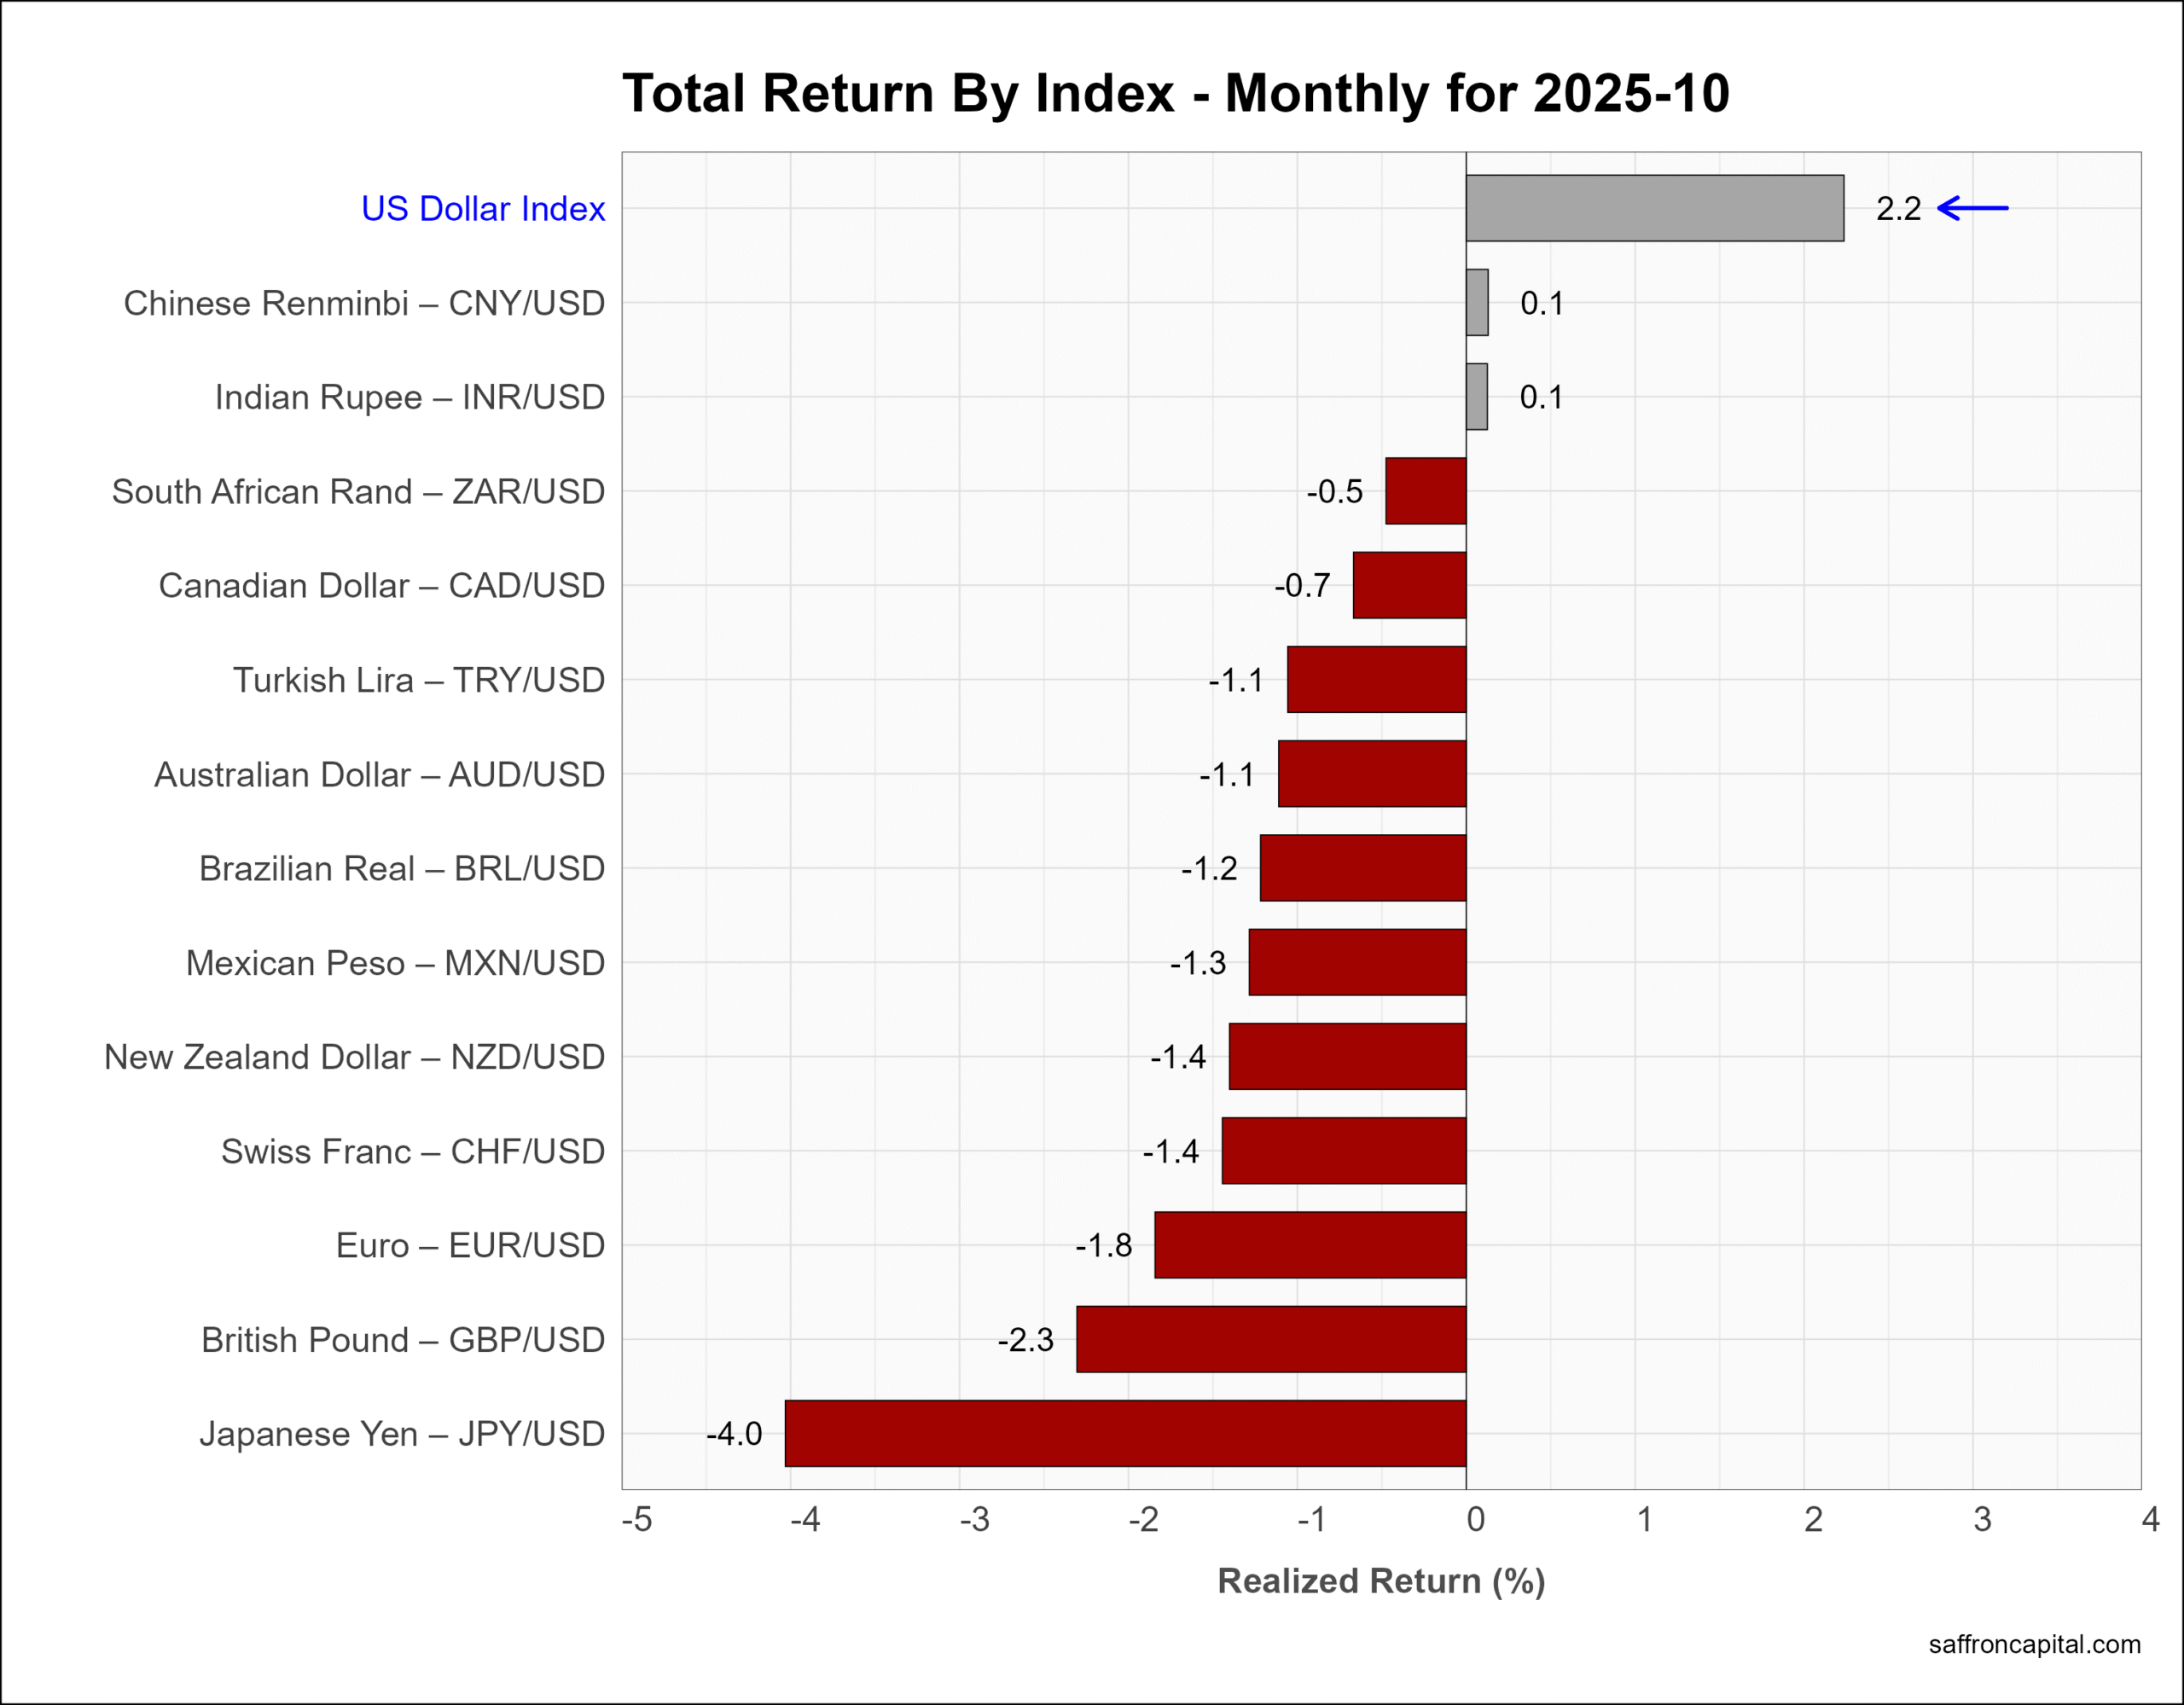
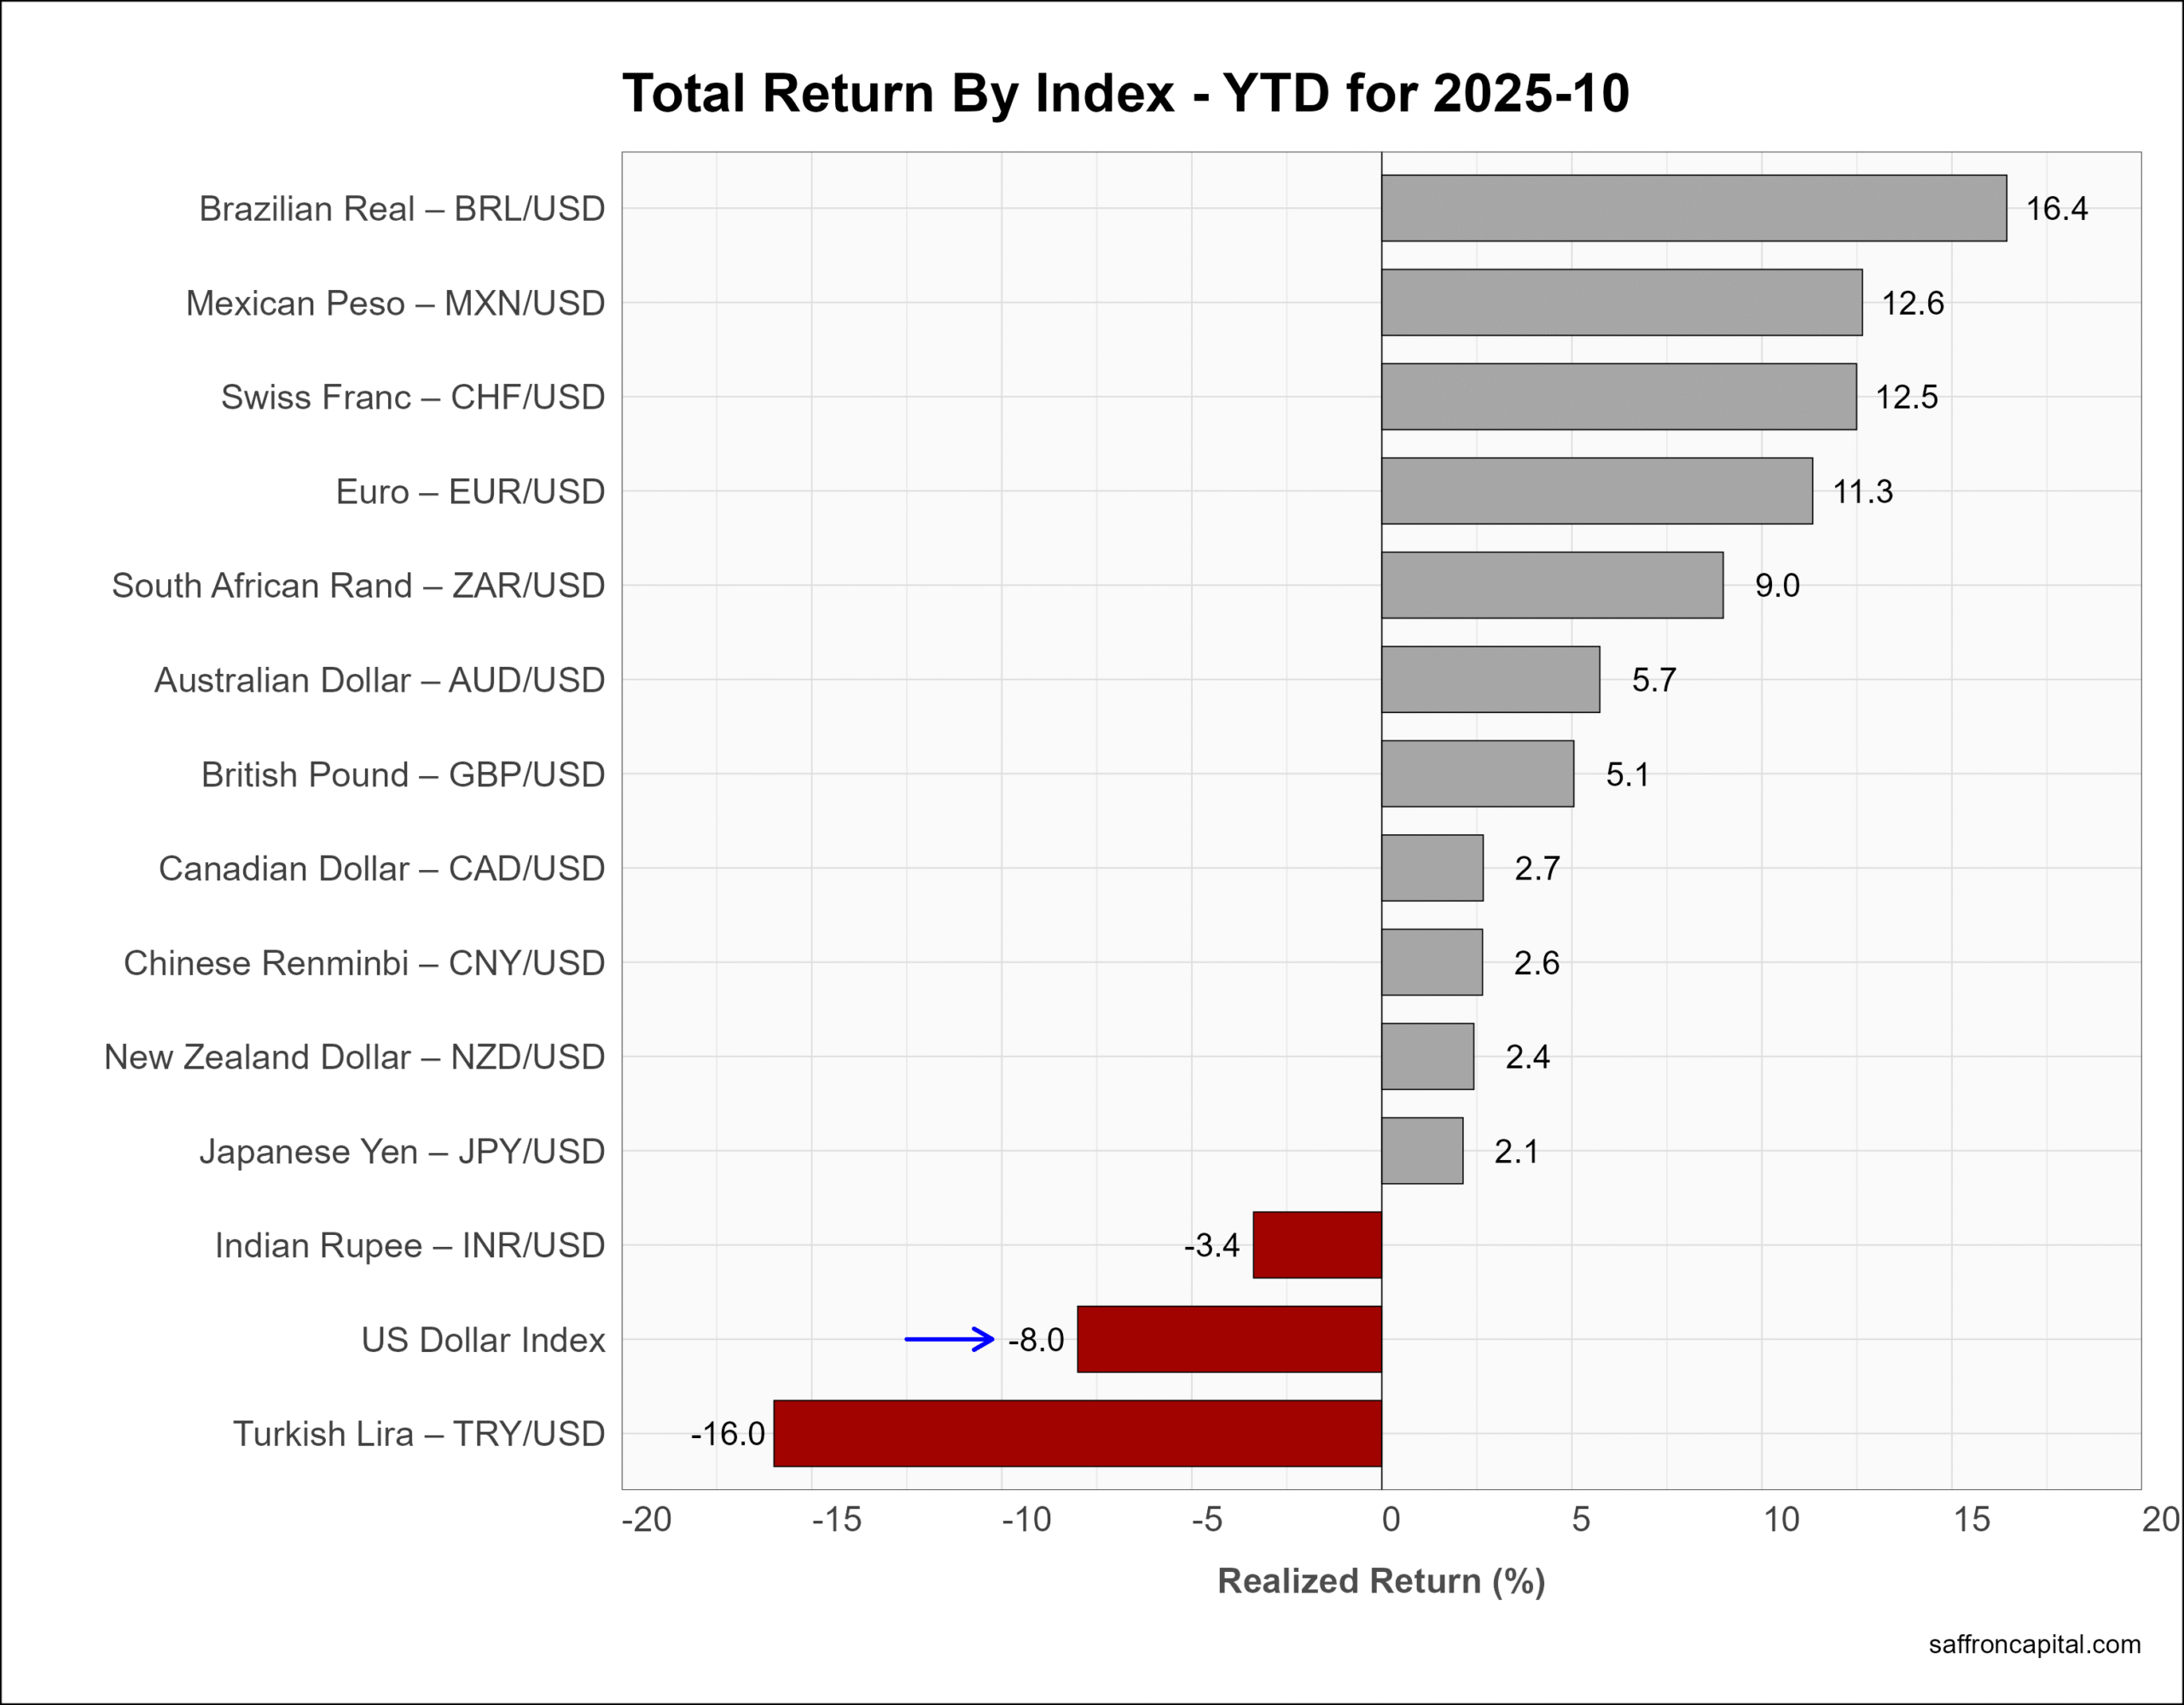
Currencies
The U.S. Dollar index (+2.2%) rebounded in October and is down 8% since the start of the year.
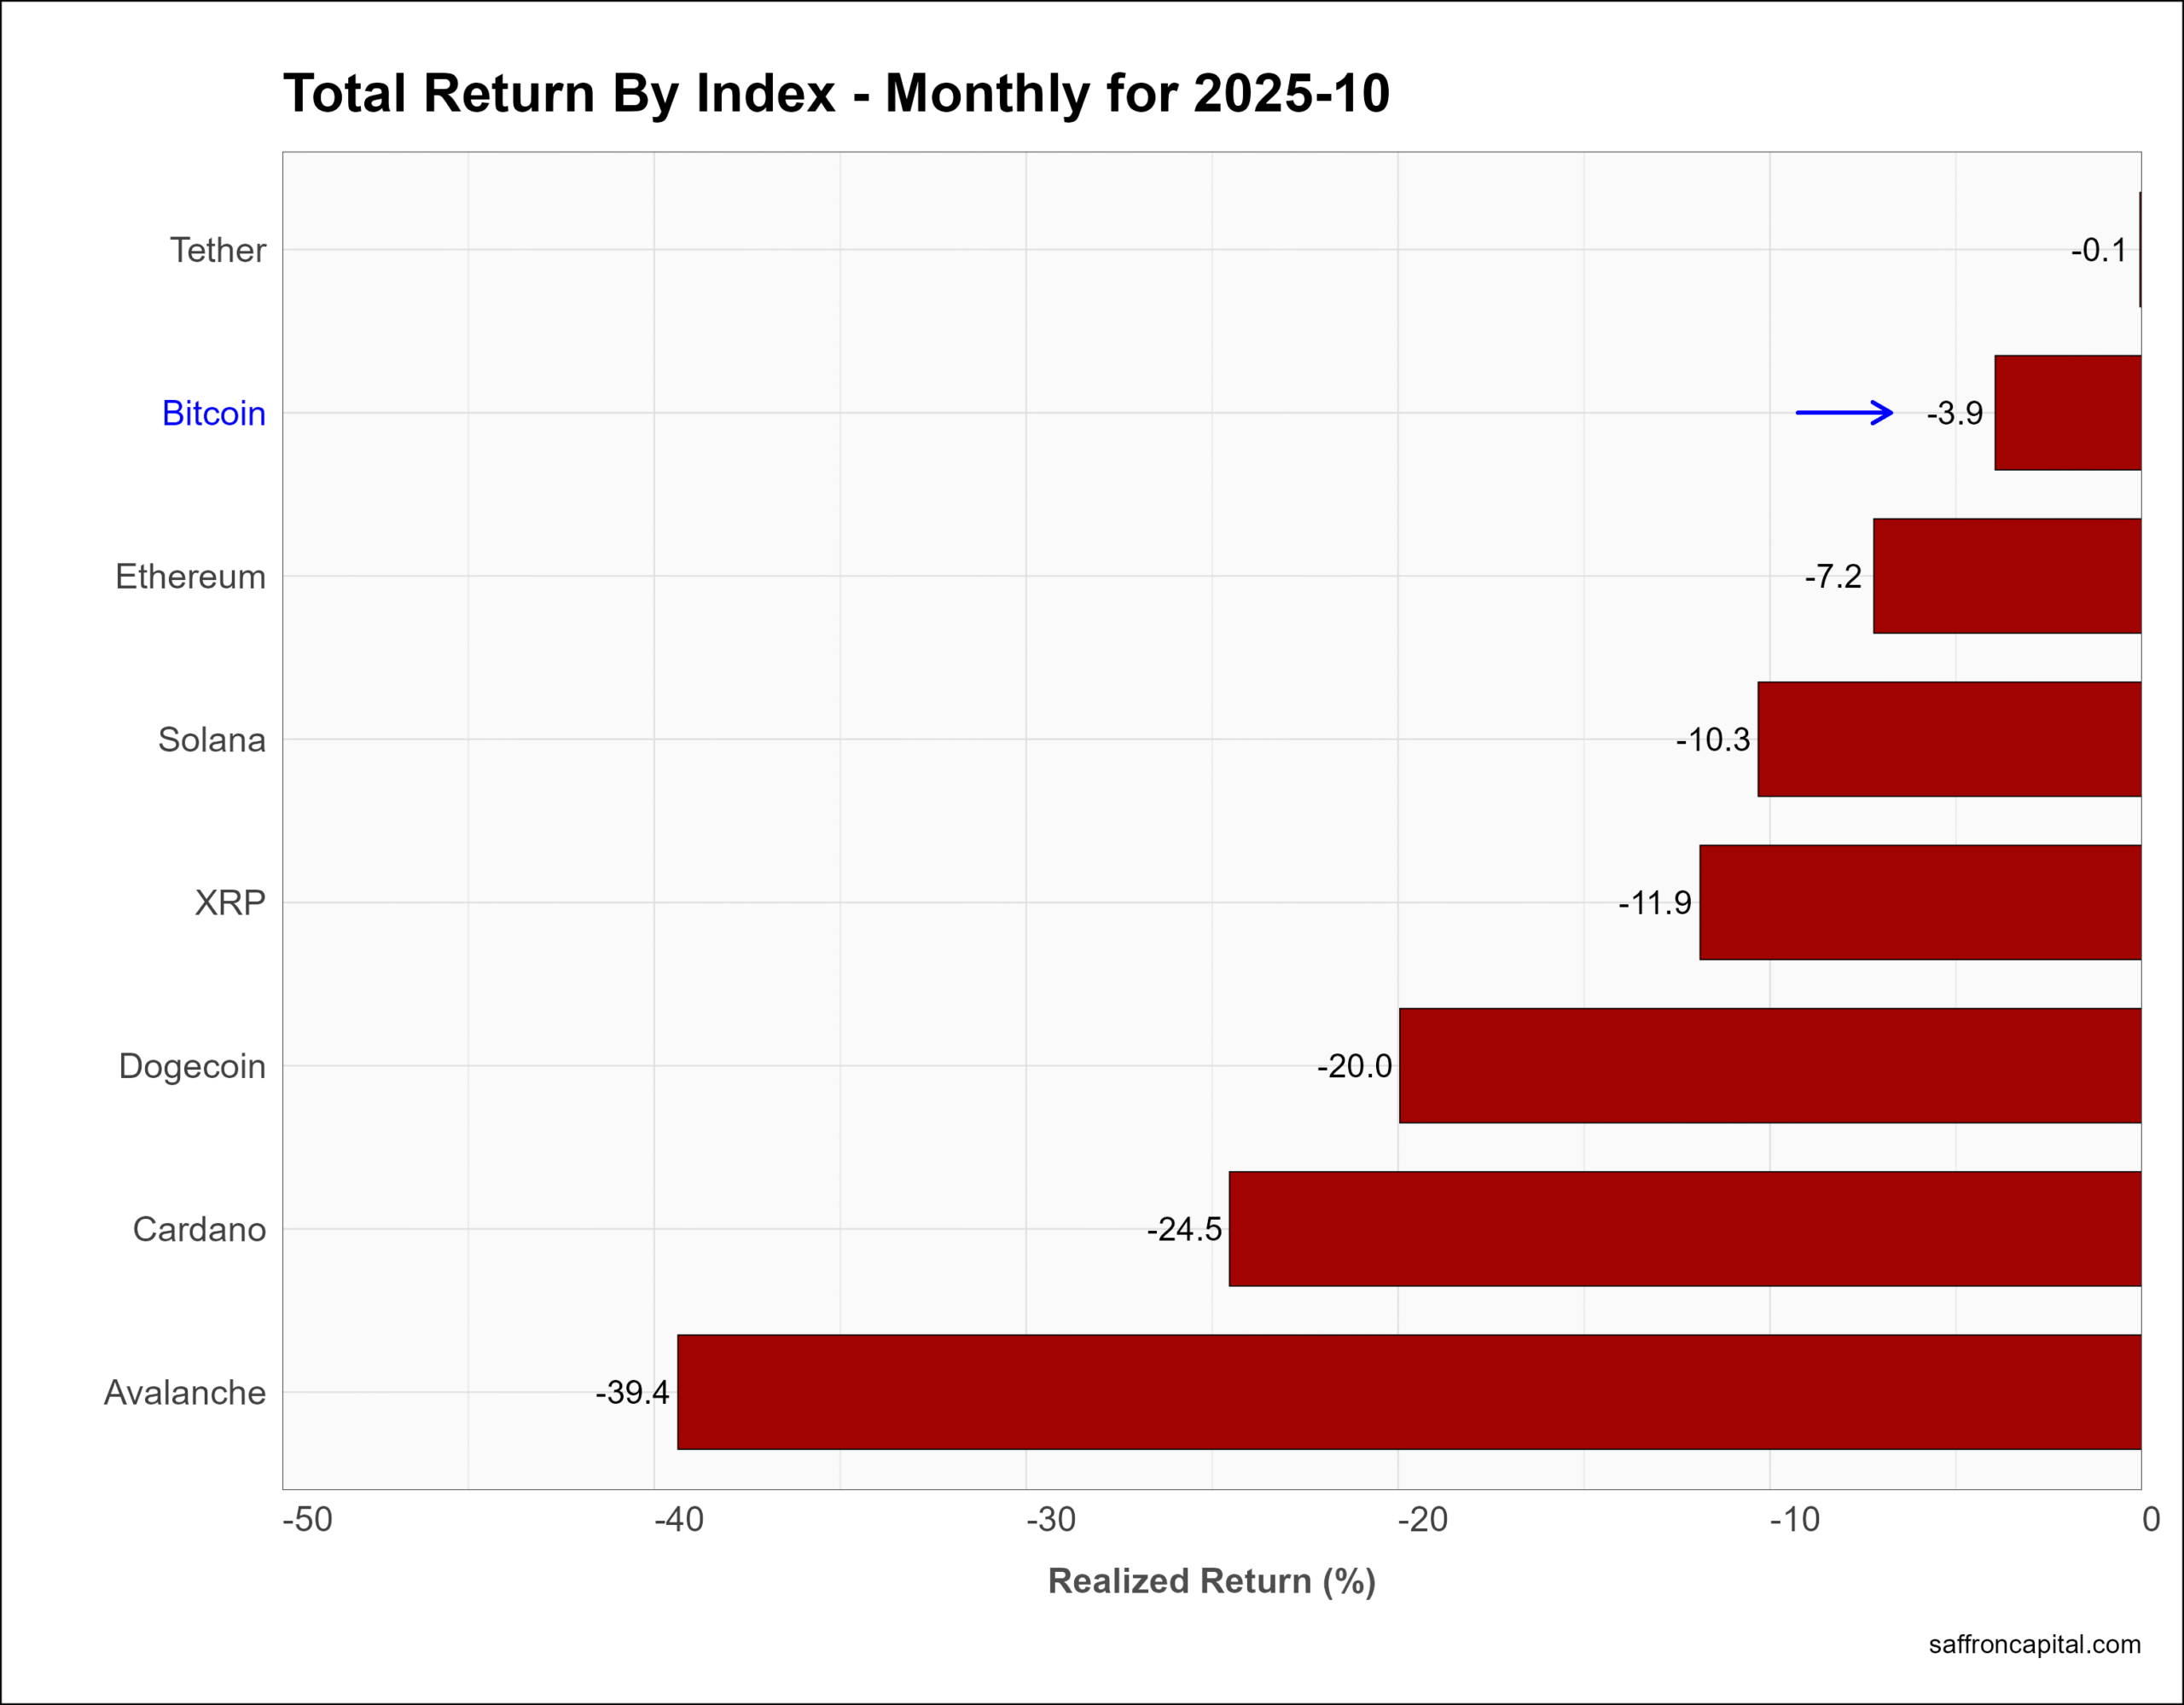
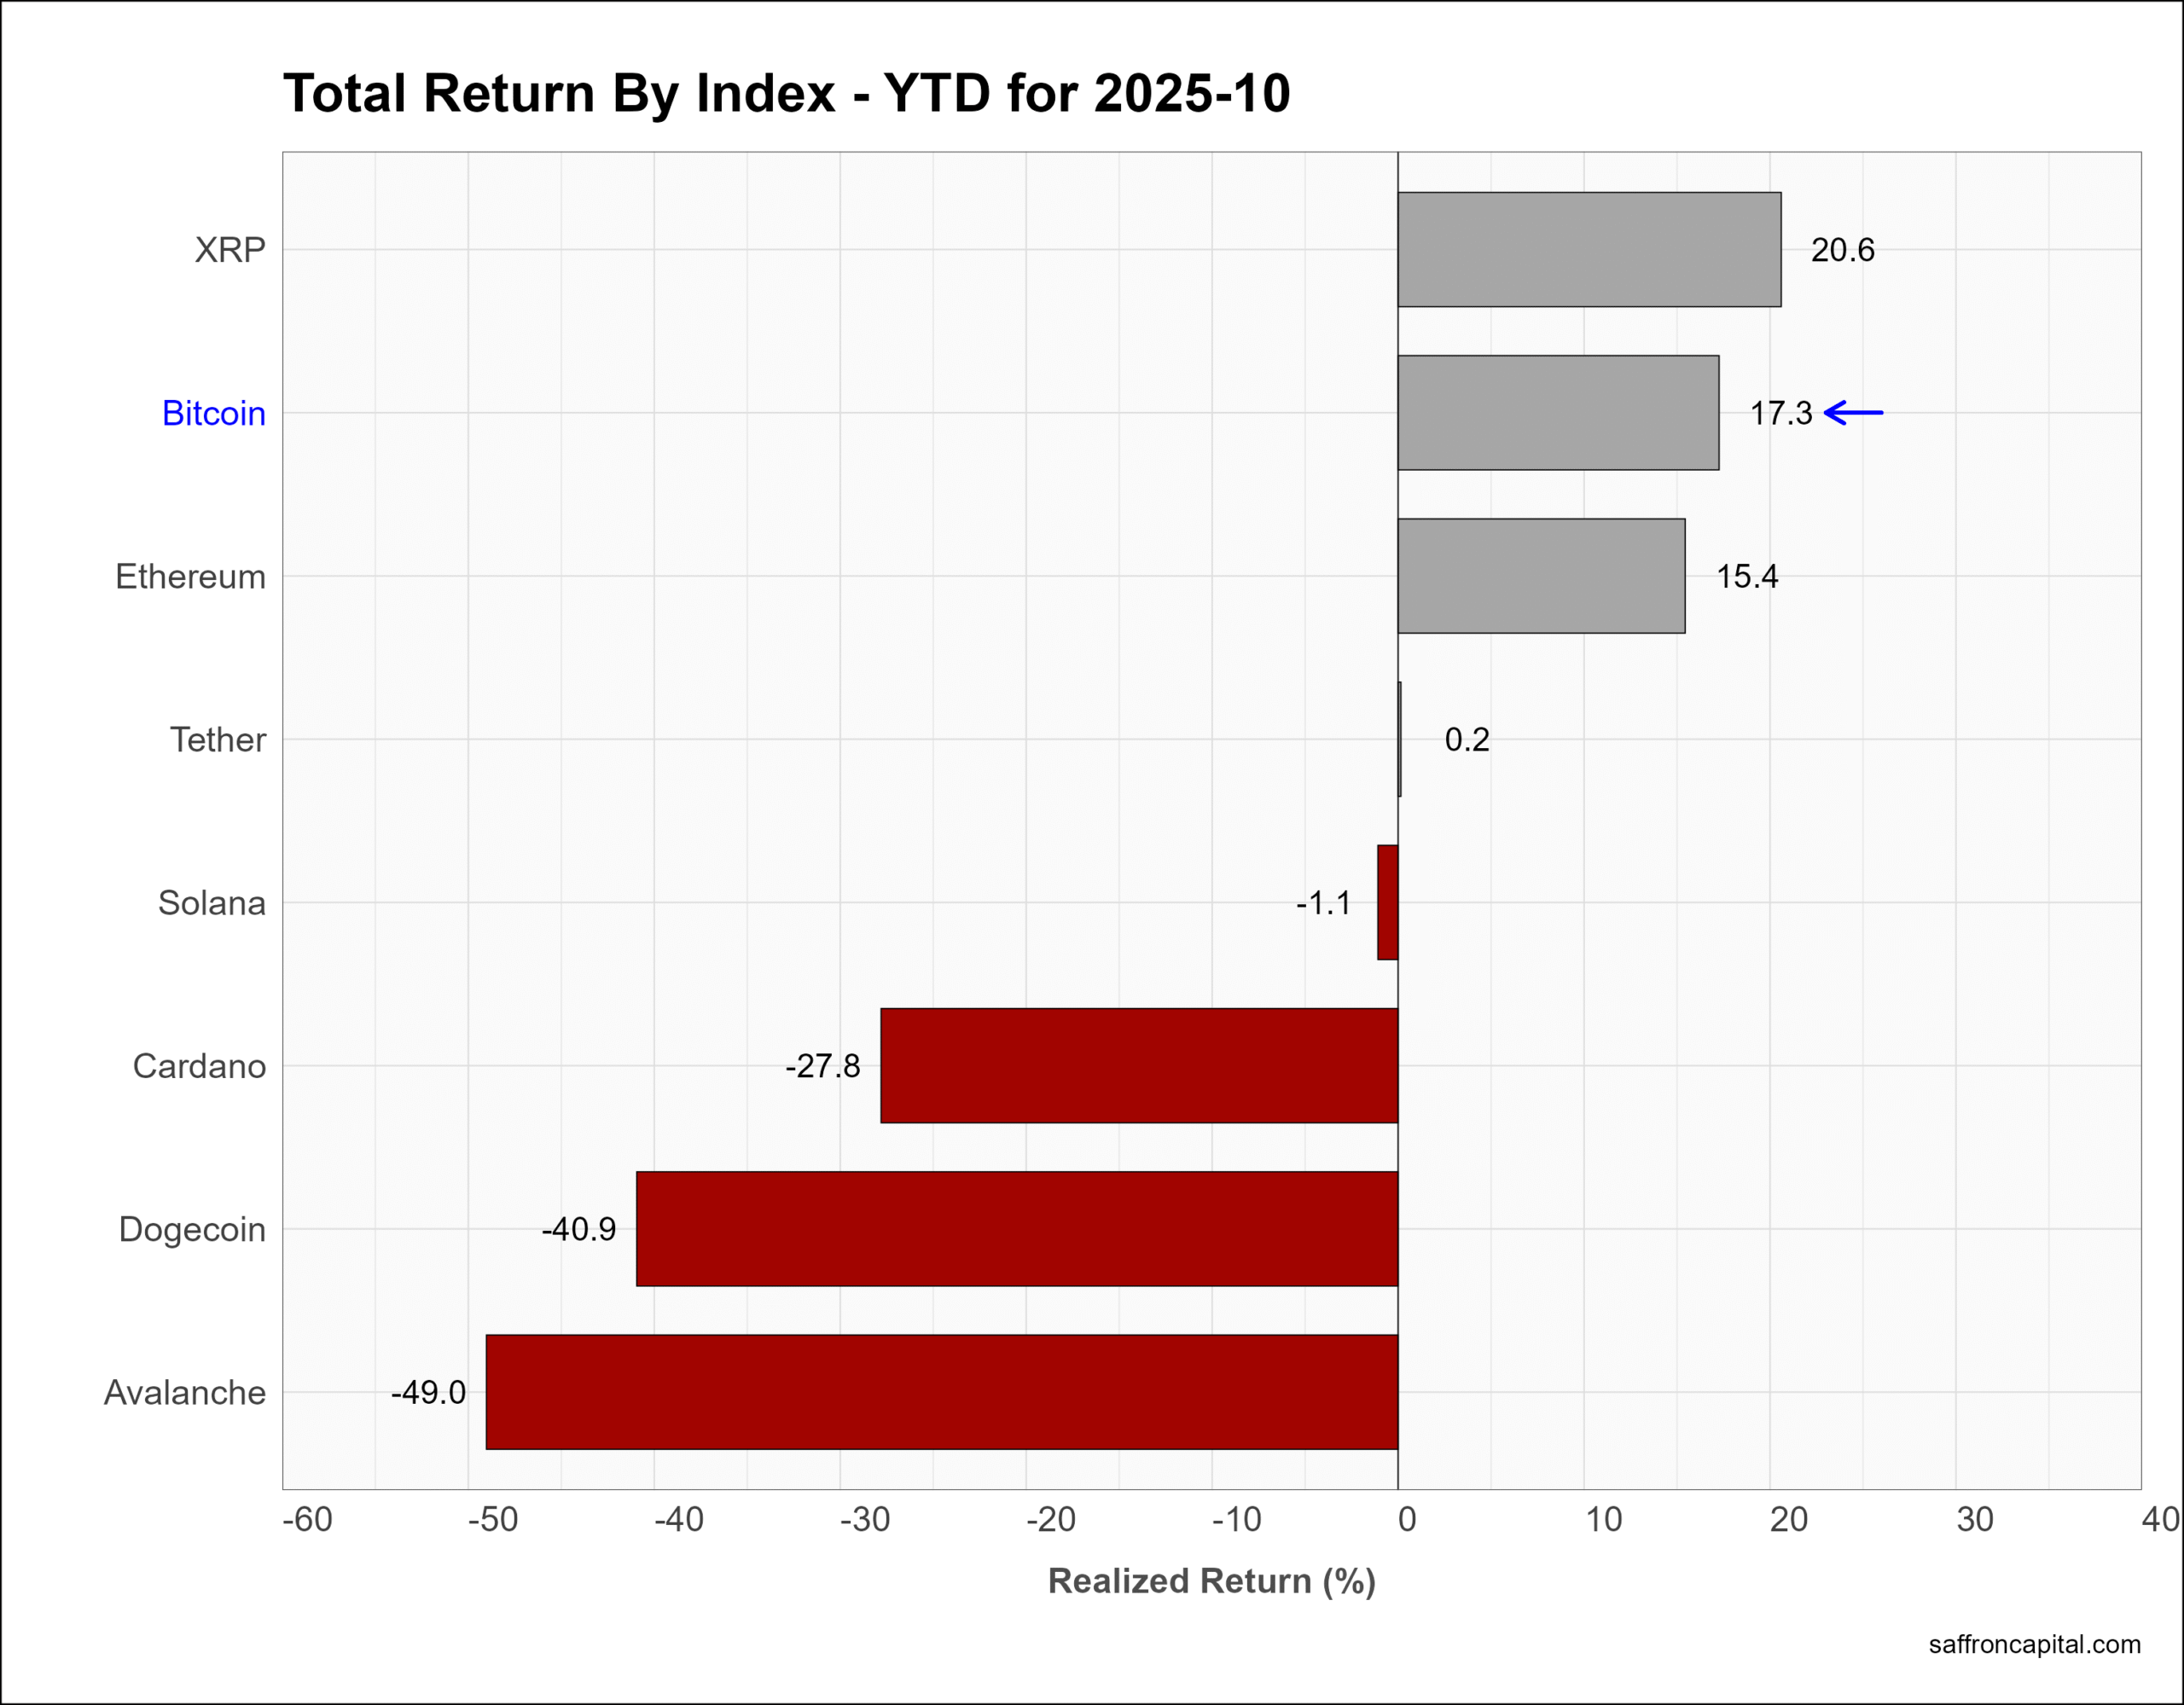
Cryptocurrencies
Benchmark Bitcoin (-3.9%) was down in October with Avalanche (-39.4%) and Cardona (-24.5%) losing large. Over the last ten months, Bitcoin (+17.3%) is solidly outperforming US stocks but is still trailing Gold (+51.5%).
Click to enlarge
Have questions or concerns about the performance of your portfolio? Could you benefit from a capital preservation strategy or a custom portfolio formulation that better aligns to your return goals and risk appetite? Whatever your needs, we are here to listen and to help. Contact us here.
Saffron Capital LLC is a registered investment advisor that provides guided growth and risk-managed portfolios. The company is employee-owned and Minnesota-based.


