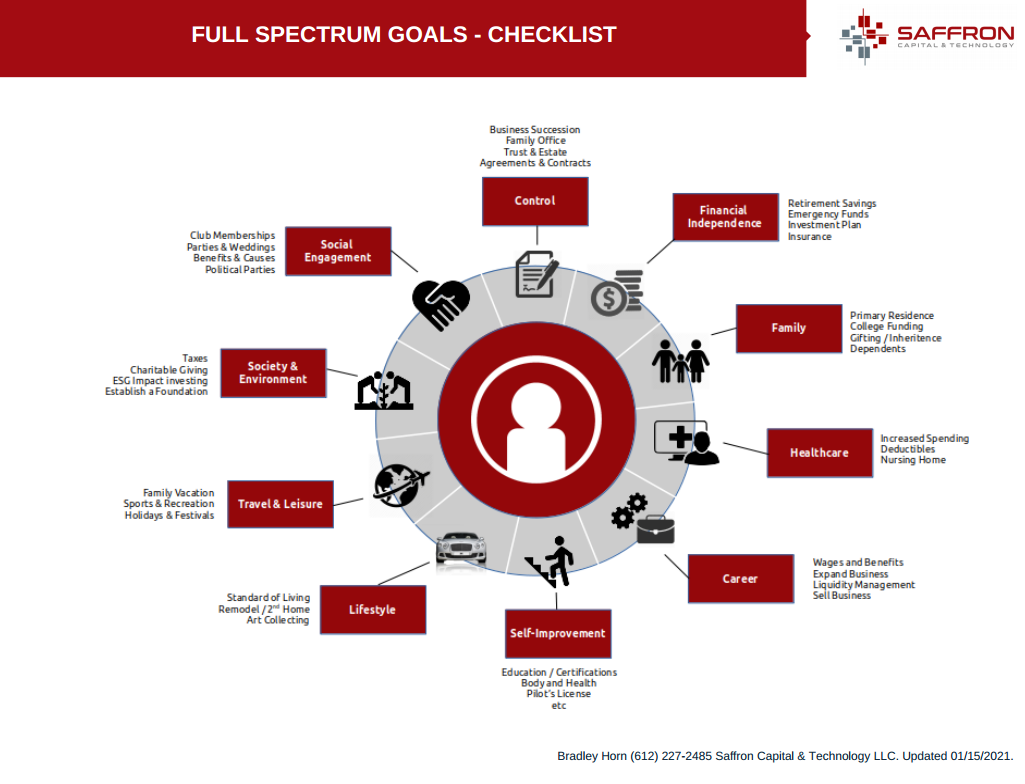
Full Spectrum Goal Planning
January 15, 2021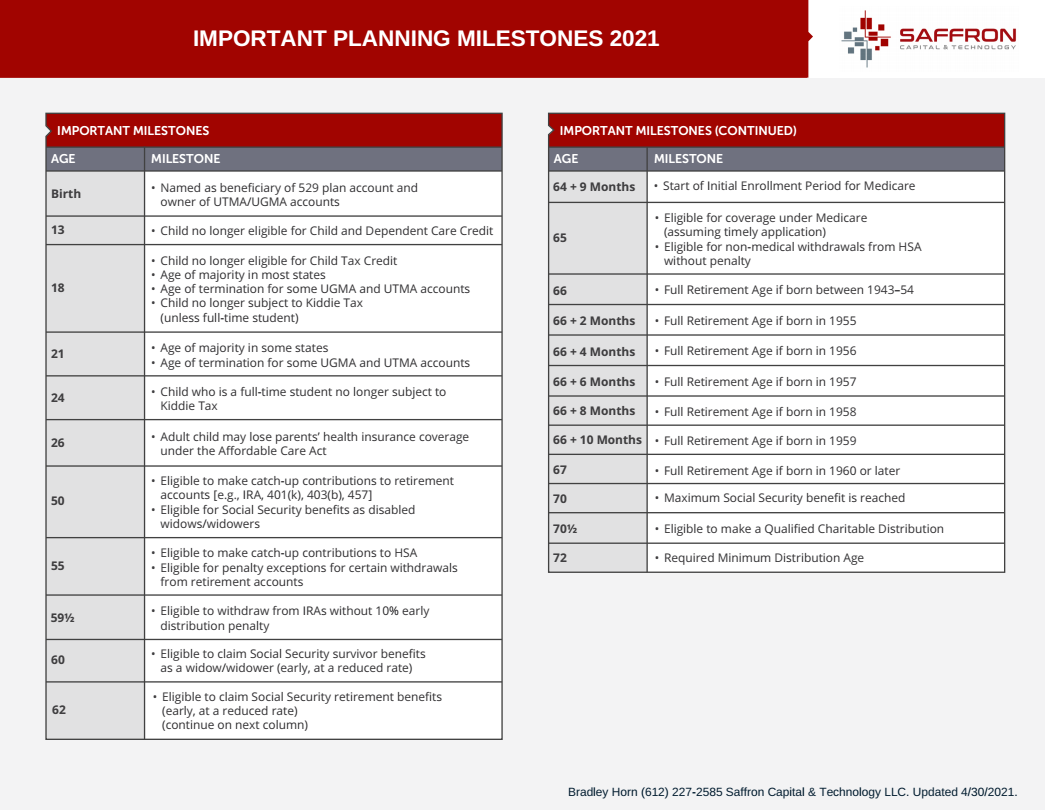
Important Planning Milestones 2021
April 30, 2021
With the start of the new quarter, a top-down market analysis is applied to define the outlook for equities in Q2. The goal is to understand what market sectors are most likely to drive stock market performance as the economy transitions from a recovery phase into an expansion phase. Additional data analysis is applied to uncover potential industries and companies for investment.
A look Back to 2010 – The Analog Year
The recovery of stock market prices in 2020/2021 is eerily familiar to the price trend of 2009/2010. In particular, the strength of the recent market recovery over the past year appears similar to that of 2009/2010 as shown in the chart below:
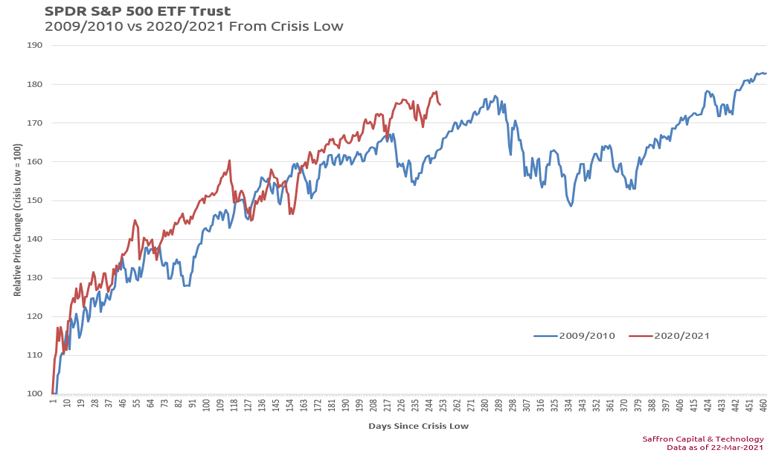
Ironically, investors may find it harder to generate the kind of returns we saw last year when the pandemic was at its worse. History suggests that year two of the bull market may resemble the performance of 2010. In this scenario, after the stunning 75% return from the 2020 lows, stocks are likely to take a breather, much as they did in the second quarter of 2010.
Volatility – But With Compelling Opportunity
The Q2 Financial Market Outlook assumes we should brace for a lot more stock market volatility in 2021. 2010 also suggests the second year of the bull market could be historically positive. By way of explanation, the economy is entering a new phase with growth rates and interest rates subject to change. With these variables in motion, company cash flow valuations become uncertain and price volatility naturally follows. This was also the case in 2010 as the economy completed its early recovery phase. 2010 saw drawdown events as large as 14% in the S&P 500. To date, we have seen a 5% decline in the S&P500 while the uber expensive NASDAQ dropped 12%. With 2010 as a guide, expect larger declines in the S&P500 and potentially worse for the NASDAQ.
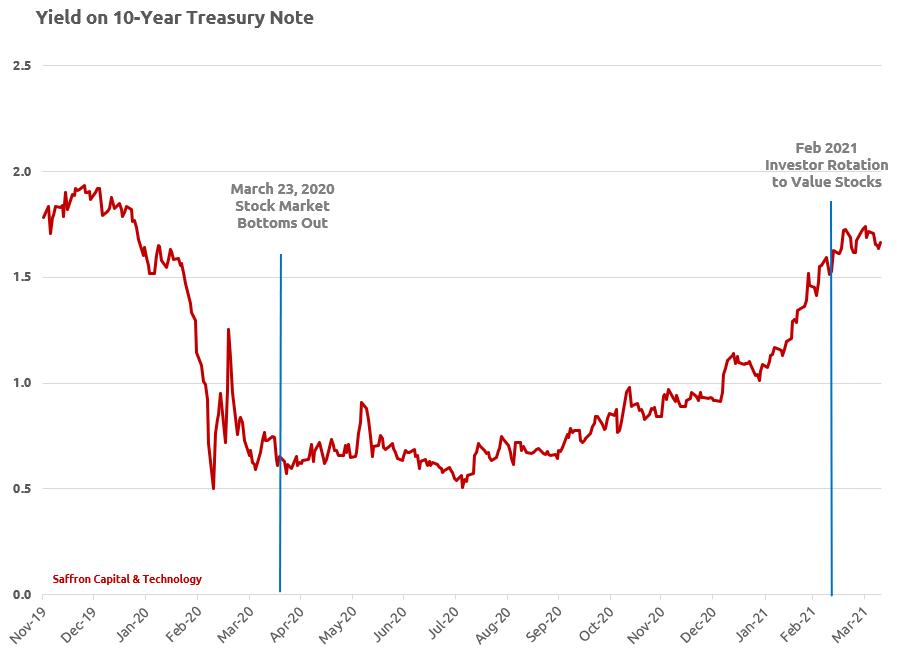
Why the 10-Year Note Matters
Rising interest rates are particularly problematic for growth and technology companies. It starts with basic cash flow modeling. Growth companies generate earnings that tend to be further out in the future. Rising yields increase the value of current earnings and discount future cash flows. As a result, Technology valuations are more vulnerable to rising rates. The chart at right shows the recent trajectory of interests rates.
Major Sector Rotation Underway
Investors’ are changing their focus and a major rotation is underway with regards to sector ownership and investment styles. In particular, tactical investing is shifting to focus on those sectors that will benefit most from economic expansion and strong consumer spending. The change in investment styles will involve a basic migration from growth to value stocks as interest rates rise. Market data already confirms these changes. The chart below compares the performance of the S&P 500 Growth Index to the S&P500 Value Index.
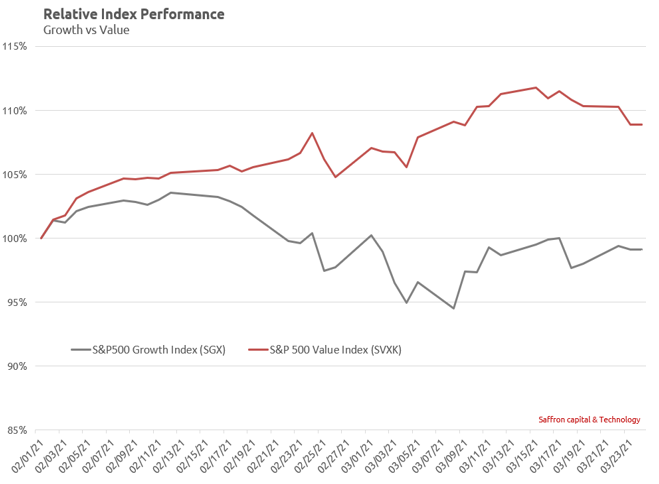
Since February 1, value stocks have appreciated almost 10% while expensive growth stock have had negative returns. The trend impacts both large cap and small cap stocks. Year-to-date, the Russell 1000 Value Index is outperforming its growth peer by the widest margin since 2001.
The Business Cycle Playbook
The business cycle playbook defines which sectors of the economy will benefit most as the economy expands in Q2.
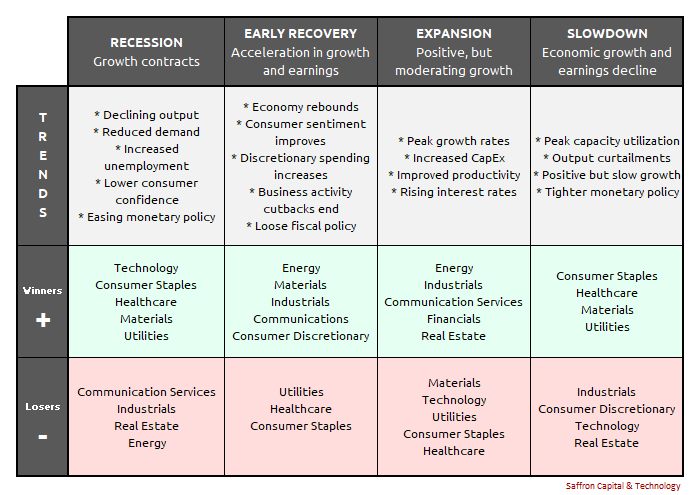
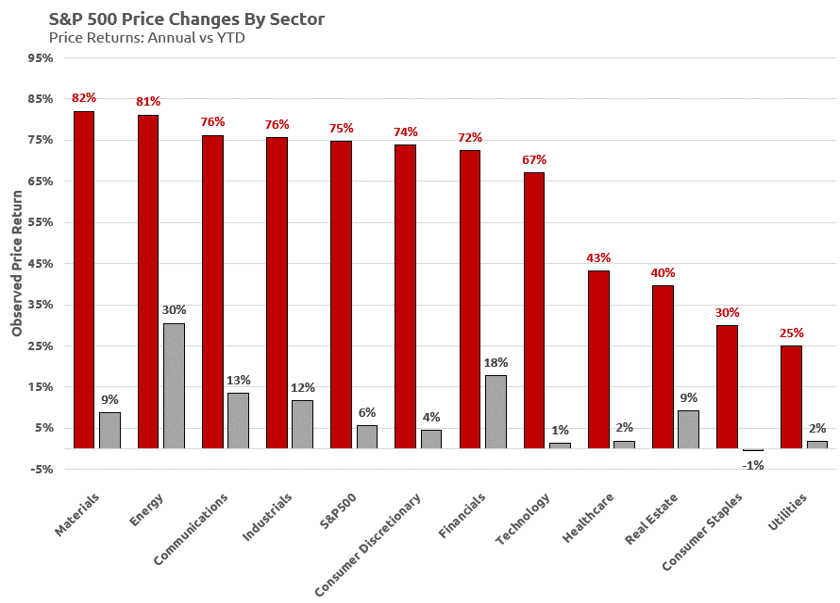
The Q2 Financial Market Outlook assumes that the US economy is currently in transition from Early Recovery into the Expansion phase albeit with higher than normal unemployment. So how reliable is the cyclical playbook for picking stock market winners and losers? The chart below compares the return performance of the S&P 500 Select Sectors on an annual and year to data basis. Annual returns are a good proxy for the Early Recovery phase just completing and YTD earnings show the emergence of the early Expansion phase. The results confirm that the business cycle playbook that drives stock market returns is alive and well!
Q2 Outlook By Sector
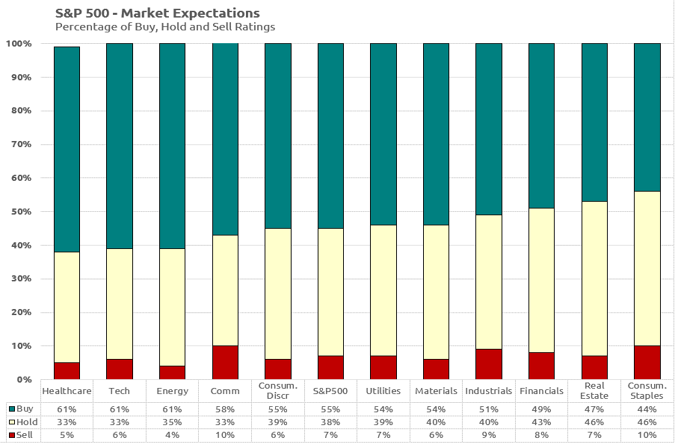
The business cycle playbook is just one tool to determine what sectors are most likely to succeed. Another tool is to assess future expectations for earnings by sector. To this end, I downloaded 10,374 analyst ratings from FactSet Research Systems and sorted by sector. The ratings, when consolidated for the market as a whole, reveal an outlook that is strongly positive.
- 54.9% of shares have buy ratings,
- 38.2% are hold ratings
- 5.9% are sell ratings.
At the sector level, analysts are most optimistic about Healthcare (61%), Information Technology (61%) and Energy (61%) as these sectors have the highest percentage of buy ratings. On the other hand, market expectations appear to be most pessimistic regarding Consumer Staples (44%), Real Estate (47%) and Financials (49%) as these have the lowest percentage of buy ratings.
Ratings for each of the eleven S&P 500 select sectors are profiled in the graph below:
My personal opinion is that the market ratings still reflect an outlook driven by the Recession and Early Recovery phases of the economy and have not fully adjusted to the newly emerging Expansion Phase. This view has credence given that the average age of the company ratings is two to six weeks old. This bodes well for contrarian investors who follow the business cycle playbook and select cycle sector that are out of favor.
Q2 Outlook – Earnings Insight and Sector Valuations
The SEC requires earnings outlooks by company. The chart below takes management earnings estimates for Q2, consolidates by sector, and then calculates EPS growth rates on a year-on-year (YoY) basis. The sector rankings confirm the expansion phase playbook.

The table below presents EPS growth by sector and explores tactical investing by sub-industries and by company:
| Sector | Q1 Earnings Growth YoY | Q2 Earnings Growth YoY | Details with Sub-Industry Growth Outlooks |
|---|---|---|---|
| Industrials | (15.9%) | 326.9% | The Industrial sector is projected to lead EPS growth for Q2 (326.9%). The following sub-industries are projected to dominate Industrial earnings growth in Q2: Aerospace and Defense (328.1%), Industrial Conglomerates (256.3%), Road and Rail (54.1%). Companies with the largest projected earnings growth for Q2 include: TXT, RTX, HII, GE, CTAS, CAT, CMI, PCAR, NSC, KSU |
| Energy | (14.4%) | 278.8% | The Energy sector is expected to report the largest negative earnings of any sector in Q1. However, Q1 earnings estimates also experienced the largest positive EPS revision of any sector in Q1, increasing from -64% at the start of the year. During the same period, the sector ETF increased 30%, before retreating in recent days. Energy also enjoys the second highest projected EPS growth outlook for Q2. It should be noted that management outlooks are very tentative for this sector given uncertainty with crude oil prices and the low number of earnings reported. Notwithstanding, the following sub-industries have the strongest EPS growth rate for Q2: Energy Equipment Services (997.5%), Oil Gas & Consumable Fuels (178.6%). Companies with the largest projected EPS growth announced for Q2 include: BKR, COG, FANG, OKE, PXD. |
| Consumer Discretionary | 105.2% | 205.1% | The Consumer Discretionary sector is expected to report the highest Q1 year-on-year earnings growth of all eleven sectors at 105% combined with expanded growth of 205% on Q2. Nine of ten industries in this sector are expected to report double-digit earnings growth: Automobiles (1,152%), Textiles, Apparels and Luxury goods (483%), Specialty Retail (231%), Internet and Direct Marketing (84%), Household Durables (72%), Auto Components (34%). Hotels, Restaurants and Leisure (-623%) is the only sub-industry in this sector that is handicapped. Companies with the largest projected EPS growth include: APTV, TSLA, F, CMG, LEG, MHK, WHR, HAS, KMX, ROST, BKNG, MAR, HLT, ROST, TJXT, RL. |
| Financials | 66.9% | 93.0% | The Financial sector is expected to report the second highest (year-over-year earnings growth of all eleven sectors at 66.9% followed by 93% in Q2. At the industry level, all five industries are predicted by company management to grow: Banks (130%), Capital markets (31%), Insurance (7%) and Diversified Financials (2%). Consumer Finance numbers are not available owing to zero growth previously (resulting in a divide by zero error). Companies with the largest projected EPS growth include: C, FITB, KEY, USB, ZION, SCHW, SYF, RE, WRB. |
| Materials | 46.2% | 78.6% | The Material sector is expected to achieve the third highest (year-over-year) earnings growth of 46.2% in Q1 followed by a strong increase to 78.6% in Q2. At the industry level, all four industries are predicted by company management to grow: Metals and Mining (492.0%), Chemicals (21.9%), containers and Packaging (16.19%), Construction Materials (4.2%). Companies with the largest projected EPS growth include: EMN, IFF, LYB, MOS, PPG, FCX, NEM, NUE. |
| Communication Services | 13.9% | 30.6% | The Communications Services sector is expected to achieve (year-over-year) earnings growth of 13.9% in Q1 and 30.6% in Q2. The economic business cycle projects strong growth. The sector weights don’t confirm that, but the sub-industry performance is compelling. At the industry level, all five sub-industries are predicted by company management to grow: Wireless Telecom Services (585.5%), Entertainment (88.9%), Interactive Media & Services (65.01%), Media (2.7%), Diversified Telecommunications (1.3%). Companies with the largest projected EPS growth include: TMUS, DIS, GOOGL. |
| Technology | 21.4% | 19.5% | The Technology sector has recorded the fourth-largest increase in EPS growth rates due to CFO revisions of all eleven sectors since the start of the year (to 21.4% from 11.7%). Despite increased performance, the sector has witnessed negligible price appreciation and that was in the last week. At the industry level, earnings growth for Q2 is expected to moderate with only a few sectors showing material new growth: Electronic Equipment Instruments & Components (48.0%), Semiconductors & Semiconductor equipment (28.9%), IT Services (21.9%). Companies with the largest projected EPS growth announced for Q2 include: TEL, DXC, AMD, ENPH, XLNX, QCOM |
| Real Estate | 1.1% | 10.9% | The Real Estate Sector had negliigble growth in Q1 and the EPS growth in Q2 will be modest relative to other sectors. However, one sub-industry stands out Real Estate Management & Development (95.9%) given earnings guidance form management. Companies with the largest projected EPS growth announced for Q2 include: CBRE |
| Healthcare | 19.8% | 10.7% | The Healthcare sector projects returns that would be healthy for any normal year, but 2021 is not normal and projected EPS numbers are low on a relative basis. This is surprising despite key companies developing COVID-19 vaccines in record time and pushing aside worries over drug regulation. At the industry level, earnings growth is expected to be notable in Q2 for only one industry Healthcare Equipment & Supplies (90.7%) . Companies with the largest projected EPS growth announced for Q2 include: ABT, BSX, HOLX, ISRG, SYK, ZBH, DGX, LH, VTRS |
| Consumer Staples | 0.9% | 6.3% | Consumer Staples had negligible growth in Q1 and is expected to have relatively low growth in Q2. At the industry level, earnings growth is expected to be notable for the beverages industry (19.9%) as restaurants and social venues open. The following companies have the highest earnings growth potential, recognizing relative growth is expected to be modest: KO, WBA |
| Utilities | 2.7% | 2.6% | The Utility sector an anemic growth outlook for both Q1 and Q2. This is true of the 5 sub-industries as well with the exception of a good outlook in Q2 for Independent Power and Renewable Electricity Producers (24.6%). Companies with the largest projected EPS growth announced for Q2 include: AES |
Risk Disclosure
The Q2 Financial Market Outlook represents my personal views. Meanwhile, I own the following shares mentioned in the report: BKR, PXD, WHR, FCX, NUE, TMUS, BSX. Prior to publication, the report was shared with private clients from whom I receive compensation. They too may own some of the shares mentioned in this report.
Blog posts are not a solicitation to buy or to sell any securities. Solicitations are only made in person and subject to an advisory contract in place which takes into account the investor’s full spectrum goals, assets, investment policy and tax strategy. To these ends, you can contact me here.
This report does not provide financial planning or tax advice. It is the reader’s responsibility to consult with a financial planner, investment advisor or tax professional before undertaking any investment.
Out of necessity, the report relies on economic surveys, forecasts or projections. Future projections are an important and valid tool for input into investment decisions. However, economic or market projections do not reflect actual knowledge of the future. Future projections, like past performance results, are no guarantee of future investment results or cash flows.
Investments in stocks, bonds, mutual funds, exchange traded funds and other securities may be risky and may be subject to loss of equity or of principal.


