February 2023 returns reversed the momentum seen in January with losses across equities, credit, sovereign bonds, and commodities. The S&P 500 Index (-2.3%) lagged behind the NASDAQ index (-0.7%), but managed to outperform international developed markets (-3.35). European equities (–2.5%) proved more resilient. It is noteworthy that for all of 2023 developed market equities (+5.3%) leads the the S&P 500 index (+3.4%) many European markets posting double-digit gains. In fixed income markets, the Aggregate Treasury bond index (-2.7%) in February was riskier than corporate bond (-1.89%) and infrastructure project bonds (-2.11%). February also saw declines in residential home prices (-0.4%), though losses were limited. Among commodities, year-to-date foodstuffs have gained significantly with Coffee (+13.8%), Sugar (+10.25) and Beef (8.2%) prices topping the list. Finally, the US Dollar (+2.9%) reversed trend in February and outpaced all major currencies.
The following analysis provides a visual record of February 2023 returns across and within the major asset classes and is provided to assist our clients with performance benchmarking.
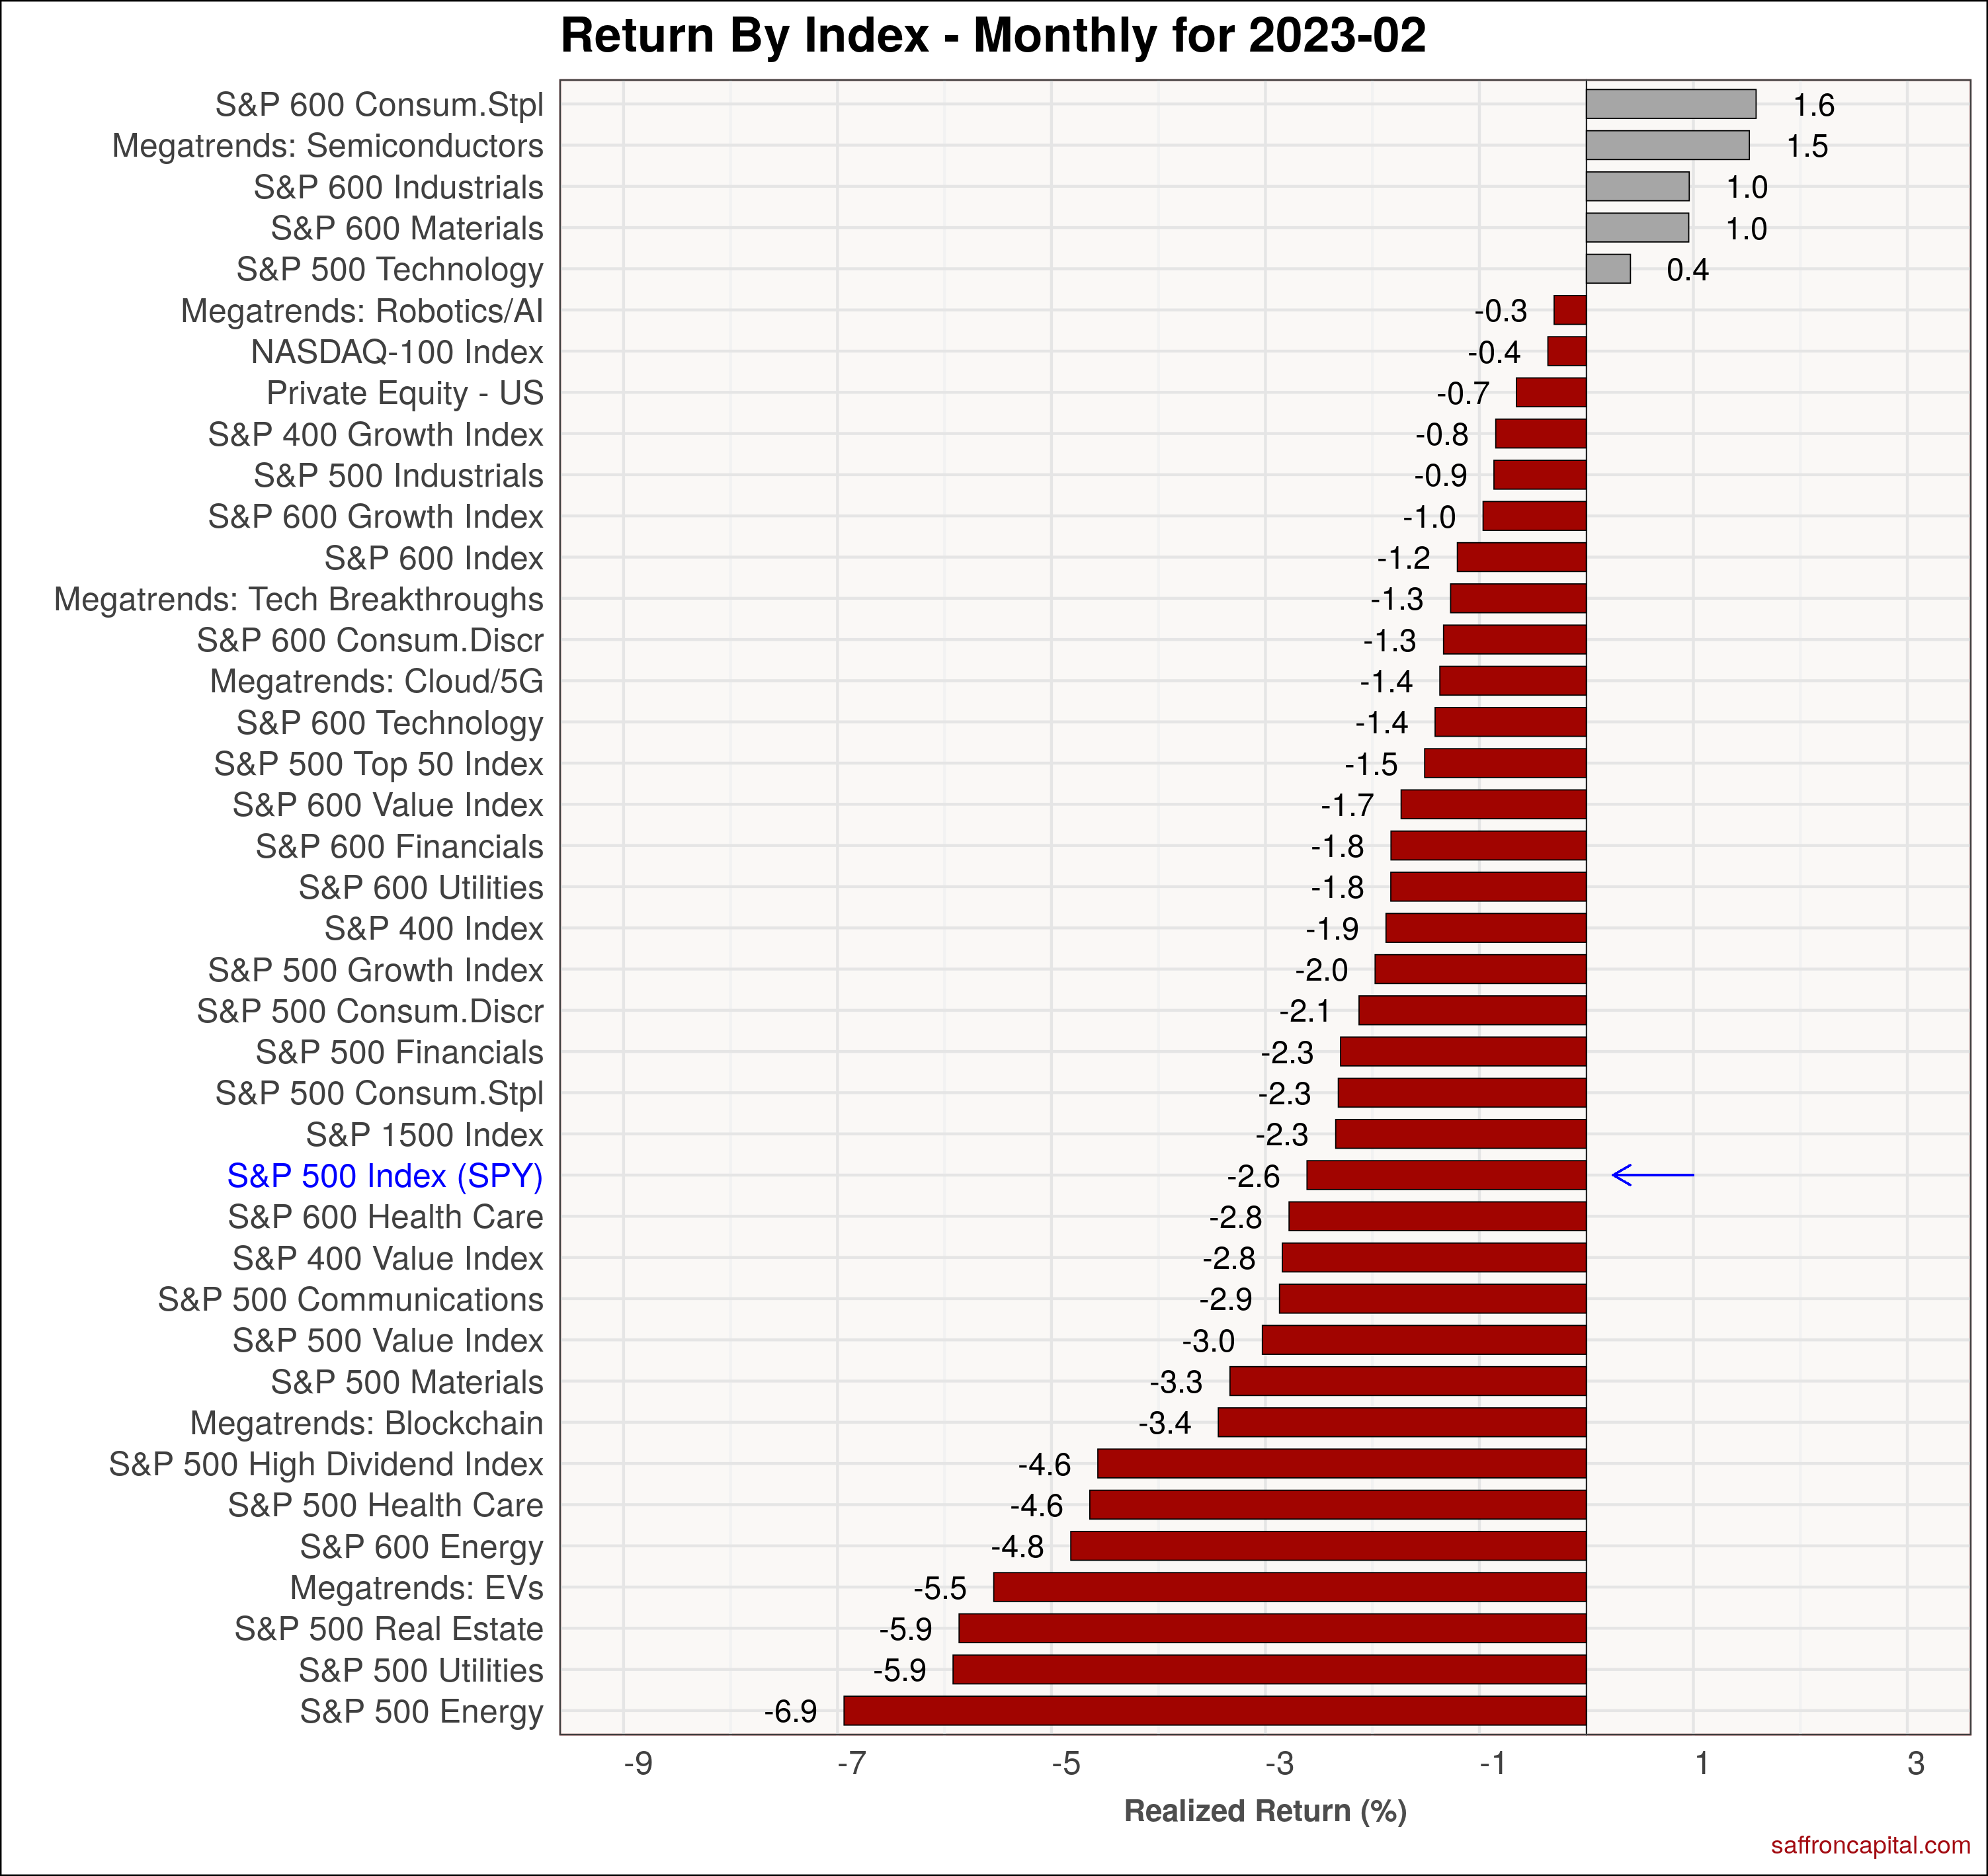
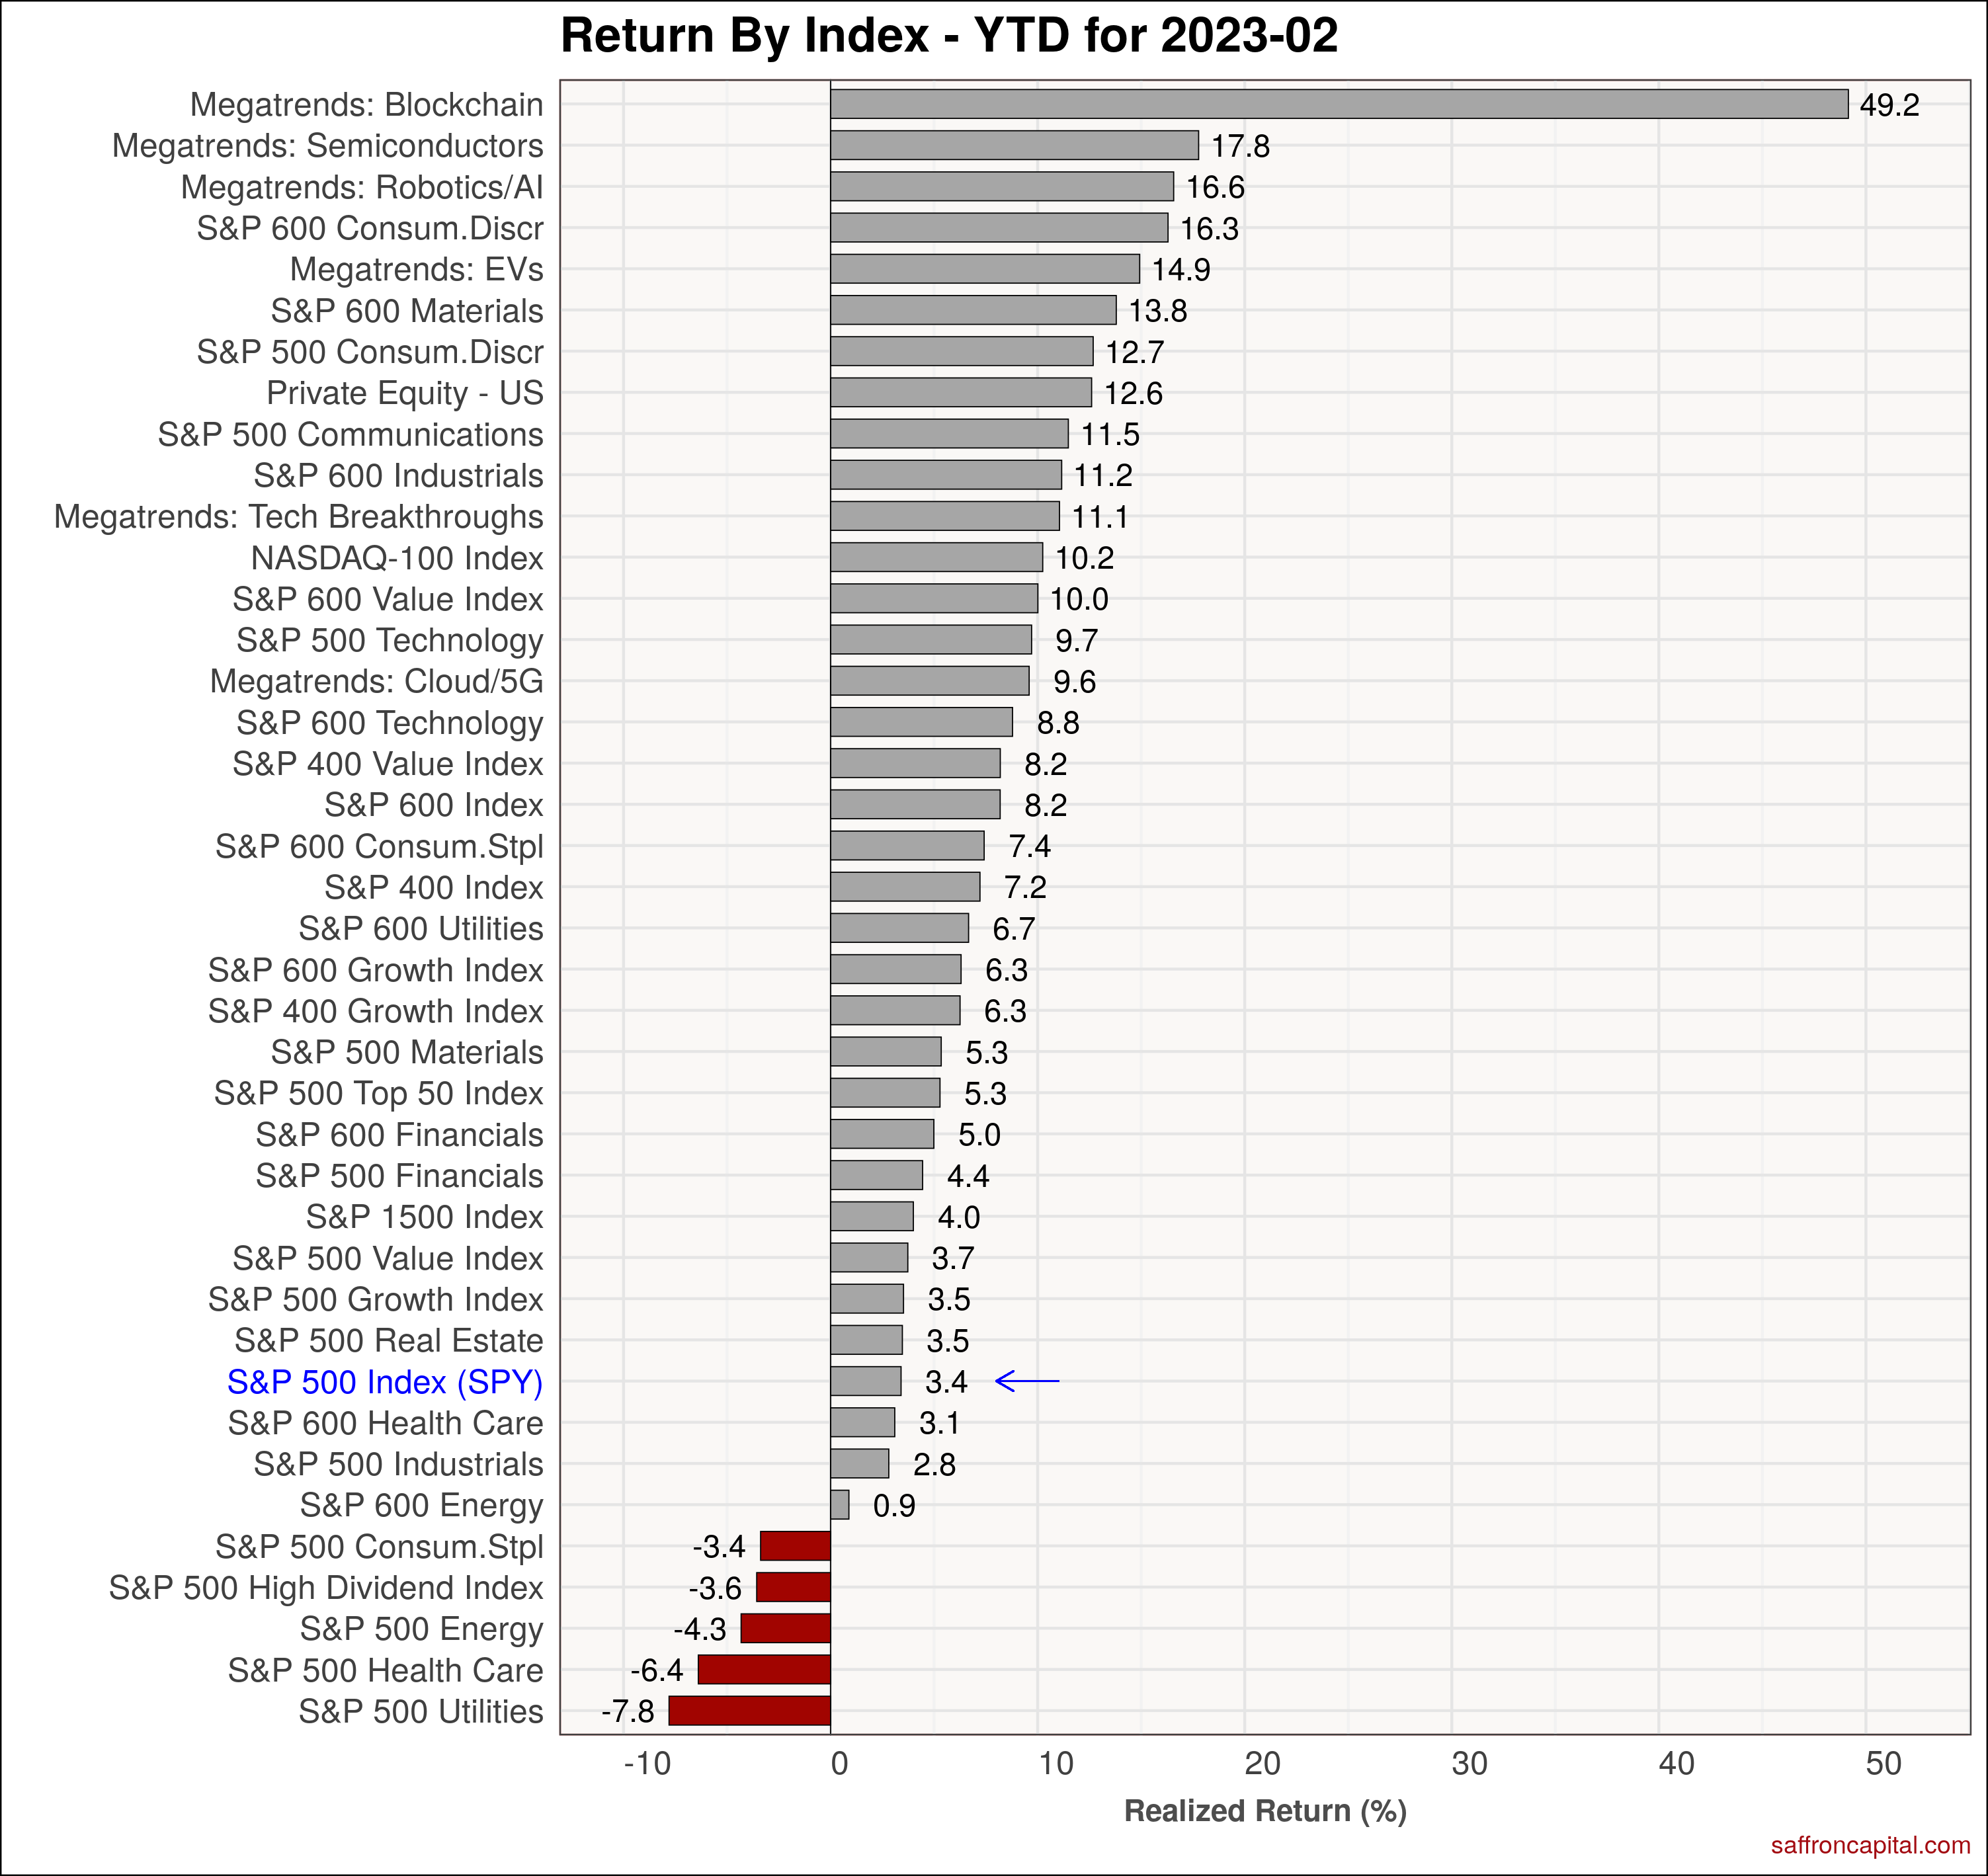
US Equities
The top performing sectors in February were small cap Consumer Staple (+1.66%), Semiconductors (+1.5%) and small cap Industrials (+1.0%). The top large cap sectors included Technology (-0.3%), Industrials (-0.9%) and Consumer Discretionary (-2.1%) stocks. Finally, the S&P 500 Values index (-3.0%) trailed behind Growth (–2.0%) shares. Year-to-date, the S&P 500 index (+3.4%) remain positive. By far, the strongest performance this year is seen in megatrend shares dedicated to Blockchain (+49.2%), Semiconductors (+17.8%), as well as Robotics/AI (+16.6%). The weakest links so foar this year are large cap Energy (-4.3%), Health care (-6.4%) and Utilities (-7.8%).
Click to enlarge
Developed Market Equities
After 3 months of outperforming the the S&P 500 index, international developed markets (-3.3%) lagged the US. Stock markets in Denmark (+1.9%), Spain (+1.9%) and Austria (+1.2%) still managed to put in positive February returns. The worst performers were Israel (-7.3%), Hong Kong (-7.6%), and Australia (-8.0%). Year-to-date, many EU markets have significantly outperformed the US with double digit gains. For example, the MSCI Europe (+10.4%) confirms why other developed markets lead the US this year by 210 basis points
Click to enlarge
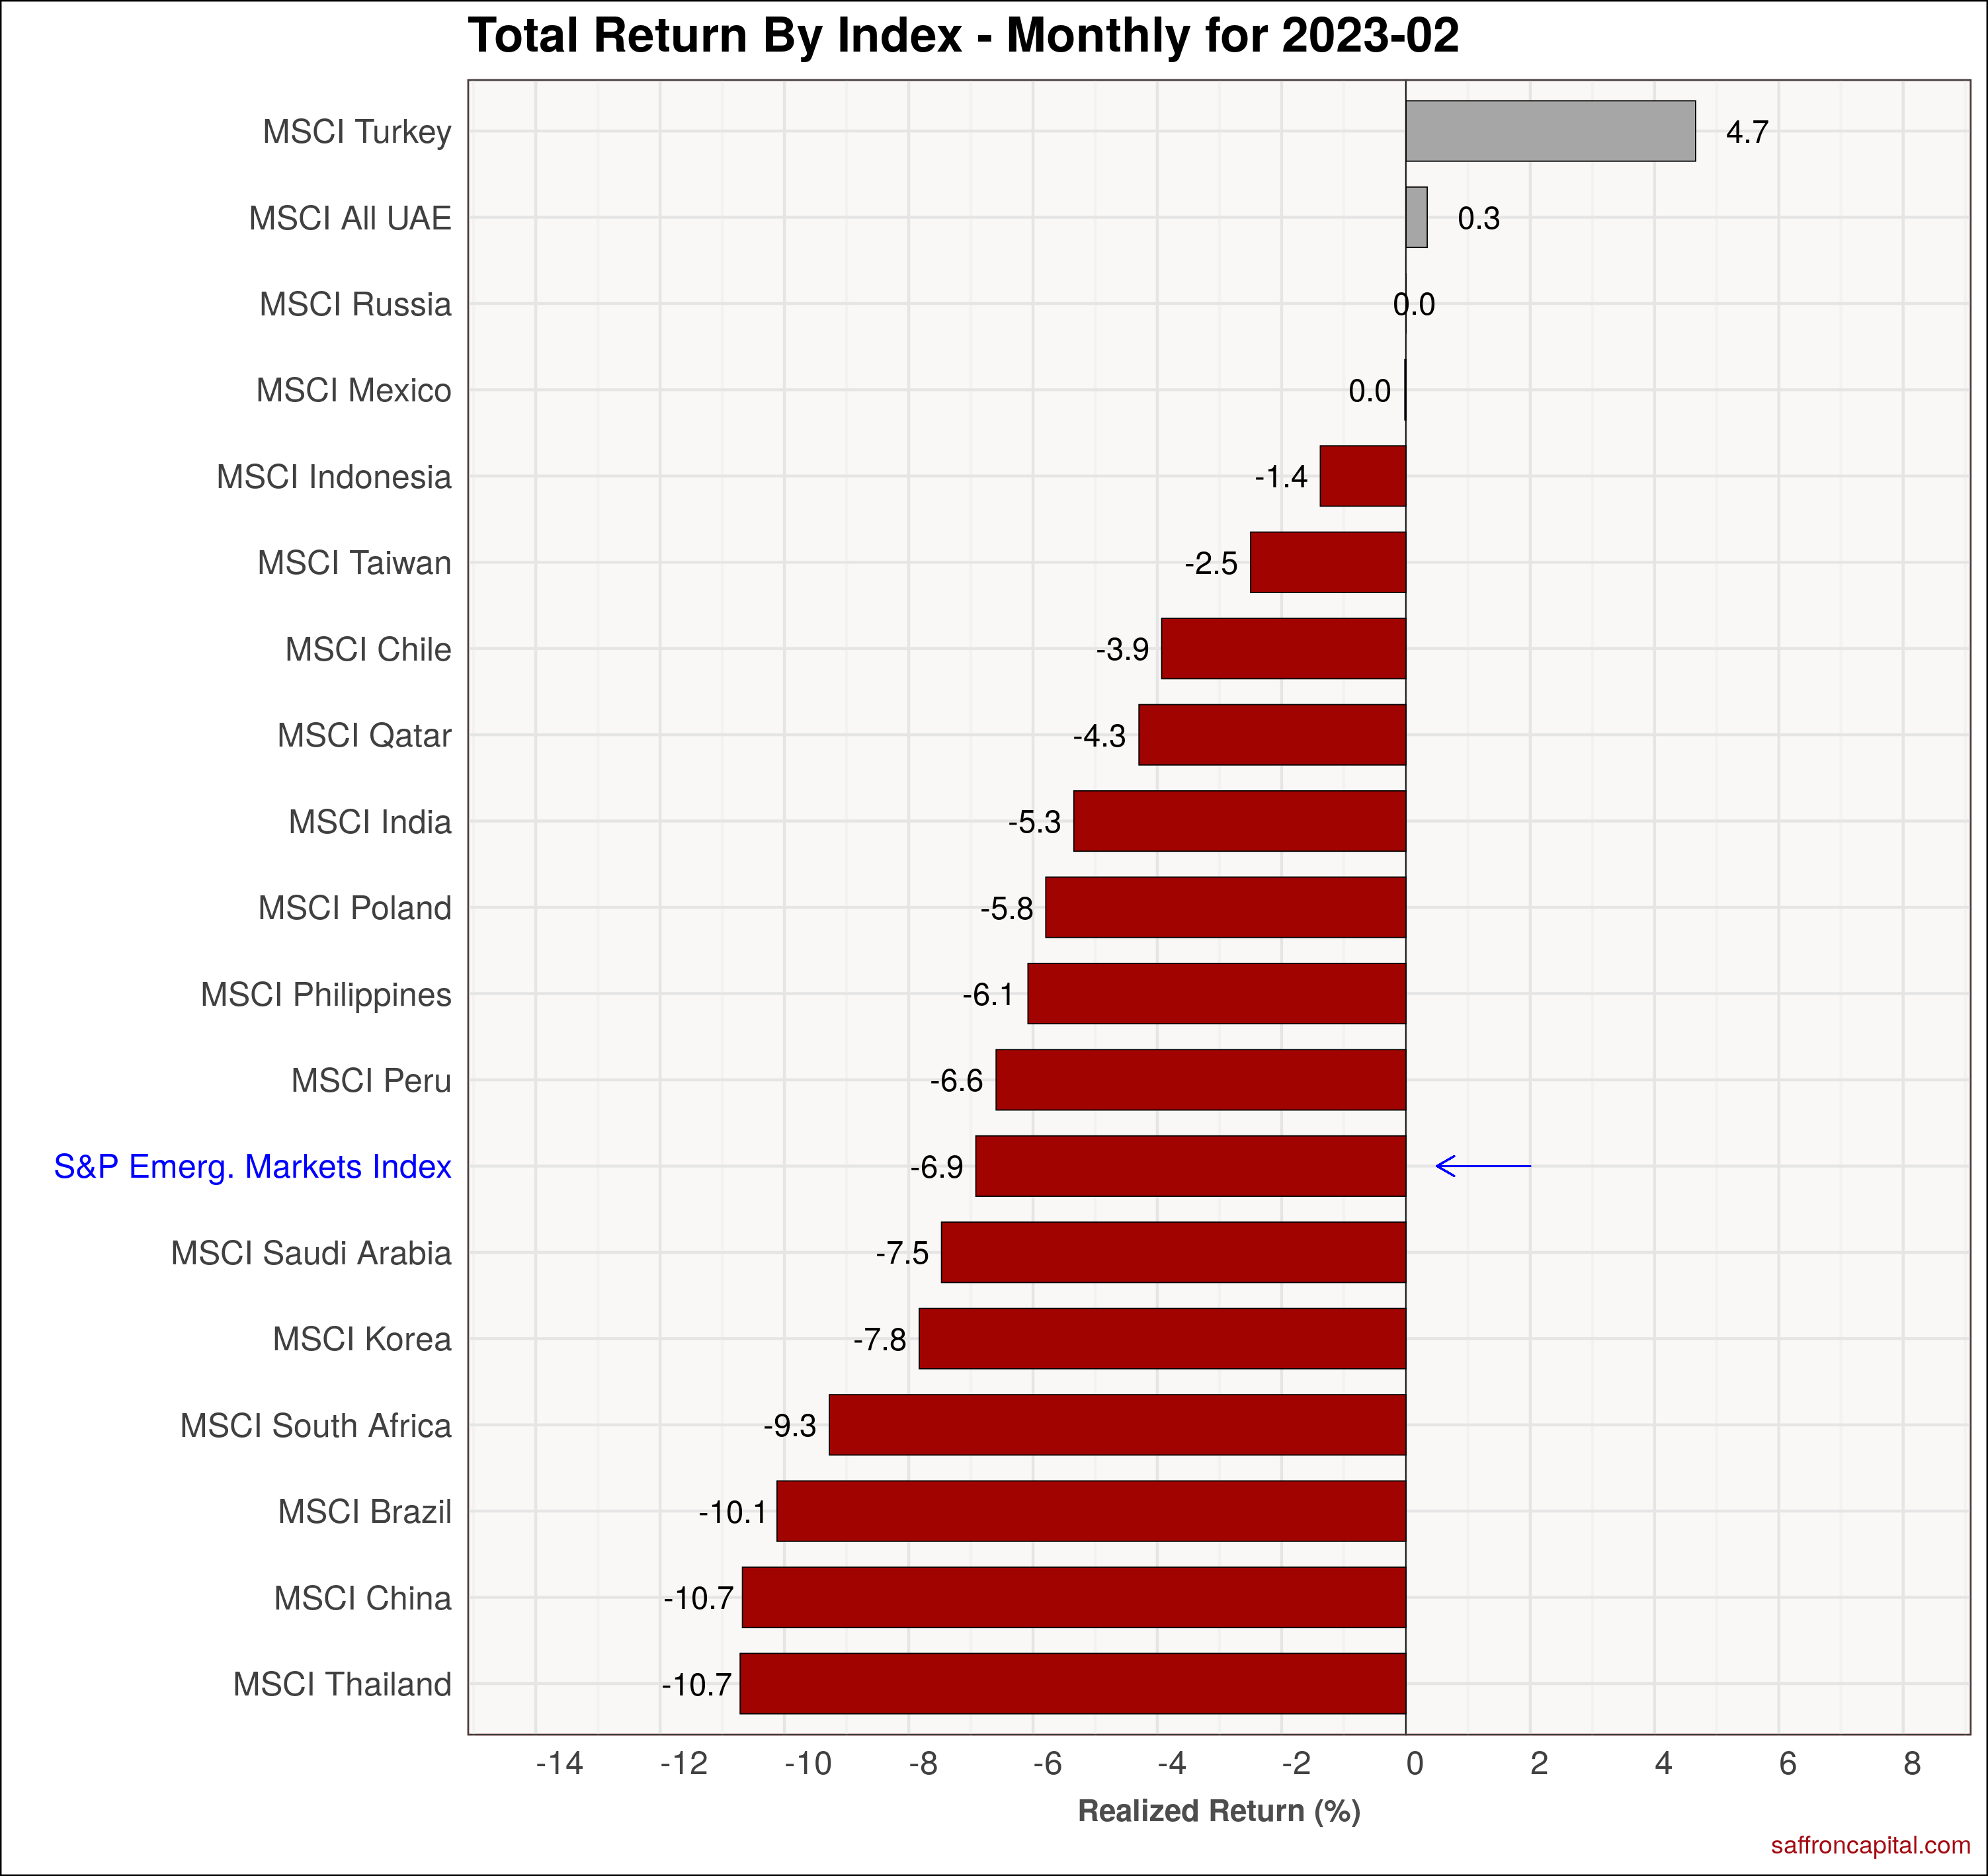
Emerging Market Equities
January 2023 returns for the S&P Emerging Markets Index (-6.9%) the US and other developed markets. Turkeu (+4.7%), UAE (+0.3%) and Mexico (0%) topped the chart, while (Brazil (-10.1%), China (-10.7%) and Thailand (-10.7%) had the largest losses. Year-to-date performance for emerging markets (+1.4%) reflects broadly divergent results. Mexico (+16.6%), Taiwan (+8.8%) and Chile (+3.85) all benefited for high capital investment rates. India (-7.0%) was particular hard hit following losses across Adani group companies.
Click to enlarge
Government Bonds
January returns for government bond markets continued to have steep declines given the strongest labor market and higher expectations for interest rates. The U.S. Aggregate Bond Index (-2.67%) had steep losses, with bond maturities of 20+ years (-4.85%) falling the most. The internations aggregate bond index (-1.20%) proved durable on a relative basis. Since the start of the year, the US aggregate index (+0.58%) is unchanged, with the20-year bond (+2.42%) performing the best. Emerging market government bonds (+1.13%) also had solid price gains.
Click to enlarge
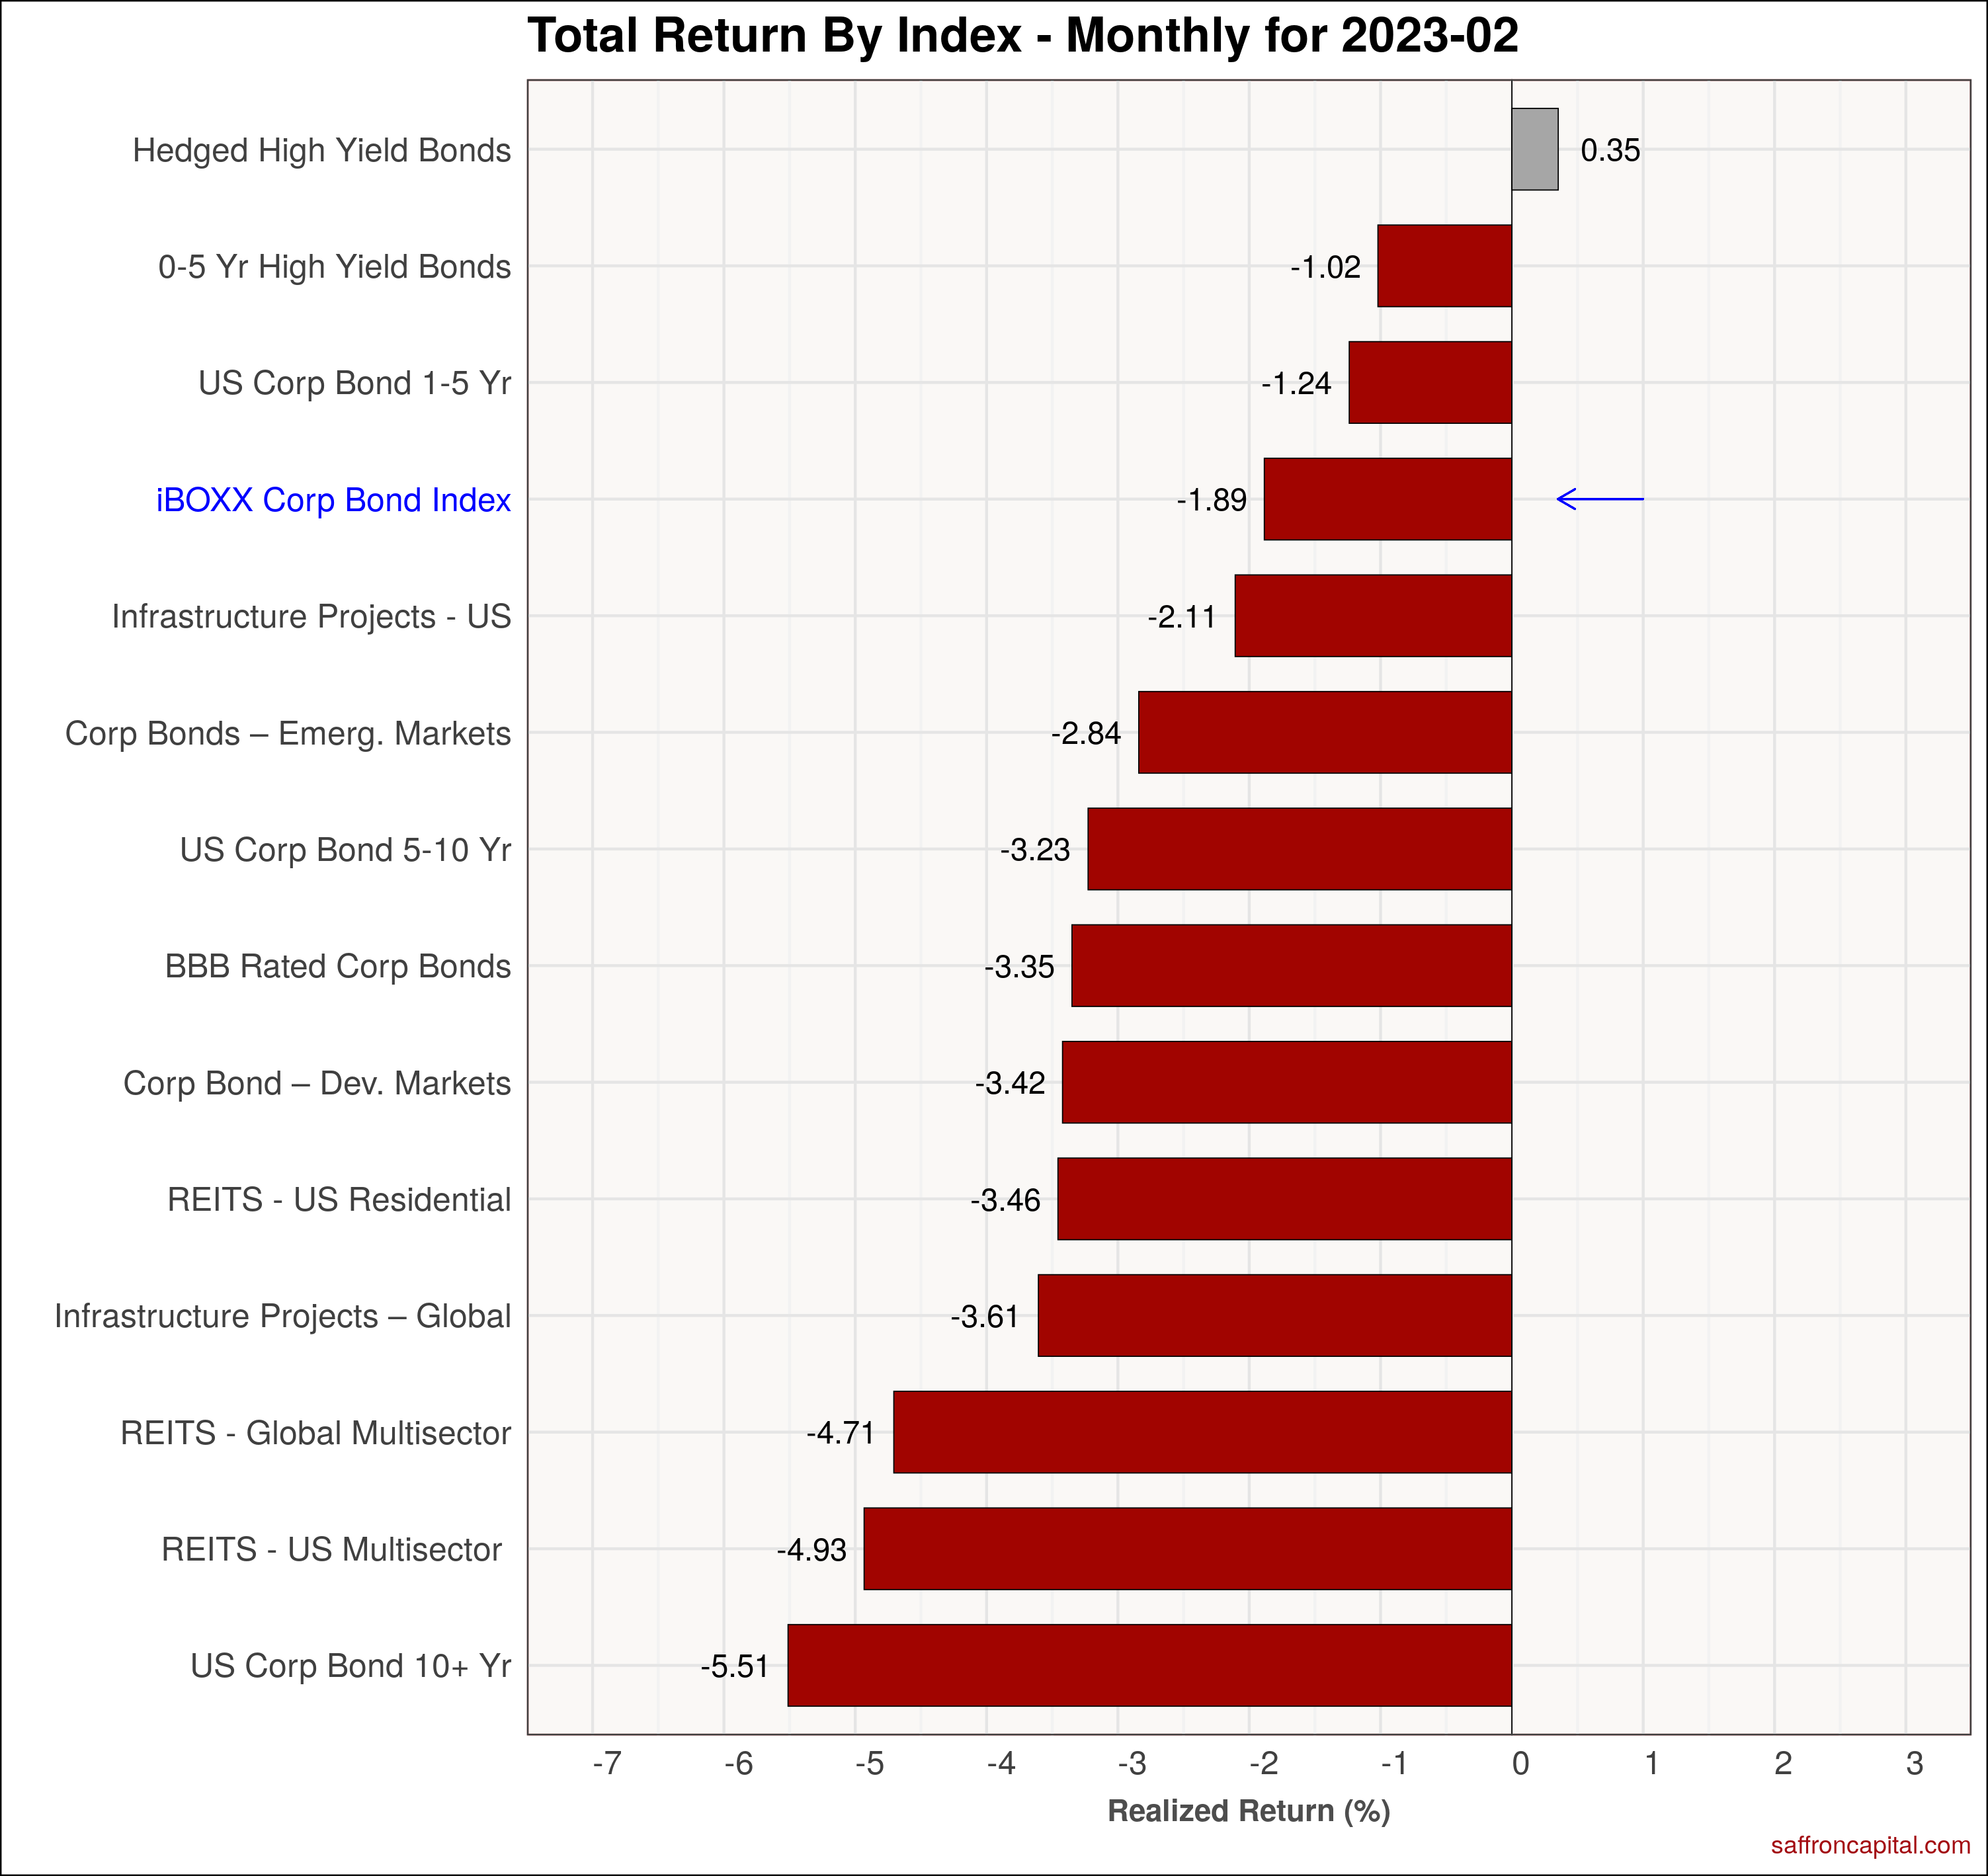
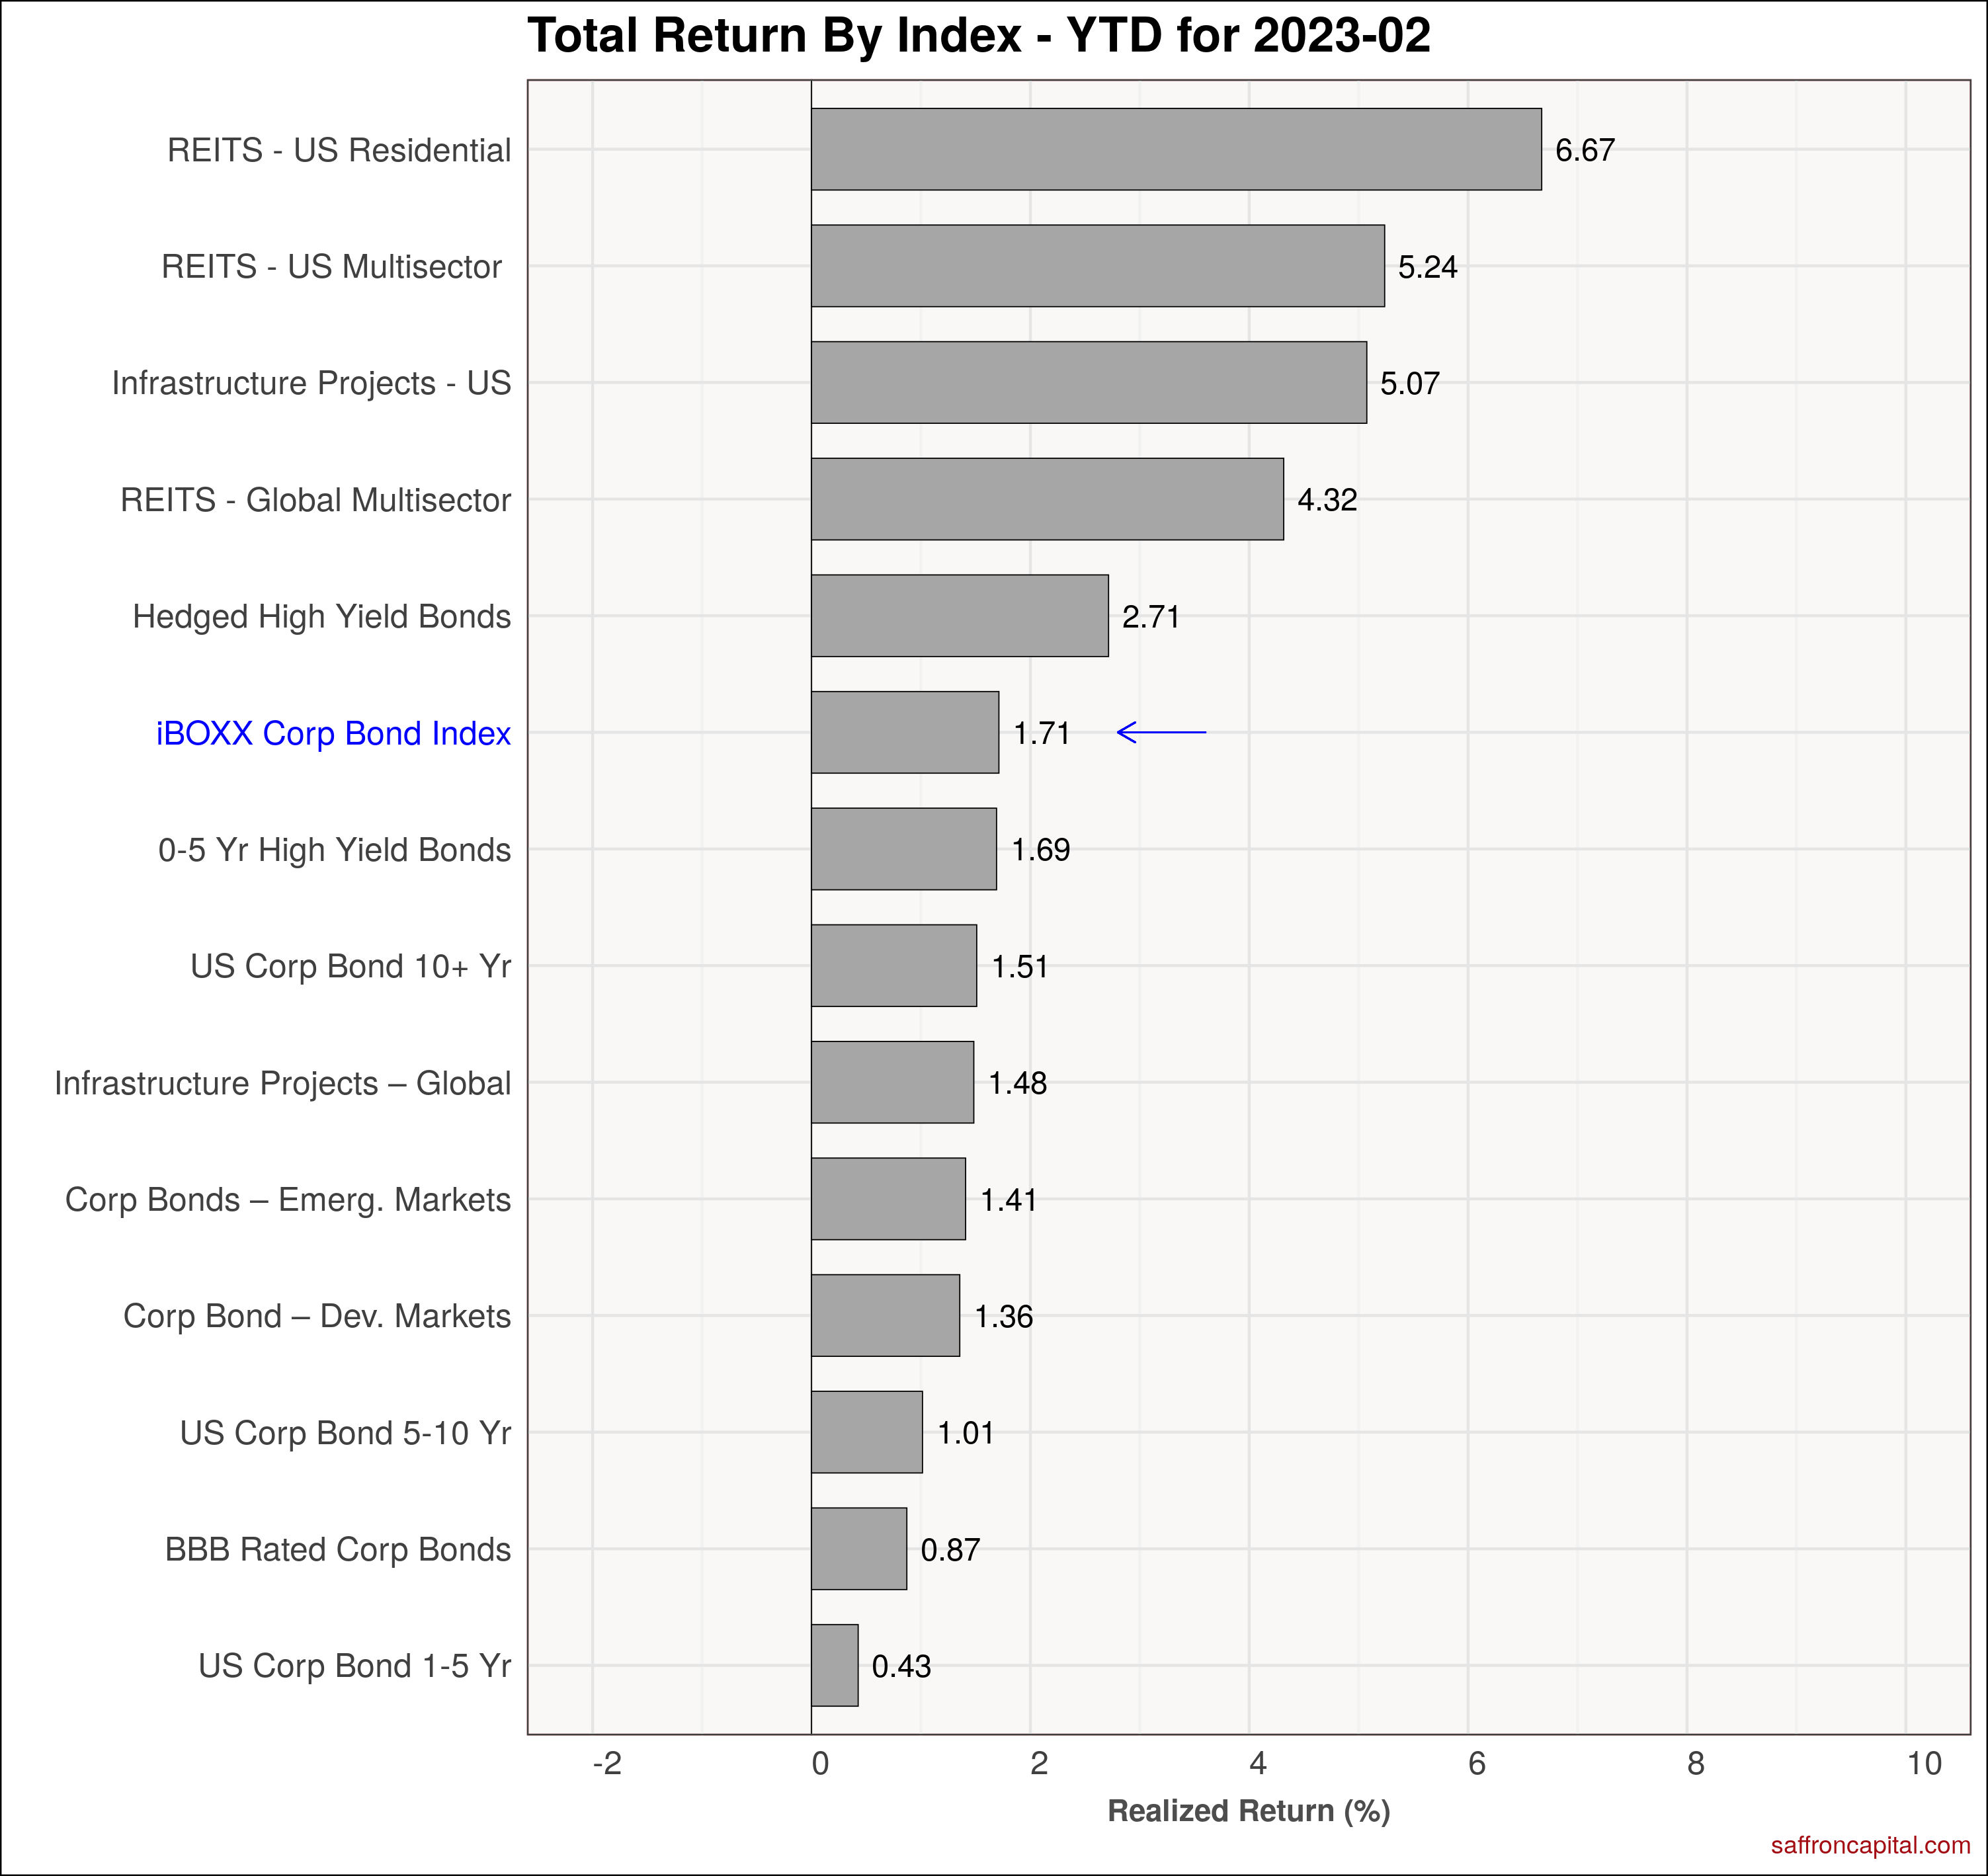
Corporate & Infrastructure Bonds
The iBoxx Corporate Bond Index (-1.89%) has pulled down by long duration 10+ year bonds (-5.51%). Other notable losers included US multi-sector REITS (-4.93%), residential sector REITS (-3.46%) and US infrastructure project bonds (-2.11%). Global multisector REITS (-4.4.71%) and project bonds (-3.61%) also performed poorly. Hedged high yield bonds (+0.35%) continues to be a safe haven from price volatility, while also offering annual yields greater 10%.
Click to enlarge
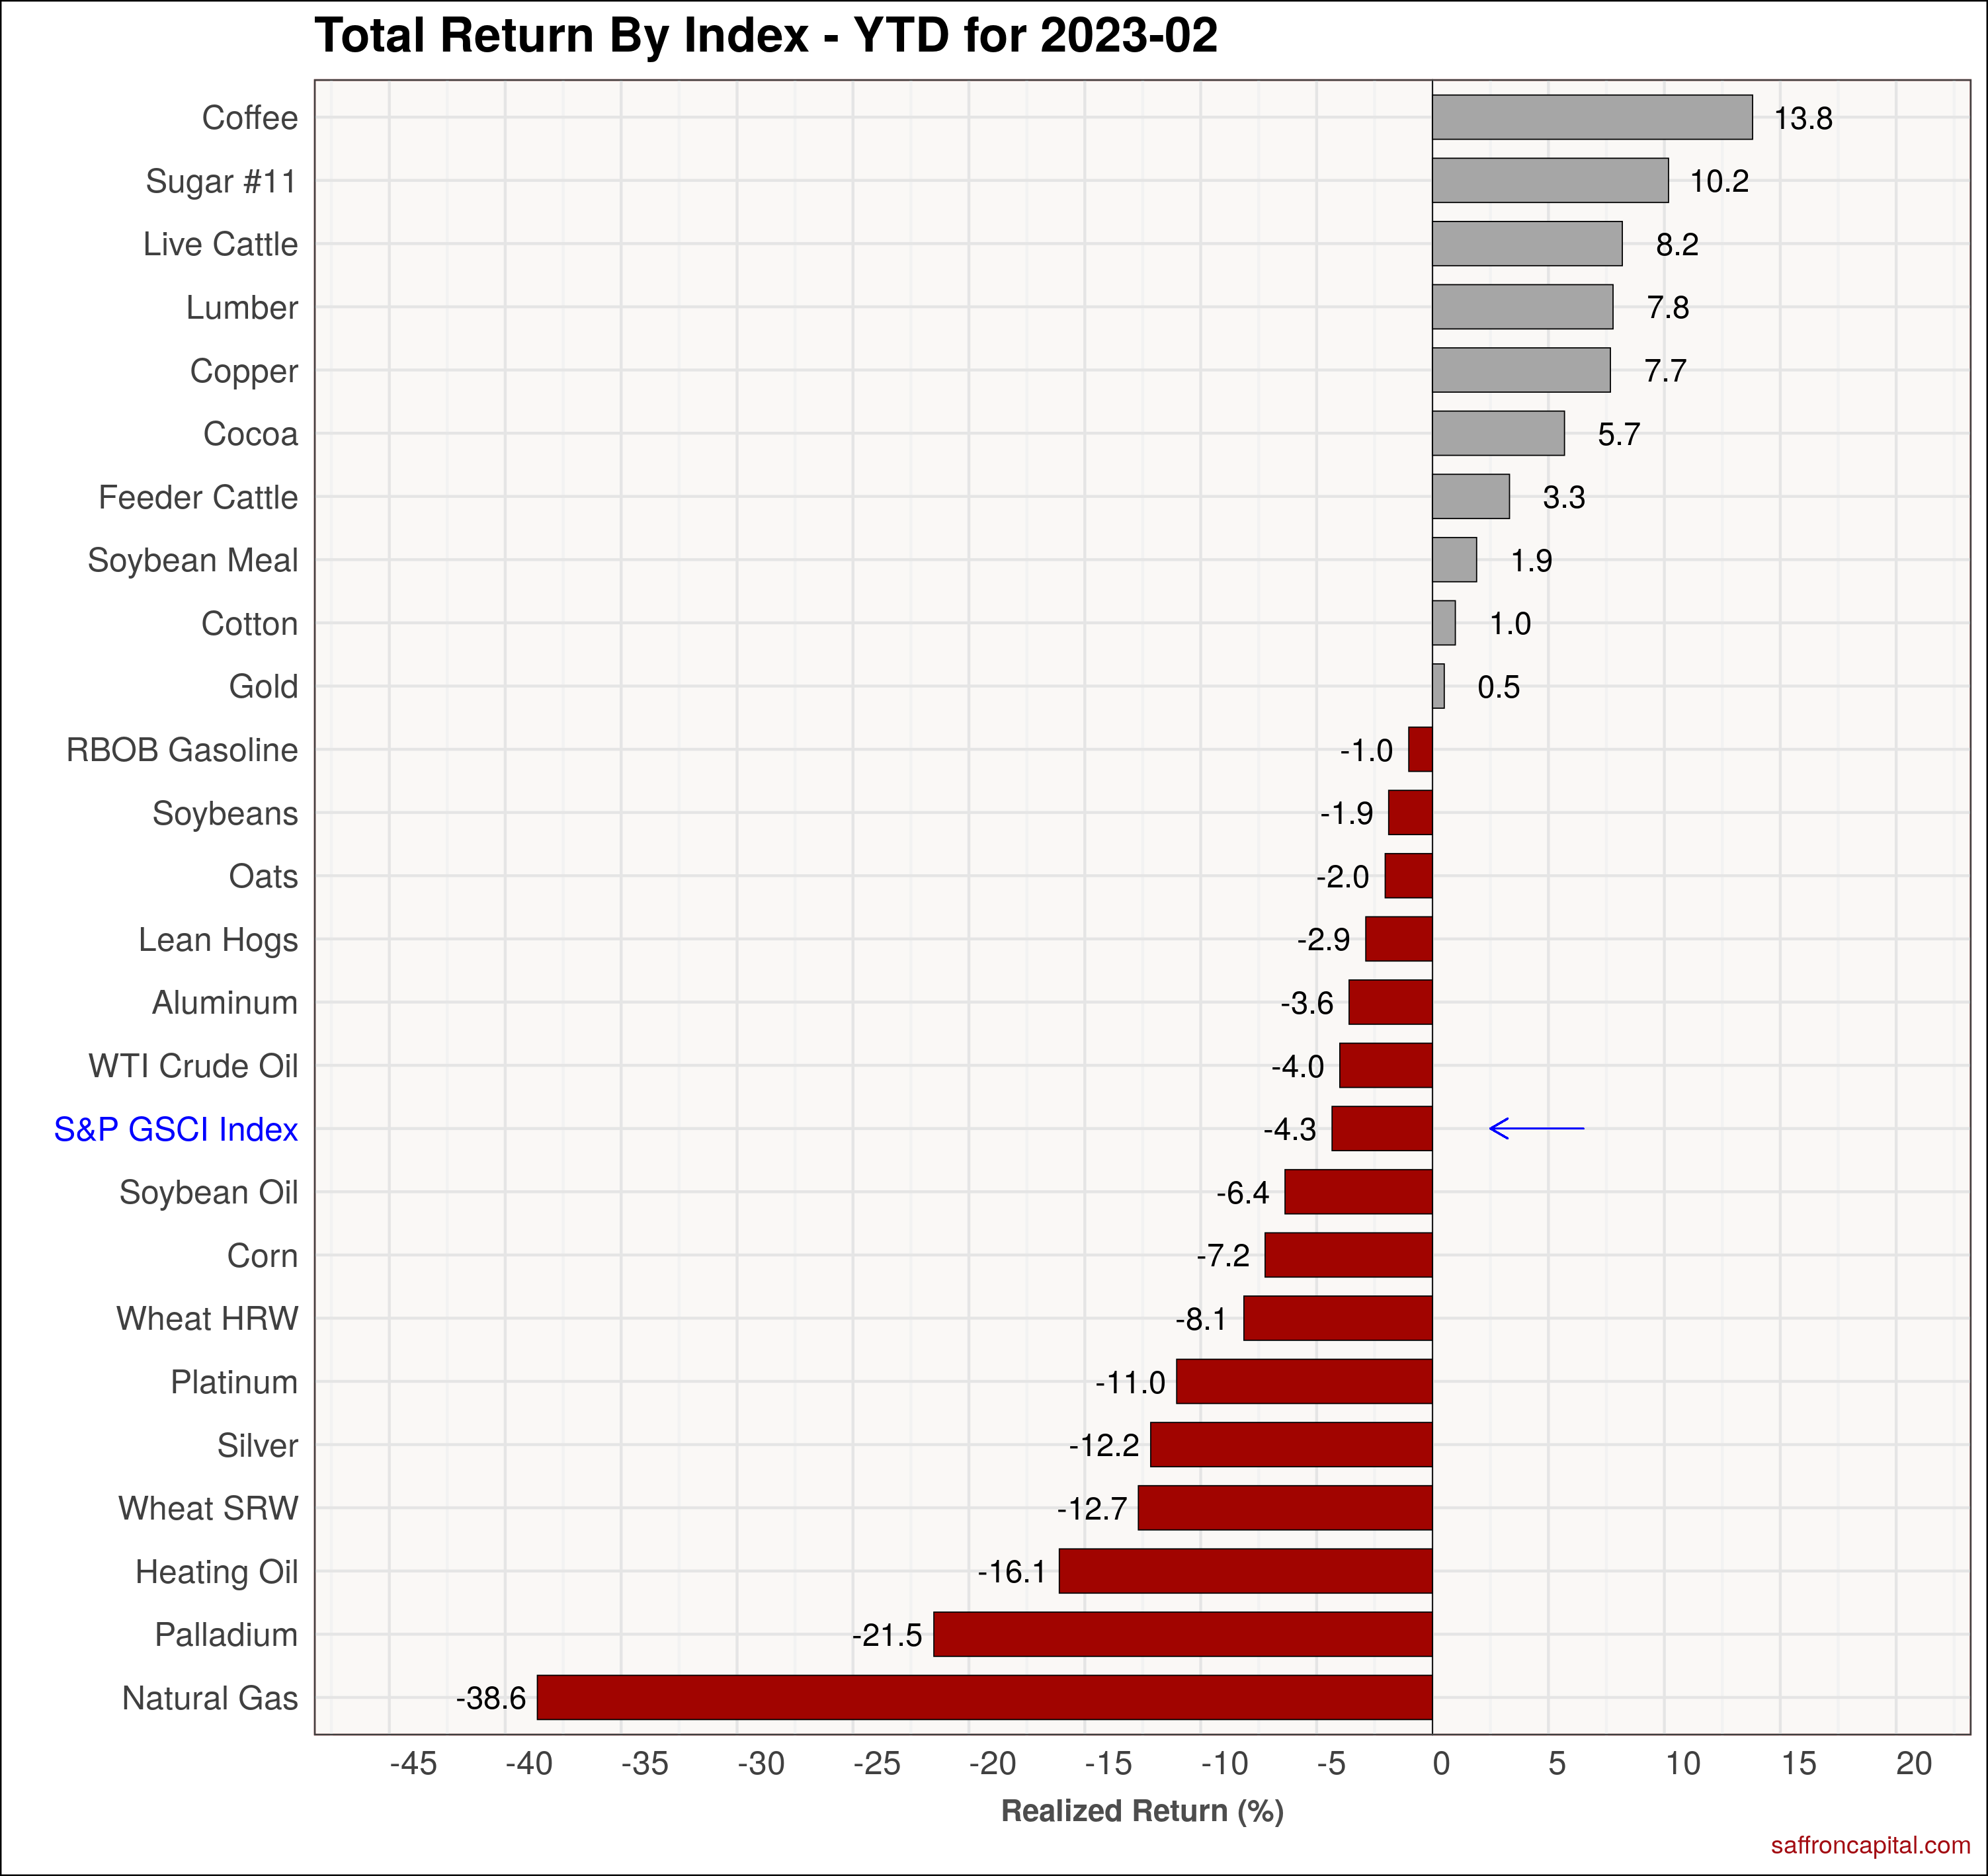
Commodities
February 2023 returns for the S&P GSCI index (-4.2%) masked the wide range of results across the commodity complex. For example, Pork(+13.8%), Cocoa (+6.5%) and Beef (+5.4%) benefited from strong consumer spending and post lock-down reopening in Asia. The weakest commodities in February included Lumber (-23.1%), Palladium (-14.6%), and Aluminum (-12.0%). Year to date, its all about food prices (+8-13%), Lumber (+7.8%) and Copper (+7.7%) rising dramatically, while consumers benefited from sharp drops in natural gas (-38.6%) and gasoline (-1.0%).
Click to enlarge
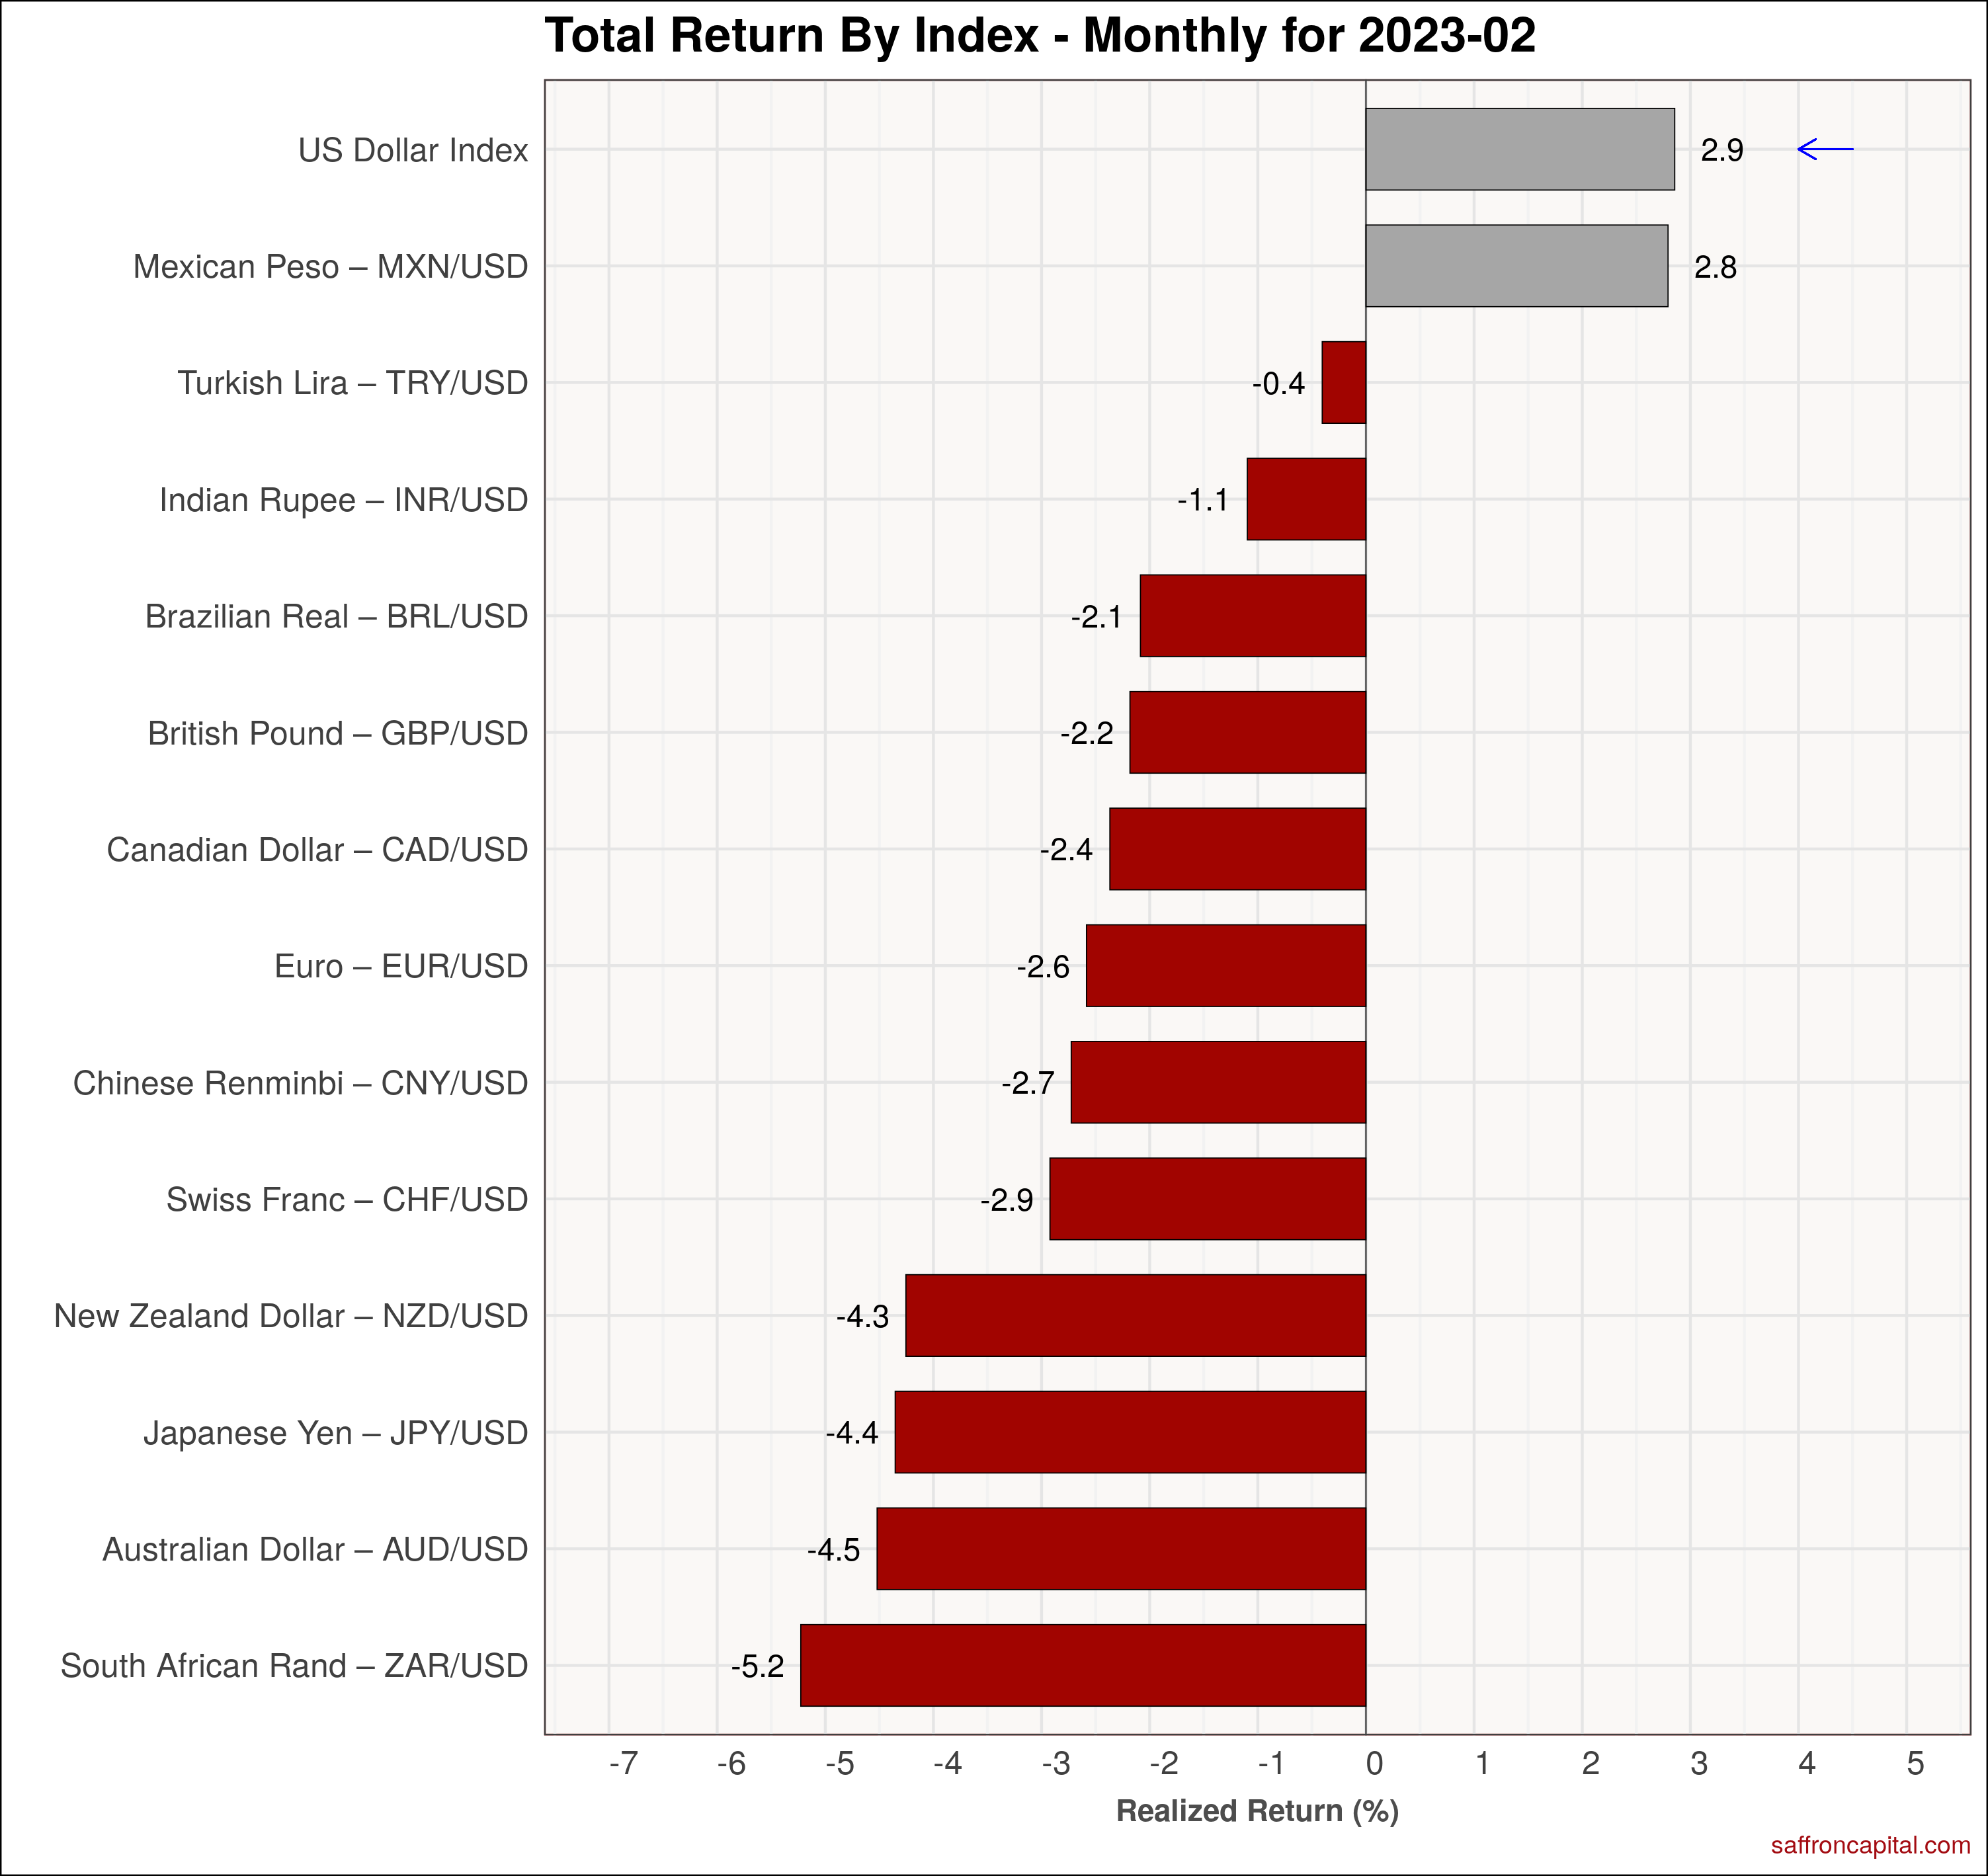
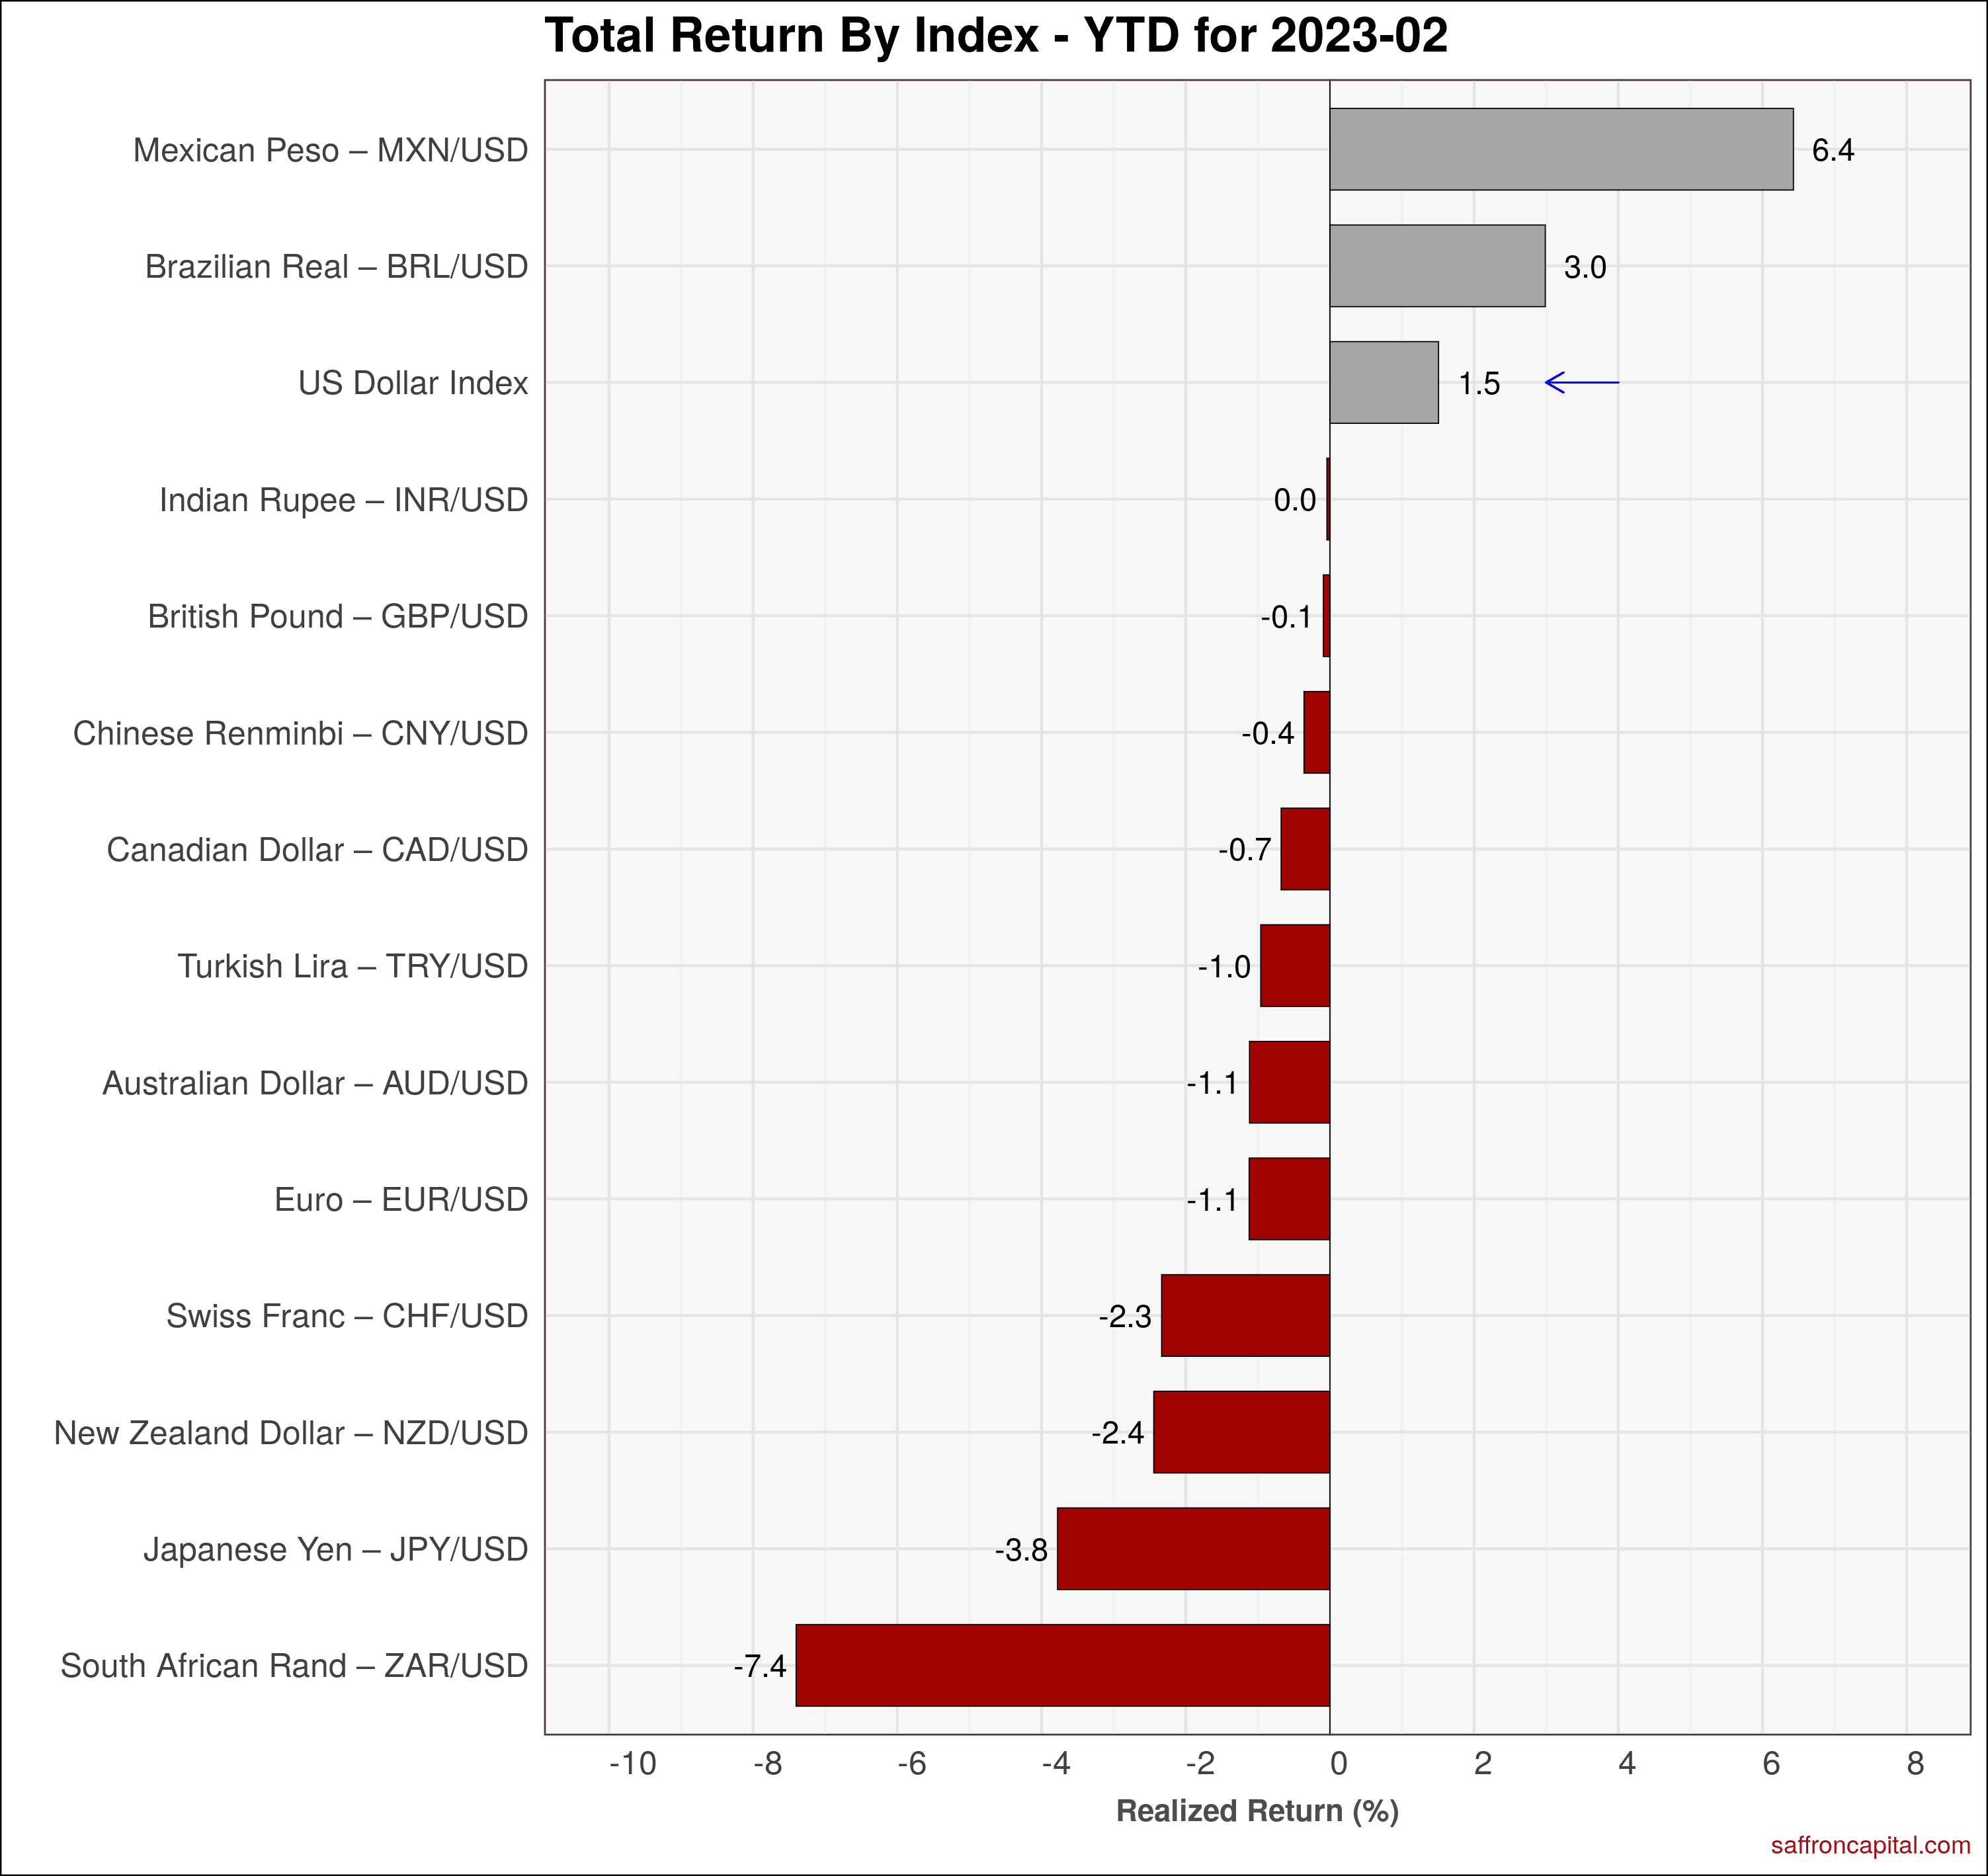
Currencies
US Dollar (+2.9%) strength resumed in parallel with increased US interest rates. Currency gains were also seen in the Mexico Peso (+2.8%). Weak currencies of note included the Rupee (-1.1%), Brazilian Real (-2.1%), Euro (-2.6%), Renmimbi (-2.7%) and Yen (-4.4%). The year-to-date leader board includes the Mexican Peso (+6.4%), Brazilian Real (+3.0%) and Mexican Peso (+1.5%).
Click to enlarge
Have questions or concerns about the performance of your portfolio? Schedule a meeting with us here.


