
June 2023 Returns and Asset Performance
July 2, 2023
S&P 500 Earnings Update – 2Q.2023
July 23, 2023ETF Fund Flows - July 07, 2023
ETF fund flows define the net dollar inflows and outflows for exchange traded funds over predefined periods. Fund flows are useful to identify market trends. The data broadly reveals the rotations investors make as they shift their funds across different assets, market sectors, or indexes. The following article compares short and intermediate fund flows.
US Equities – Sector Indexes
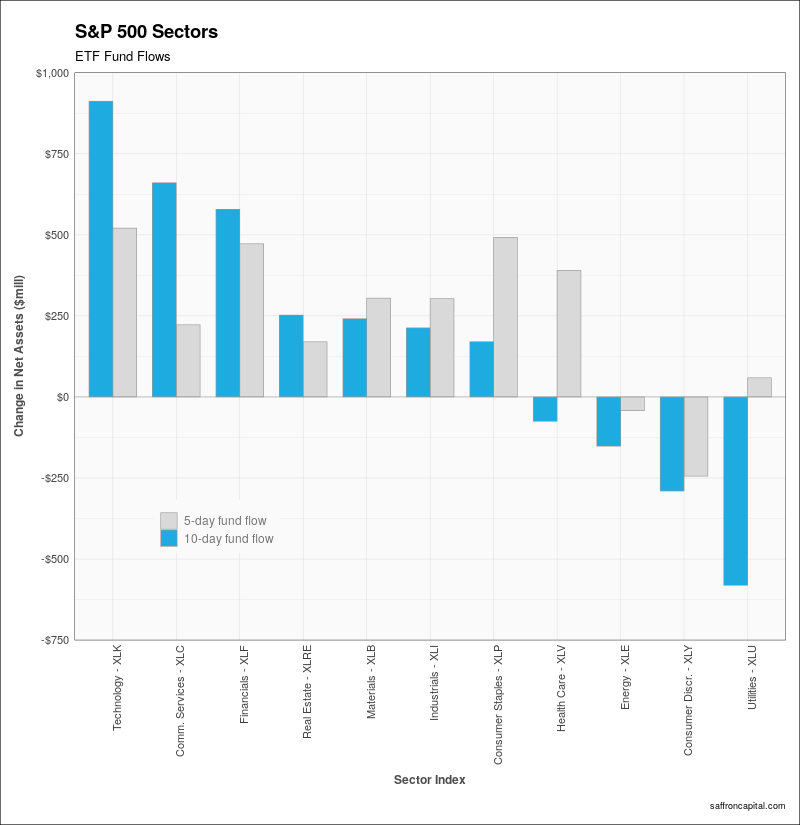
ETF fund flows by sector define tactical rotations within the S&P 500 index. For example, there are 11 sectors in the S&P 500 index. Over the last 10 days, the Technology (XLK) sector topped the list of sectors with $912 million in net inflows, the bulk of which occurred in the last few days. Meanwhile, the Communication Services (XLC) and Financial (XLF) sectors also had large inflows over the last 10-day period. However, in the last 5-days, we’ve volume shift toward the more defensive Consumer Staples (XLP) and Health Care (XLV) sectors. In contrast, 4 of the 11 S&P 500 sectors had net selling or fund outflows over the prior 10 days. The Utility (XLU) sector had the greatest outflows at $581 million , followed by the Consumer Durable (XLY) and Energy (XLE) sectors, as shown below.
US Equities – Factor Indexes
Stock market factors define the key drivers of stock market returns. The primary factors we track include:
- the size of firms (for small vs. large capitalization),
- book-to-market value (for high cost Growth vs. low cost Value shares), and
- high dividends shares.
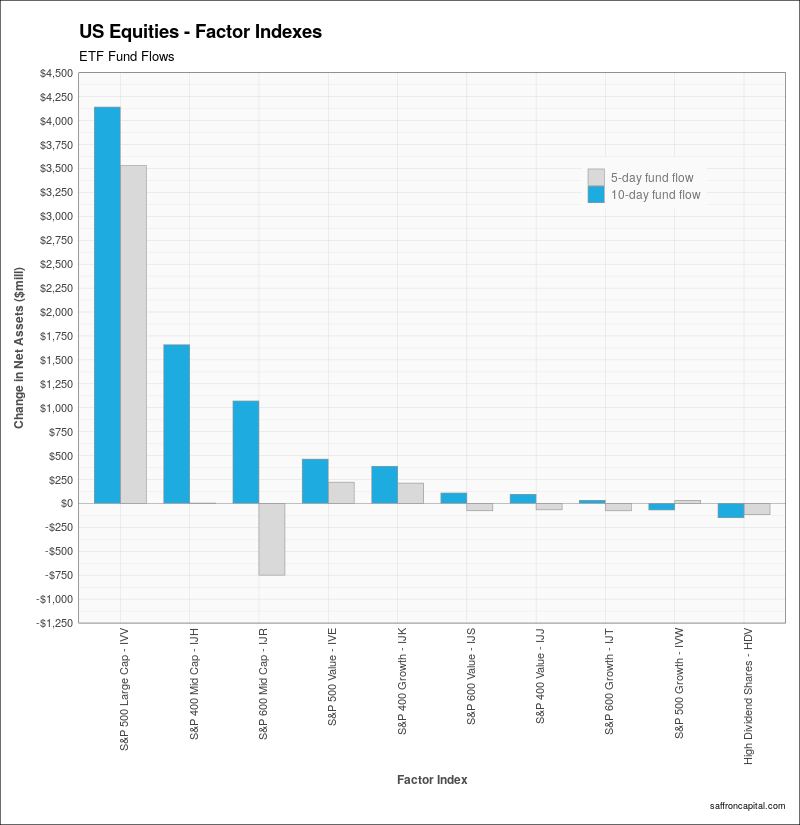
Not surprisingly, we see large cap shares continue to dominate fund inflows for both the 5- and 10-day periods. Mid-cap shares (IJH), which benefited from strong inflows over the 10-day period, remain unchanged in the last 5 days as buyers have held firm through recent price declines. In contrast, small cap shares, which also had strong cash inflows in the last 10 days, saw net outflows in the last 5 days. Regardless, the current uptrend still remains intact and has embraced a broader variety of stocks. For example, as market breadth expands, we’ve seen increased prices for value stocks and small cap growth stocks. Finally, we also see a rotation away from US high dividend shares (HDV) as bonds offer a better reward/risk profile.
International Equities – Developed Markets
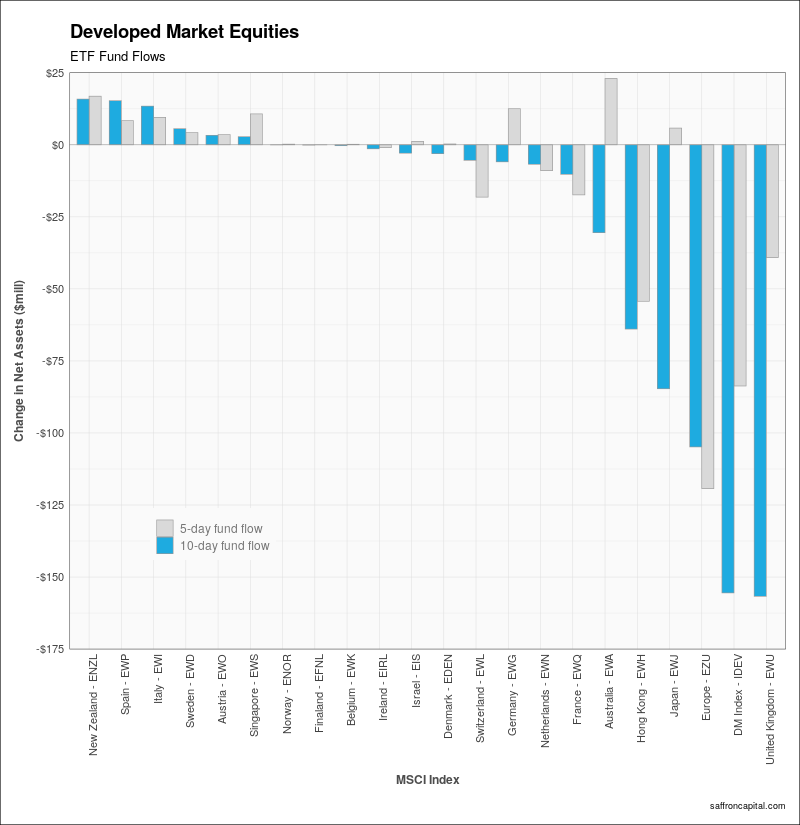
ETF fund flows for international developed markets are profiled below. The main story line here is simple: The massive inflows previously seen into the equity markets of Japan (EWJ) and Europe (EZU) have reversed to support modest selling. Selling volume is still light, notably when activity for the anchor markets in Germany (EWG), France (EWQ), and Italy (EWI) are combined. However, the reversal pattern deserves attention to see if it accelerates when markets open on Monday.
International Equities – Emerging Markets
The chart shows fund flows for the emerging international markets. Large selling of the S&P Emerging Market Index (IEMG) is obvious with sales exceeding $1.7 billion and supported by direct selling in the equity market for China (MCHI), Taiwan (EWT) and Korea (EWY) to a lesser degree. In contrast, investor fund flows into India (INDA) remain strong. The lack of broad selling beyond Asia suggests the selling of the broad index could be overdone, especially with little to no activity evident for the major markets in Brazil (EWZ), Mexico (EWW) and the Middle East (KSA, UAE, QAT).

Fixed Income – Government Bonds
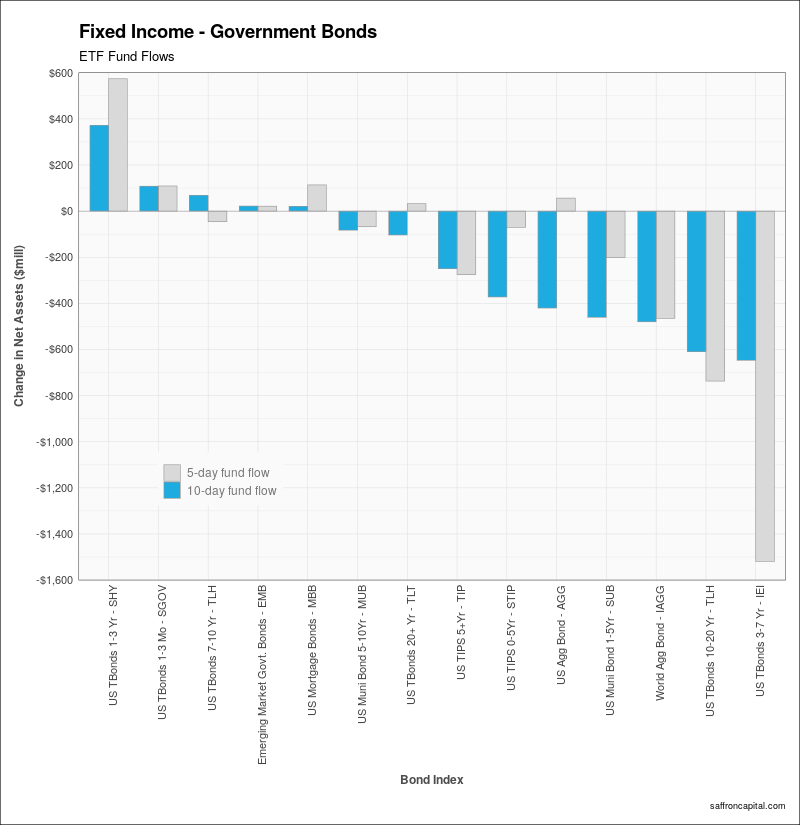
Fund flows for US Treasuries reveal tactical allocations across the yield curve. Currently, we are seeing large outflows away from the belly of the yield curve or for maturities of 3 to 7 years (IEI), which saw outflows in excess of $1.5 billion over 5 days. Bonds maturing in 10 to 20 years (TLH) also saw heaving selling. In contrast, large inflows are present for bonds maturing in 1 to 3 years (SHY) and for maturities of 1 to 3 months (SGOV). While prices for many bonds fell over the last week, the Aggregate Bond Index (AGG) with exposure to all maturities saw buying interest in the last 5 days.
Fixed Income – Corporate Bonds /Infrastructure Projects
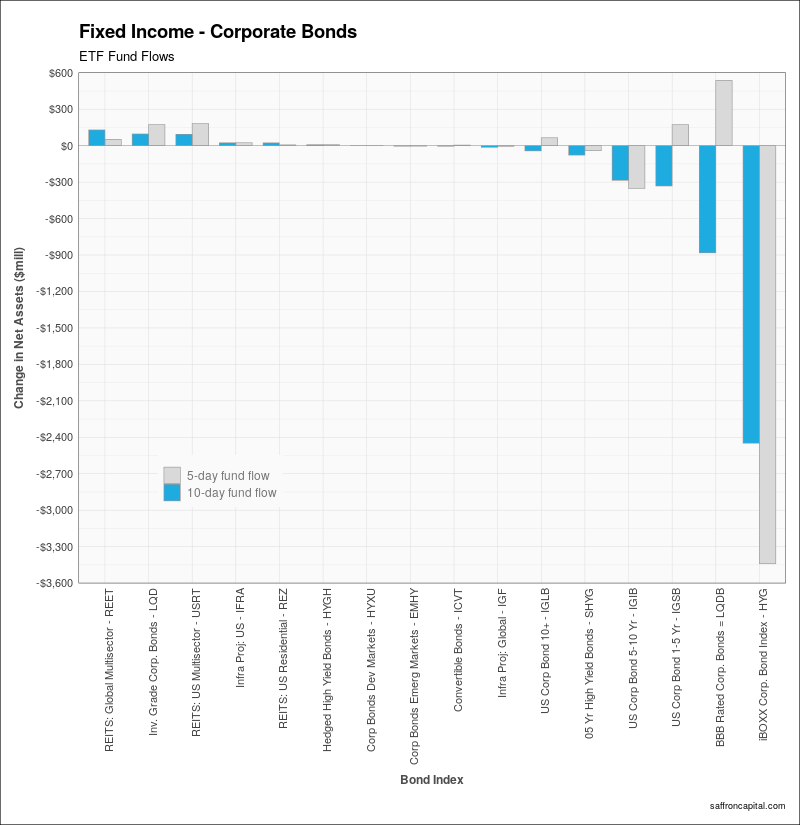
One of the largest sector rotations of recent days was the $3.3 billion in outflows hitting high yield bonds (HYG). Its interesting to note that the panic sales did not overflow into selling of hedged high yield bonds (HYGH), high yield bonds in developing markets (HYXU) or emerging market junk bonds (EMHY). Moreover, we see a modest realoocation of funds to investment grade (LQD) corproates and triple-B bonds (LQDB). Infrastructure project bonds in the US (INFRA) and abroad (IGF) remained relative inactive from a net flow of funds even though prices were strong over the past 5- and 10-day periods.
Commodities – Gold vs Silver
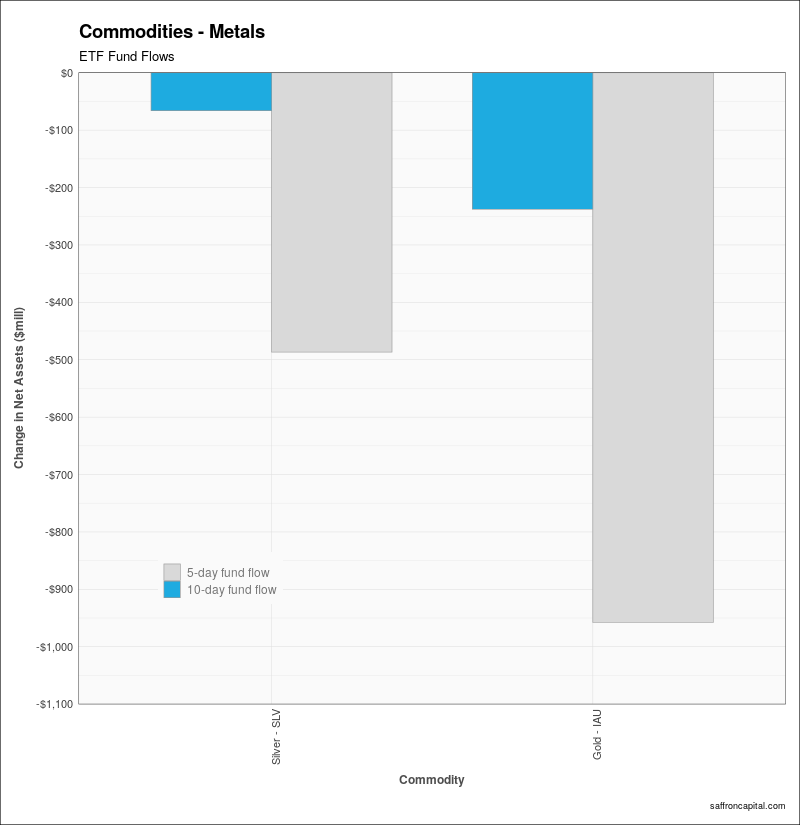
Rising rates and a strong dollar have resulted in large outflows of funds for gold (IAU) and silver (SLV) ETFs. The last 5-day period has seen strong investor sales even though prices trended up in the last week.
Do you have questions or concerns about how you allocate your investment funds? Are you looking to better manage the risk and returns of your portfolio? Whatever your needs or concerns may be, we are here to listen and to help. Schedule a meeting with us here.


