ETF Fund Flows: October 20, 2023
October 23, 2023
November 2023 Returns and Asset Performance
December 1, 2023Major Asset Classes
October 2023
Performance Comparison
Introduction
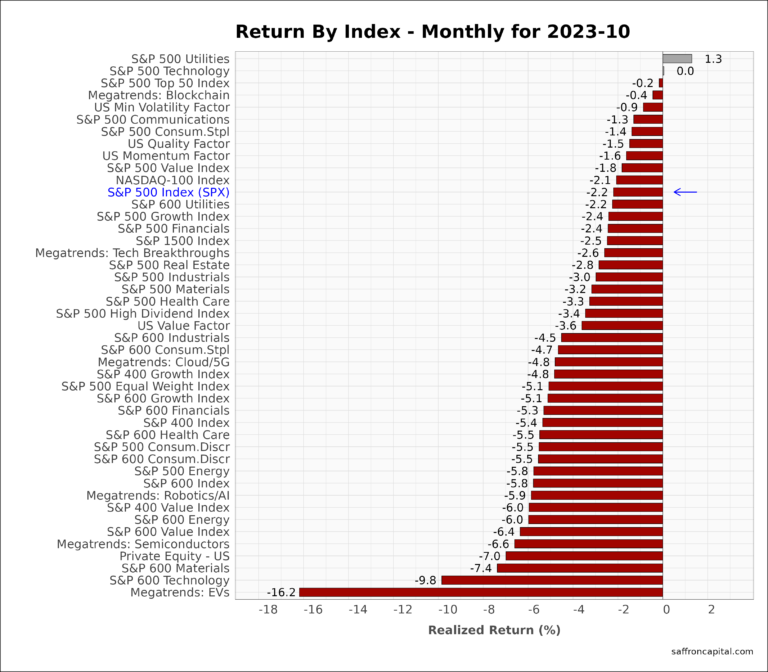
Strong GDP growth in the third quarter is the backdrop for October 2023 market returns. Still, the U.S. equity markets fell last month, the third monthly loss in a row. Meanwhile, key drivers included mixed third quarter earnings results, surging long-dated yields, and geopolitical tensions, all of which hit all US equity indices. In October, the S&P 500 was down 2.2% and the NASDAQ-100 index was down 2.1%.
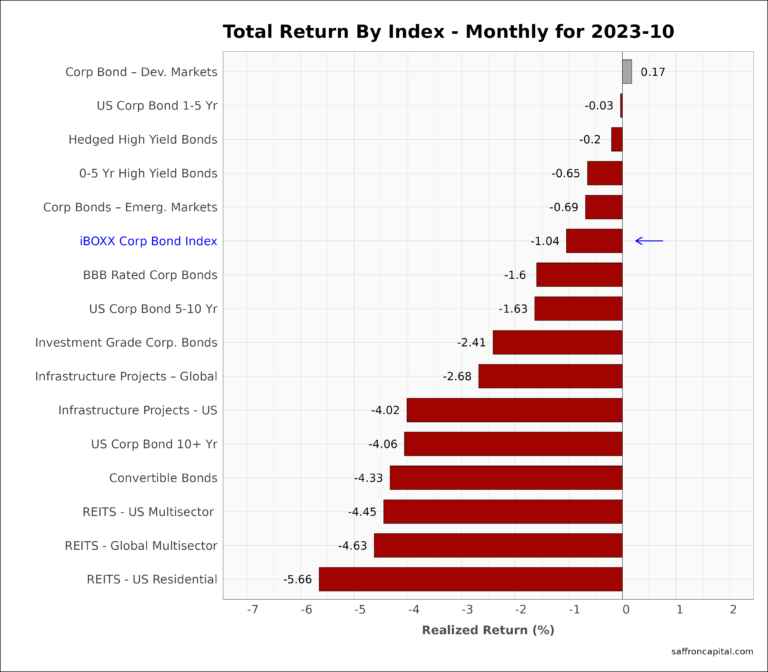
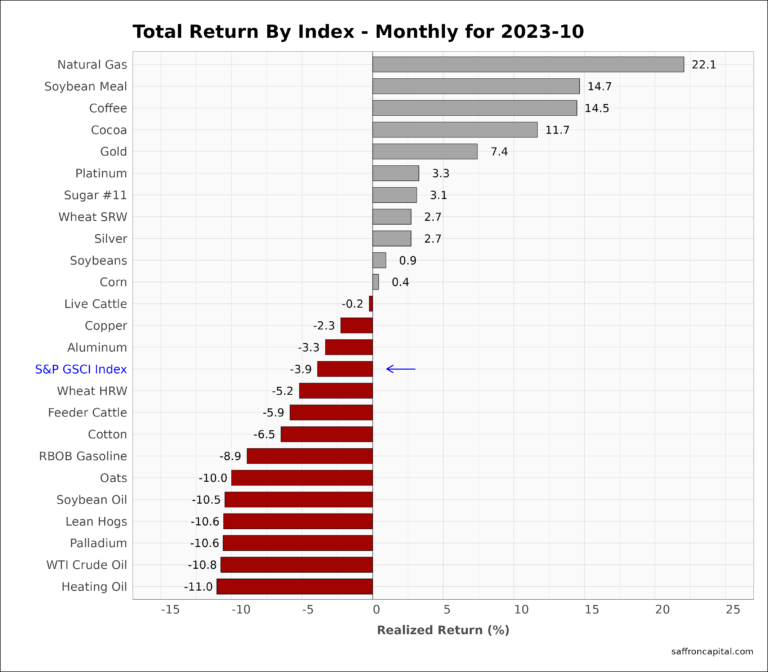
Fixed income markets were also down in October. However, the Aggregate Bond Index for US Treasuries (-1.57%) and the iBOXX Corporate Bond Index (-1.04%) both fared better than equities. In comparison, the S&P Commodities Index (-3.9%) masked a wide variety of returns, with Natural Gas (+22.1%) rising rapidly and Crude Oil (-10.8%) under pressure.
The following analysis provides a visual record of October 2023 returns across and within the major asset classes.
US Equities
Large-cap Utilities (+1.3%) and Technology (0.0%) shares where the only sectors to avoid red ink in October. As one would expect in a declining market, the best relative performance came from defensive strategies. For example, Minimum Volatility or low beta stocks (-0.9%) had solid relative performance. At the same time, the hardest hit were shares included megatrend Electric Vehicle (-16.2%), small cap Technology (-9.8%), and small cap Materials (-7.4%). Large cap Energy (-5.8%) tracked lower with crude oil prices.
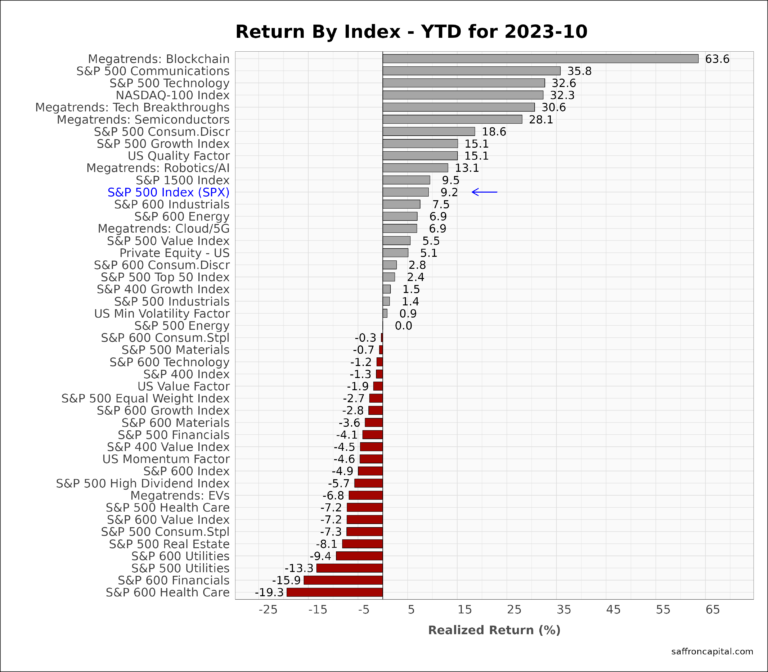
Year-to-date (YTD) returns are also presented for the the first 10 months. The S&P 500 Index (+9.2%) continues to perform well, while the NASDAQ-100 Index (+32.3%) has significantly outperformed. In comparison, the S&P 400 Mid-Cap Index (-1.3%) and the S&P 600 Small Cap Index (-4.9%) have not fared as well, confirming that market breadth remains weak. A wide dispersion of results is also seen by sector, with Technology shares (+32.6%) at the top of the list and Utilities (-13.3%) at the bottom.
Developed Market Equities
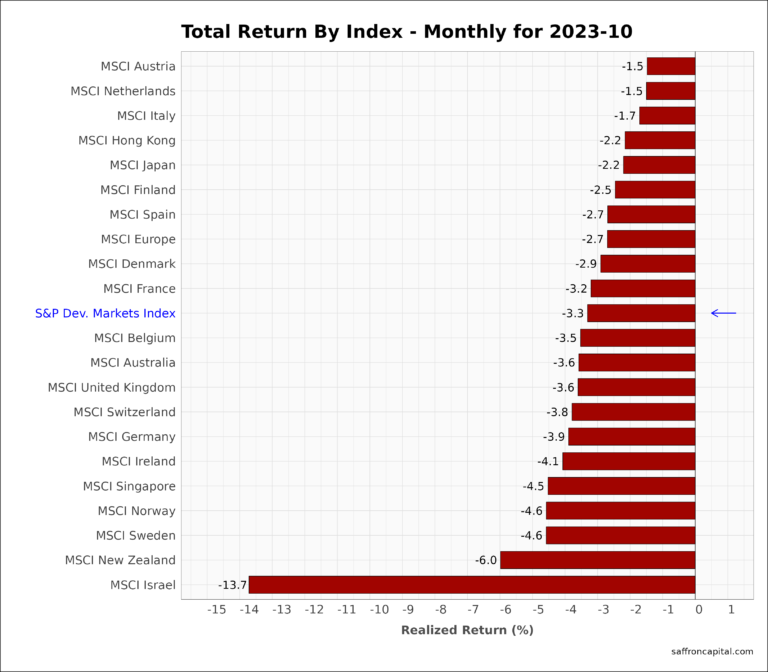
International developed markets (-3.3%) in October were all broadly down. Austria (-1.5%), the Netherlands (-1.5%), and Italy (-1.7%) all outperformed the US S&P 500 Index. Japan (-2.2%) was flat to the US benchmark, while the United Kingdom (-3.6%) and Germany (-3.9%) both lagged the asset group. The worse performing market was Israel (-13.7%).
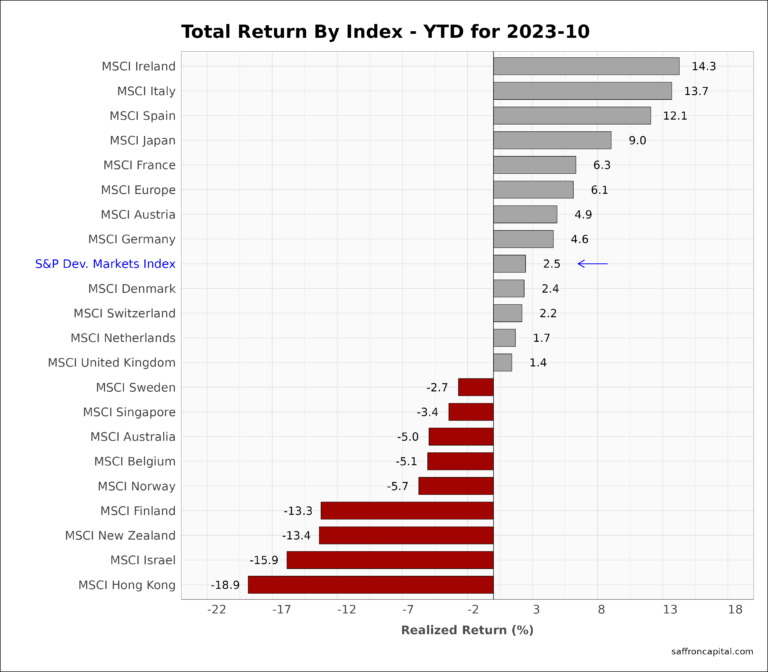
For the first 10 months, developed markets (+2.5%) remain positive. The best performers continue to lead the S&P 500 index year-to-date, notably Ireland (+14.3%), Italy (+13.7%), and Spain (+12.1%). Japan (+9.0%) is running flat to US large cap market, while Hong Kong (-18.9%) has widened its lag behind the group.
Click to enlarge
Emerging Market Equities
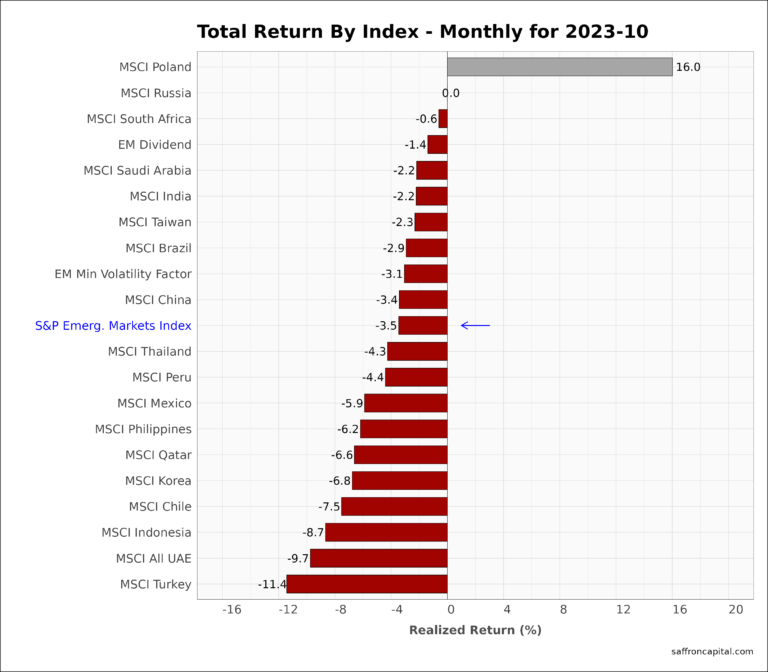
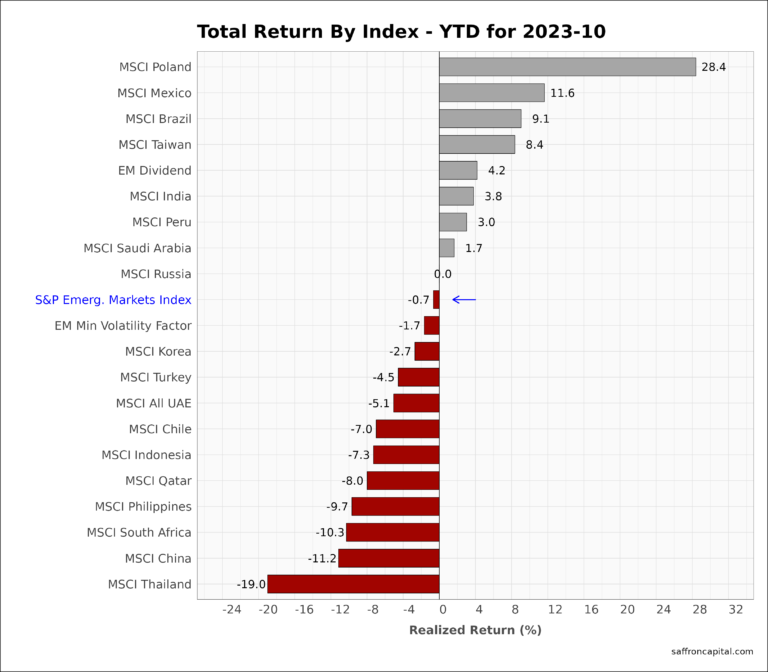
October 2023 returns for the S&P Emerging Markets Index (-3.8%) also fell victim to higher yields. However, the Polish stock market (+16.0%) is the world’s best performing equity group in October. Both India (-2.2%) and China (-3.4%) beat the group index in October, while Mexico (-5.9%) Korea (-6.8%), and Turkey (-11.4%) lagged the group. The top performers year-to-date are Poland (+28.4%), Mexico (+11.6%) and Brazil (+9.1%).
Government Bonds
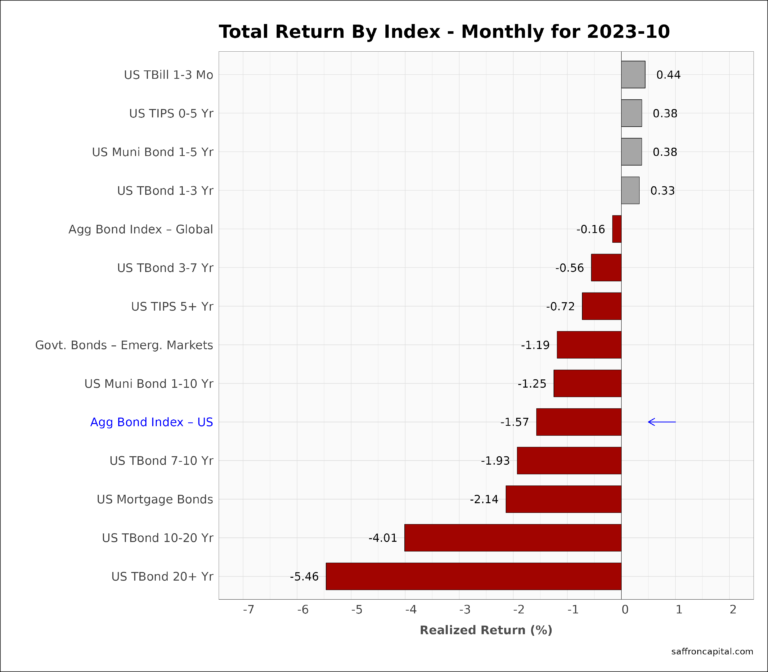
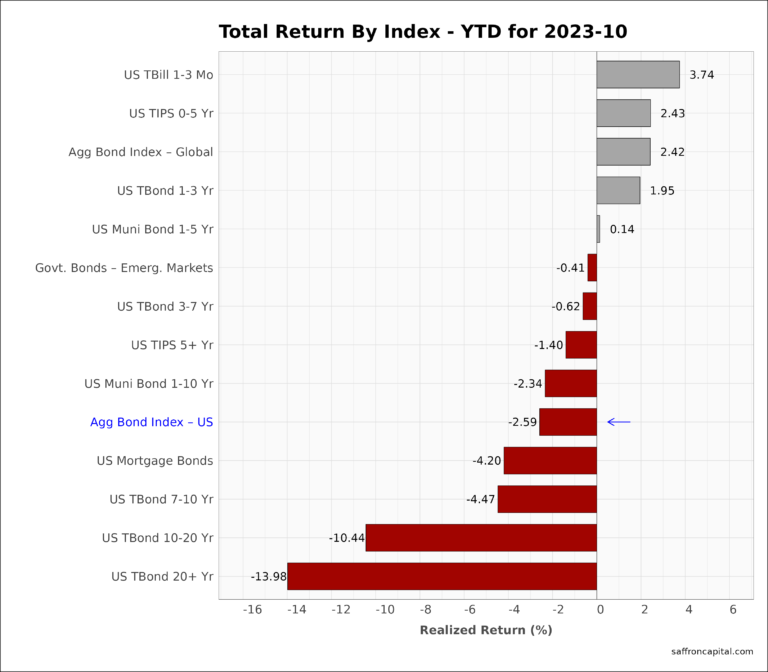
Returns for the Aggregate US Government Bonds Index (-1.57%) showed that negative momentum was unabated in October. The front of the yield curve saw positive returns as seen by short-term T-Bills (+0.44%), US TIPS 0-5 years (+0.38%), Municipal bonds 1 to 5 years (+0.38), and T-Notes 1-3 years (+.33%). However, the back-end of yield curve proved volatile with the US T-bond for 20 years (-5.46%) down significantly. Since January, returns for the Aggregate US Bond index (-2.59%) are yet to match realized inflation in 2023. Short-term T-Bills (+3.74%) lead the group, while the the 20 year T-Bond (-13.98) has burnt cash like a furnace, proving how difficult 2023 has been for investors without active risk control.
Corporate & Infrastructure Bonds
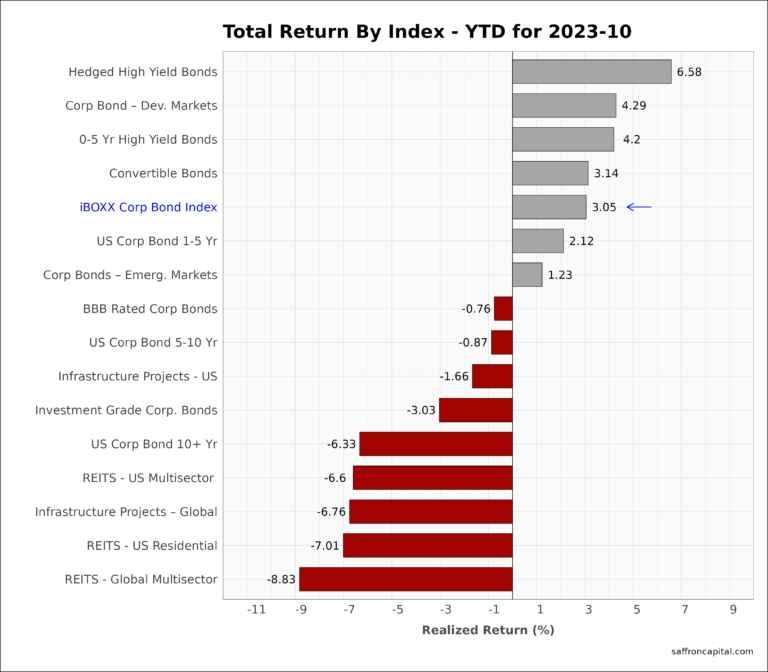
The iBoxx Corporate Bond Index (-1.04%) again outperformed Treasury bonds in August. Performance was lead by international corporate bonds (+0.17%), short-term Corporate bonds 1 to 5 years (-0.03%), and Hedged High Yield Bonds (-0.2%). Global Infrastructure Project Bonds (-2.68%) and US Infrastructure Bonds (-2.68%) continued their multi-month declines. Finally, Real Estate Investment Trusts (REITS) all trailed the group, regadless of type. Looking at year-to-date performance, the best returns were generated by Hedged High Yield Bonds (+6.58%), international corporate bonds (+4.29%) and short-term 0-5 Yr High Yield Bonds (+4.2%).
Commodities
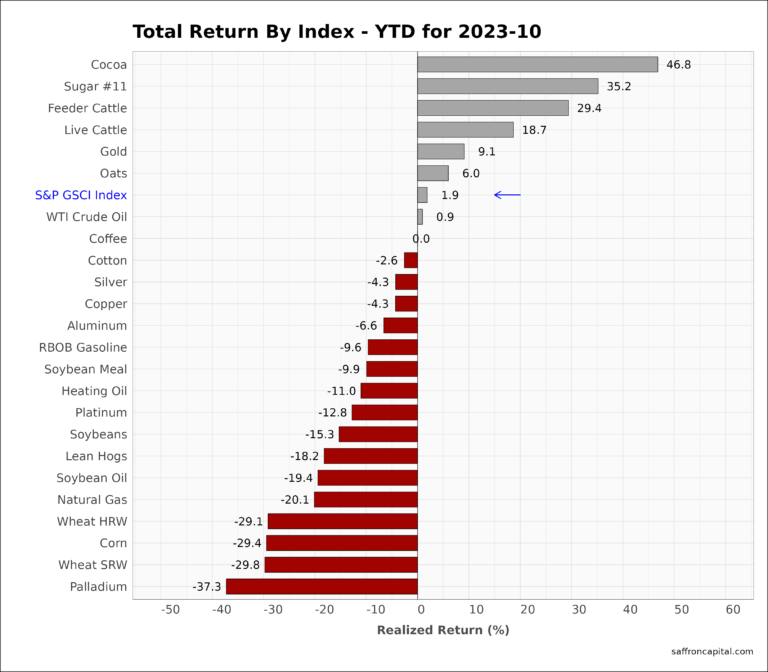
October 2023 returns for the S&P GSCI index (-3.9%) confirmed a trend for falling raw material prices, but with highly variable results. For example, Natural gas (+22.1%), Soybean Meal (+14.7%) and Coffee (+14.5%) outpaced the group, while Heating Oil (-11.0%), Crude Oil (-10.8%), and Palladium (-10.6%) were all weak. Year-to-date results for the commodity index (+1.9%) has declined over 500 basis points in the past 2 months. Tropical commodities, including Cocoa (+46.8%) and Sugar (+35.2%) lead the group, along with US Feeder Cattle (29.4%). Grains are trailing the group following recent harvest results.
Currencies
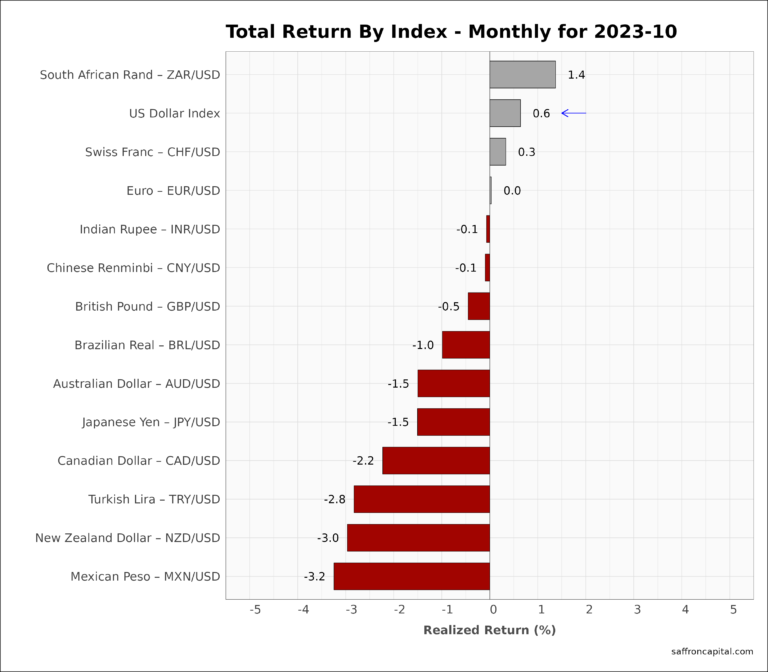
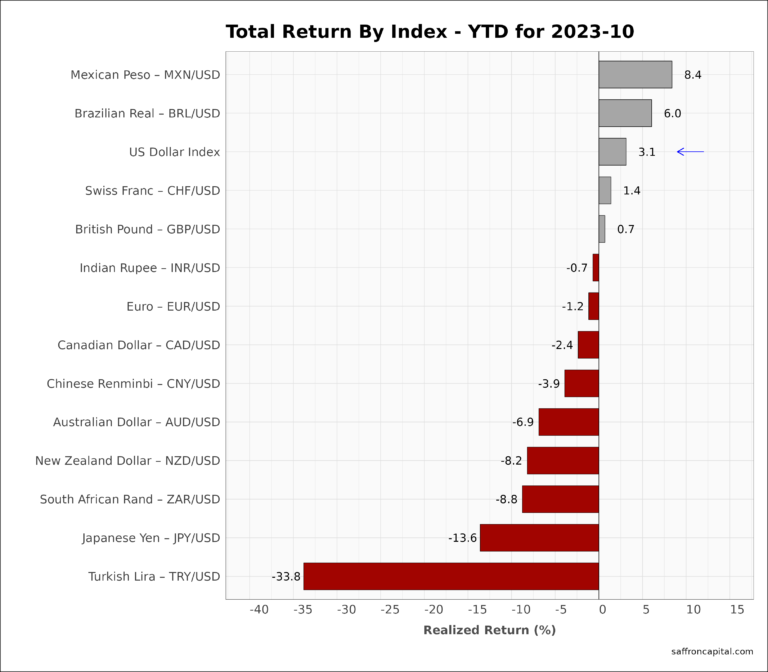
Finally, the US Dollar (+0.6%) was near unchanged for the month, but continues to be in an uptrend year-to-date (+3.1%). Since January, the Mexican Peso (+8.4%) has been the strongest currency, while the weakest has been the Turkish Lira (-33.8%).
Have questions or concerns about the performance of your portfolio? Whatever your needs are, we are here to listen and to help. Schedule time with us here.


