
June 2024 Returns and Asset Performance
July 1, 2024
August 2024 Returns and Asset Performance
August 31, 2024Market Update: Mid-Year Outlook 3Q.2024
The midyear outlook provides an overview of the current market and our best ideas looking out over the next six months. The original aim of the report was to provide our clients with essential insight into the health of the economy given that the S&P500 index had just fallen 8.6%, the NASDAQ-100 index was down 10.6%, and popular semiconductor stocks were down 22.5%. We reproduce our real-time client communications here for broader distribution and confidence.
Introduction
At mid-year, the US economy remains sound. The S&P500 index is still up more than 10% year-to-date even after the stock market drawdown of the past two weeks. As expected, bonds have only just begun to show beneficial capital gains, while savers have been benefiting from high yields on short-term Treasury Bills, CDs and money market accounts. Other portfolio components, like real estate and gold, are also doing well.
Despite the positive foundation, the stock market is off significantly since mid-July. Many clients are asking meaningful questions regarding the market. Many also believe now is a time to revisit financial plans and to decide if current investment plans are suitable or require a pivot in a new direction. The aim of the market update is to provide risk-aware advisory during the market drawdown. The report also seeks to assist clients to remain objective when managing risk or pursuing new investment opportunities.
Outlook Summary
- The US economy continues to see a solid rate of expansion with a low probability of a recession (25%) in the second half of 2024.
- Many analysts are targeting a total stock market return of 15-20% for 2024.
- The Bloomberg Aggregate Bond Index is primed to outperform short-term Treasuries in the second half of the year as expected capital gains opportunities dominate coupon yields.

Primary Outlook
US Macro
The economy remains resilient even with slowing evident. Key supporting data includes:
- Declining inflation.
- 7-months of strong cumulative job gains.
- Year-to-date Income growth at twice the rate of inflation.
- Strong consumer balance sheets.
- Persistent consumer spending.
- New business productivity gains.
Inflation Outlook
Inflation will continue to fall, and the Federal Reserve will reduce rates in 2024:
- 1 to 2 cuts are possible.
- The Fed’s neutral rate (which defines equilibrium between inflation control and job creation) will be revised higher.
- A drop in the Fed Funds Rate below 3% currently seems unlikely.
US Equities
The current bull market is young and is well supported by strong earnings growth:
- 2Q earnings are growing and currently stand at 12% year-on-year growth.
- Stocks will continue to outperform bonds.
- Market breadth will expand to support mid- and small-cap stocks.
US Bonds
Bond performance will improve as the Fed begins to cut rates:
- The client account shift from short- to long-term bonds is underway.
- Achieving a more traditional bond allocation is desirable.
- Long-term bond ladders is now the sole focus for accounts seeking income and capital preservation.
- BBB-rated corporate bonds are overpriced but offer buying opportunities if yields spike.
Outlook for Real Assets and Commodities
Diversifying across asset classes beyond bonds is limited:
- Infrastructure projects and select real estate positions will benefit from lower rates.
- Gold is a valid hedge for volatile times, but allocations should also tilt in favor of US bonds.
Income is Growing Faster Than Inflation
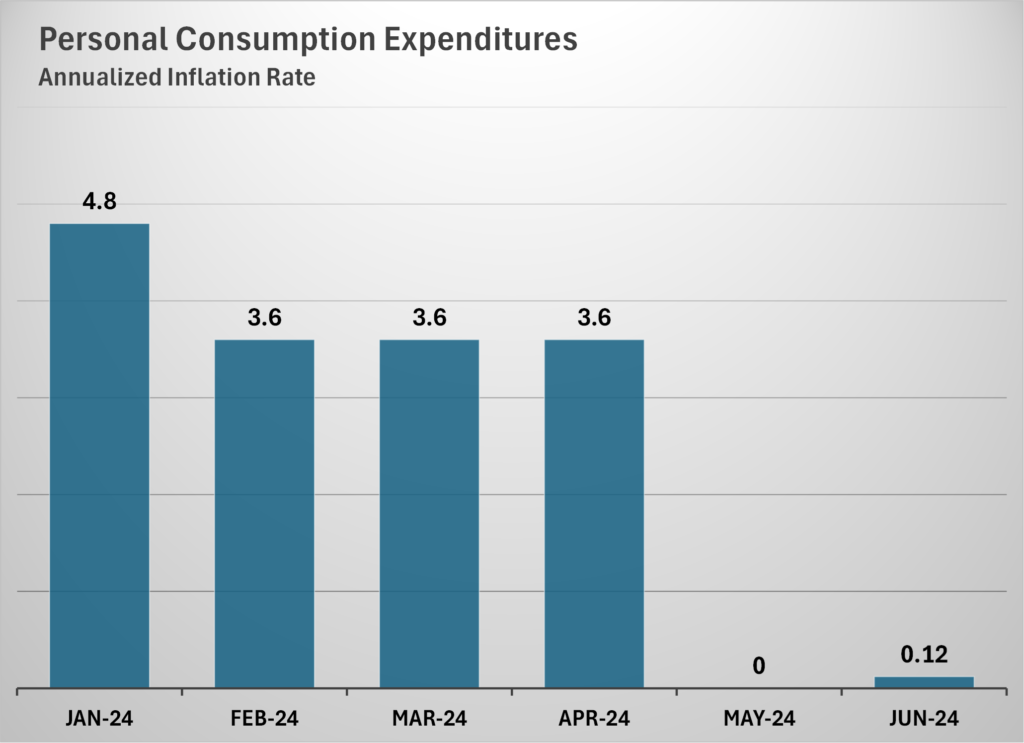
The US economy is beginning to get control over inflation. In the first quarter of 2024, Inflation ran hot. The Fed’s preferred measure on inflation, Personal Consumption Expenditures (PCE), rose 4.1% in the first quarter. The second quarter PCE data then came in much lower dragging year-to-date inflation down to 2.6%. As positive as this may be, cumulative inflation is still running over 20% higher when prices today are compared to those before the pandemic.
Fortunately, US personal income is growing faster than inflation. In the first quarter, personal income growth was 6.2% given the exceptionally robust growth of 12.8% in January (when most wage increases were implemented). Second quarter income growth has moderated, and the year-to-date growth rate is now 5.4%.
Income growth higher than inflation is the simplest explanation for why consumption continues to run strong.

Looking at the outlook of income growth its worth noting that the average wage for non-managers is growing faster than for managers. In fact, non-manager wages are growing faster than the trend that was previously in place before the pandemic and after adjusting for inflation. Meanwhile, manager wages, which have lagged the growth of overall wages, were significantly harmed in 2021 and 2022, but are now showing signs of rebounding.
Household Balance Sheets are Strong
Rising stock market and home prices since January have resulted in more wealth for US households. At the same time, liabilities – notably mortgage debt, but also personal loans – have not increased at the same pace as asset inflation or wages. As a result, household net worth has increased 3.9% over the last year. At the end of the first quarter, household net worth stood at 777% of disposable income, well above historical levels. Its also newsworthy that liabilities as a percent of disposable income is now at one of its lowest levels in years – thanks to low mortgages – and is flat to levels last seen in 1999.
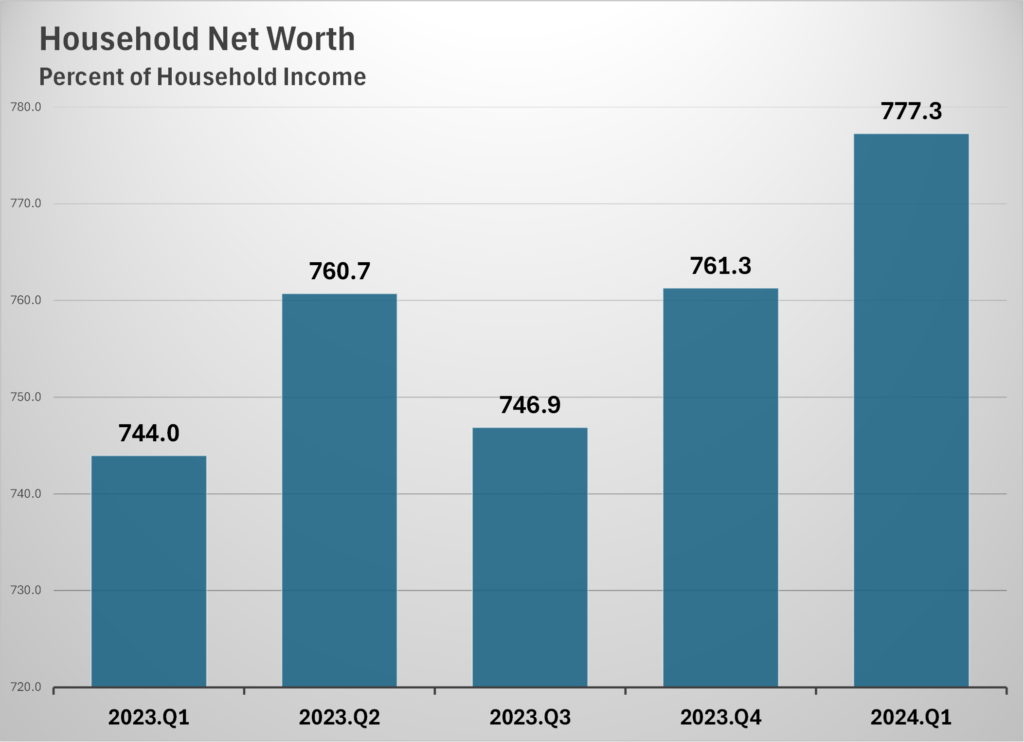
Many market outlook narratives like to stress the level of rising personal debt in the US, which is true in absolute terms. However, rising debt is simply not true when viewed relative to the increase in wealth. This is also the reason US savings rates have dipped from 7% to 3%. Americans are not saving more since they are now worth more.
The Labor Market is Still Strong
If the labor market deteriorates, then incomes fall, consumption falls, and the economic outlook is in trouble. Payroll growth has averaged 202,714 per month over the first seven months. For the last 30 months, the unemployment rate was below 4%, the longest streak since the late 1960s. In the last three months, job creation has softened, averaging 169,667 and the unemployment rate in July jumped to 4.3%. The slowing in payroll growth is a desired outcome for the Fed and does not mean a recession is evident.
A better metric than the unemployment rate is the ‘prime age (25-54) employment population ratio.’ This metric avoids many of the problematic definitional issues tied to the unemployment rate. The
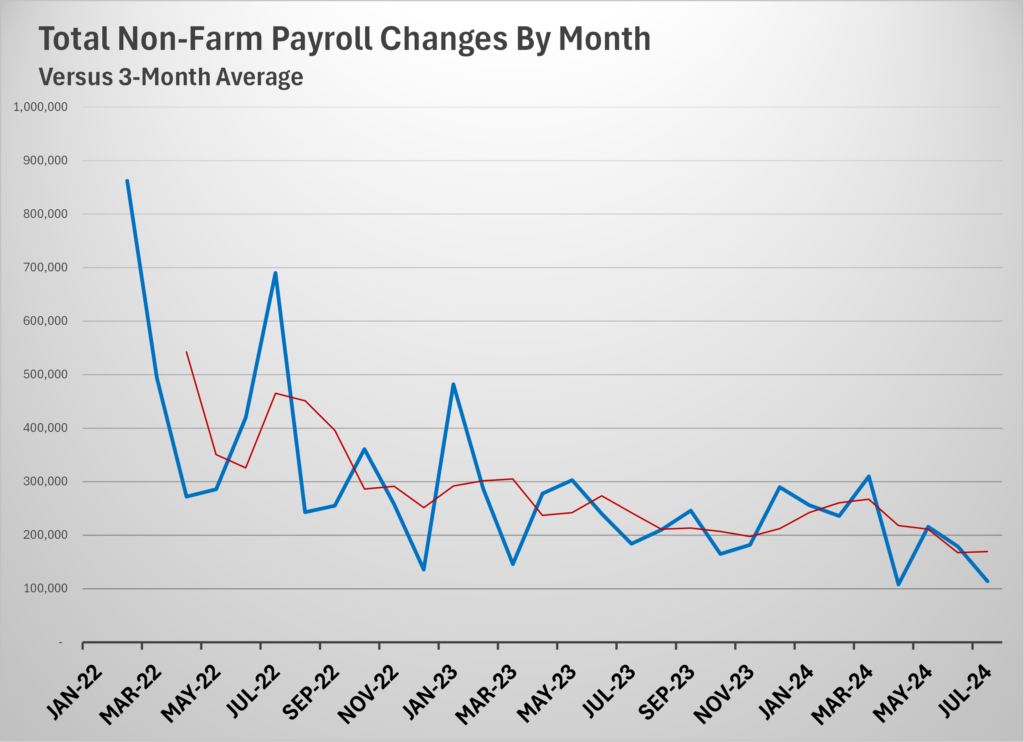
prime age employment-population ratio is currently at 80.8% and equals the high ratio of last summer. The ratio also is higher than anything seen pre-Covid. The same metric for women just set an all-time high, further evidence the labor market is strong. The deckining payroll changes simple confirms the market is not overheating.
Strong Labor Propels the Productivity Outlook
A strong labor market is the root cause for the gains in income growth relative to inflation. A strong labor market with less turn-over is also the incentive for increased business investments in productivity. Over the last year, productivity grew at 2.9% versus the average of 1.5% over the period 2005-2019. The decreasing availability of low-cost labor has been and will continue to be an incentive for business to invest more to be more productive. Robotics, automation, and process streamlining are all well supported. Even a small reduction in interest rates will continue to support the outlook for higher productivity rates. This is the same trend we saw in the 1990s.

The Outlook for the Fed and Inflation
Inflation has eased a lot over the past year given that PCE was running close to 5% a year ago, but remains above the Fed’s 2% target. Fed Chair Powell points to current level of inflaiton to assert the Fed must keep rates fixed, while opening the possibility of rate decreases in September and/or December. The Fed is waiting for supply-side improvements and for restrictive rates to have more impact. In the absence of rising inflation, the Fed bias to reduce rates is well supported:
- Wage growth is around 3%, which is in line with pre-pandemic rates,
- Commodity prices are not surging like they did in 2022, which means a commodity driven supply shock is not in the outlook.
Business expectations for inflation are running at 2.3%, close to the pre-pandemic level.
Here is an image of the Fed’s inflation outlook given different monthly rates of change. The outlook image is revealing since it justifies their cautious approach to avoid the potential for inflation to re-emerge.

The Cyclical Bull Market is not Over
We came into 2024 with market expectations calling for the S&P500 to have a very solid year, up between 11-13%. As market analysts revised their outlook expectations during June and July, the consensus estimate increased to 17-20% as the economic backdrop remains healthy. What is less apparent is that the cyclical bull market remains young by historical standards and could still have many months left. The next chart profiles the duration of the past 12 bull markets going back to World War II.
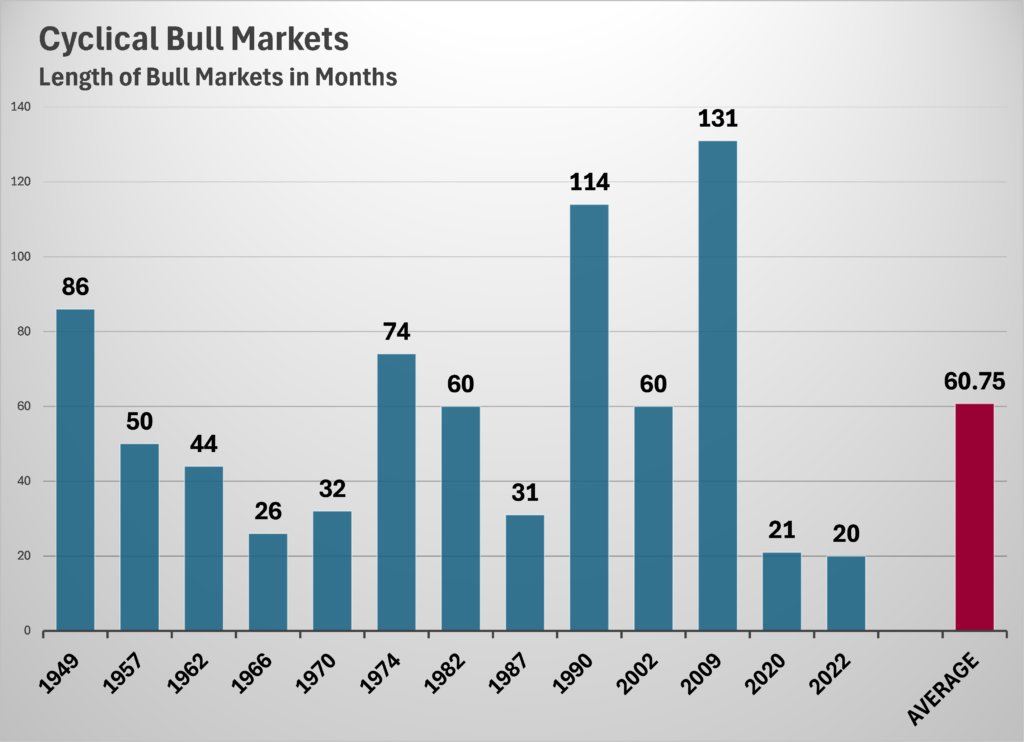
The average length of a cyclical bull market is 58 months. The shortest bull market was 21 months after the pandemic lows of 2020 before inflation and supply-side economics collided with earnings recovery. It seems unlikely another short-lived bull market would follow so quickly when the economic backdrop is strong and earnings for Q2.2024 are coming in at 11.5% and are expected to exceed 12%! This does not mean the current bull cycle is immune to corrections. It simply means that investors should remain open to the idea that this bull market may last much longer than the current market panic would suggest.
S&P500 Earnings are Solid
75% of the S&P500 companies have reported earnings for the second quarter of 2024. 78% of the companies reporting have had positive surprises in earnings per share, and 59% of the companies have had a positive surprise when reporting top line revenue.
The current estimate of 11.5% growth in earnings blends actual and estimated earnings for those companies that are yet to be reported. If 11.5% is the final number, then the second quarter of 2024 will be the highest since 2021. The current earnings growth rate compares to a prior estimate of 8.9% on June 30 when the second quarter ended. July has proven to be exceptionally good for earnings!
July was also a month where the S&P 500 index prices fell 6.6%, the NASDAQ 100 index fell 10.8%, and shares for the Semiconductor industry fell 22.6%. This drop had nothing to do with current earnings. Instead, concerns in the market have shifted rapidly that a recession is starting. In response, have analysts lowered EPS estimates more than normal for S&P 500 companies for the third quarter? No.
During July, analysts lowered 3Q earnings estimates no more than average. The Q3 EPS estimate for the S&P 500 index fell 1.8% from June 30 to July 31. But this is normal. In a typical quarter, analysts usually reduce earnings estimates during the first month of a quarter. During the past five years (20 quarters), the average decline in the bottom-up EPS estimate in the first month of a quarter has been 1.8%. Hence, the drop in index prices is not driven by earnings. In addition, the drop in stock market returns is not driven by weak earnings in the few sectors that dominate the S&P 500 index, as shown below.
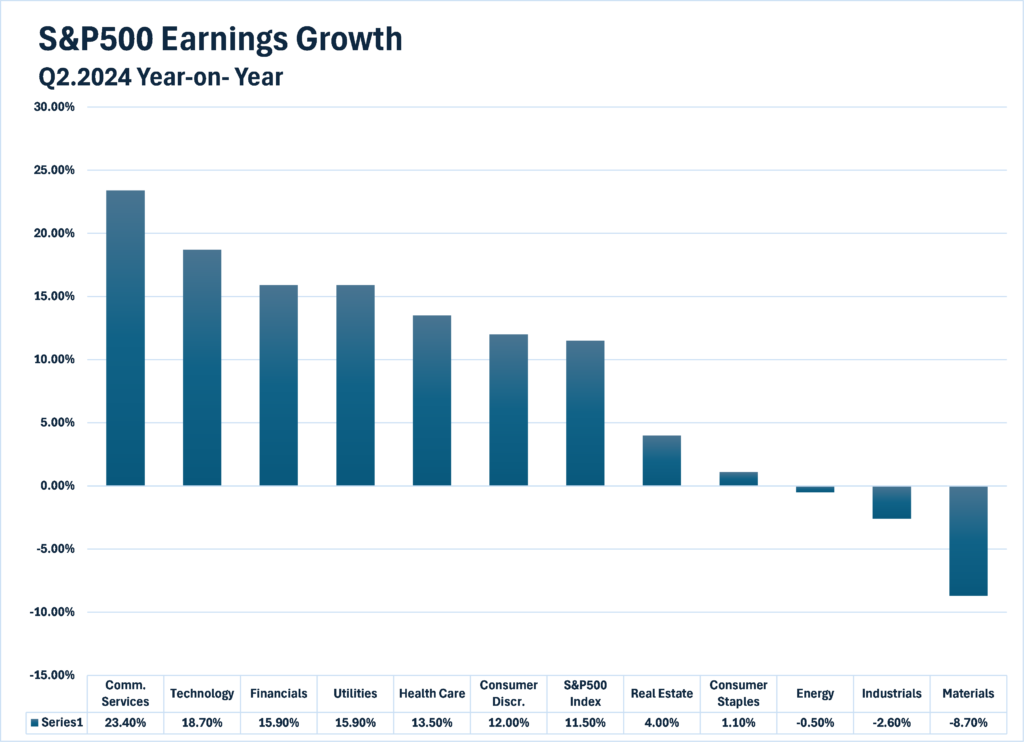
Earnings growth can be broken down into sales growth and profit margin growth:
- Sales growth tracks nominal GDP growth, which makes sense since one way to measure GDP is the total final sales across the economy. Nominal GDP came in at 6% last year for one of the best years in recent memory. The stage is set for similar growth this year.
- Profit margins are also strong and could be another reason to expect solid earnings growth going forward. Cost-cutting is the main driver, and this is happening without a recession. The result will be companies that are leaner, more agile, and more productive. If a recession does occur, companies will be better prepared.
The combination of strong sales growth and improving profit margins should continue to support earnings growth going forward, regardless of the panic in the market currently.
Stock market Valuations Remain Attractive
The forward P/E ratio for the S&P500 is 20.7. This P/E ratio is above the 5-year average of 19.3 and above the 10-year average of 17.9. At the same time, the trailing 12-month P/E ratio is 25.9, which is above the 5-year average of 23.5 and the 10-year average of 21.5.
P/E ratios confirm that the market is not materially overpriced. Valuations do not explain the prices drop of the past two weeks, although several top companies within the index were trading at a high price to earnings levels. If anything, the recent price drop confirms that valuations are a weak tool to define market tops and bottoms even though valuations do drive cyclical trends. What I can say for sure is that stocks, for now, should not be abandoned on valuation grounds.
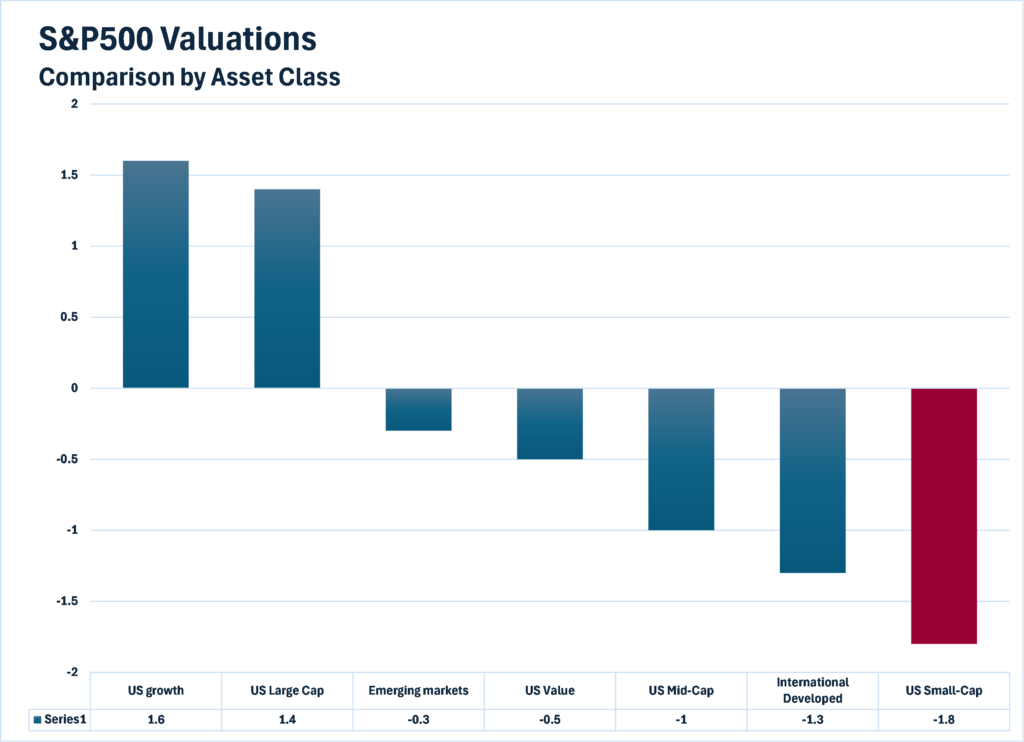
The next chart above compares valuations for the major equity asset classes. The metric used is called Z-score. A Z-score of zero means the current value is at the long-term average and other numbers define the number of standard deviations above or below the average.
US large cap stocks, dominated by large growth names, command a higher valuation than they normally do. On the other side, the remainder of the US market – value stocks, mid-caps, and small caps – all trade cheaper than historically. US small caps trade two standard deviations below where they have traded historically. Put another way, US small caps have only been cheaper than they are today 6% of the time!
It should be mentioned that developed international markets also look attractive. In fact, there has been some positive momentum in areas like India, Türkiye, and Taiwan, but most international economies remain weak, and their stock market performance is lackluster. Hence, the value play to take advantage of is US mid- and small caps. Currently, our clients are well positioned in these equity asset classes (excludes index and income portfolios). The fact we have cash on the sidelines also implies that the current price drop is a solid opportunity to buy the dip.
So What Happened in July?
I believe several narratives blended together in late July to cause a market panic, even though the outlook remains stable:
- Capital Investments in AI – The original spark behind the market drawdown starts with AI. Earnings announcements by Meta and Microsoft both beat expectations, but forward guidance discussions by senior management revealed a real concern about the level of investment in AI software and supporting infrastructure. Both companies are the largest buyer of Nvidia chips by huge margins. And both indicated that the risk of under-investing in AI far outstripped over-investing. However, the earnings discussions made clear that investment levels in AI would decline slightly going forward. This caused semiconductor shares to fall sharply, which was made worse by production problems at Nvidia. As Nvidia goes, so goes the index.
- Profit Taking – The last two weeks have been notable for after-the-fact announcements that large investors and company insiders have been selling shares. Sales of Apple shares by Berkshire Hathaway were the most notable in scale but mirror other announcements of large sales by hedge funds and corporate insiders. In aggregate, the selling volume has been significant, but the total volume profile for July was low compared to prior market corrections.
- Concern About the Longer-term Economic Outlook – Recession fear has increased markedly and is linked to the idea that the Fed made a mistake in not lowering rates in July. The market narratives for a hard landing have overtaken discussion for a soft-landing, but these narratives remain speculative, and often leap-frog beyond the data. More important, the actual timing of a recession may still be months away!
- Japan – Japan has been a major supplier of liquidity for the global community and for the US. Specifically, low borrowing costs have caused many investors, small and large, to borrow funds in Japan and invest those funds in US Treasuries, US stocks, bitcoin, and leveraged investments. Recent up moves in the Yen have forced these trades to unwind as the FX losses have been large. For now, the ‘Japan carry-trade crisis’ is only just starting and is forcing the riskiest and most leveraged bets in US markets to liquidate. This selling is not the cause of the market drawdown but is reinforcing the move lower (e.g. a positive feedback loop). In the worst-case, unwinding the carry trade could result in heavy sales of US Treasuries and a potential credit crisis where US rates spike. That scenario has not started and coordinated bank action by Japan and the US is likely to stop that from happening. However, the fear of a potential credit crisis is evident in the headlines. Looking beyond fears, Treasuries still represent a safe-haven for investors.
- Panic – There is no doubt that the speed and magnitude of the recent stock price moves have been made worse by investor panic. This is the overriding issue, regardless of all the narratives.
Conclusion
Risk Management action is well justified with risk-off signals generated on July 19. Saffron managed index portfolios have moved to 100% cash and equity share portfolios are at 25-35%% cash.
Based on the economic data, there is good reason to remain optimistic about the US economic outlook. I also remain confident that US shares can rebound soon, especially those with good factor scores as defined by value, profitability, growth prospects, price momentum, and the ability of management to forecast future earnings.
As far as re-entering the market, the priority is to buy long duration fixed-maturity bonds on dips, both Treasuries and high-rated corporates. Index portfolios will re-enter the market using systematic risk-on signals and only after a rebound is confirmed to be sustainable.
Have questions or concerns about your retirement plan or portfolio? We’d love to here from you. You can schedule a meeting here


