January returns for the S&P 500 index (+2.7%) exactly offset the losses seen in December. It was a rollercoaster month with another all-time high for the S&P 500 index, followed by sharp drops triggered by a new IA model from China and tariff concerns on the last day of month. Nevertheless, economics remain sound given strong earnings results for the fourth quarter, strong consumer spending, and solid GDP growth. Having said that, the first month of the year favored developed markets equities over US equities, with the MSCI Europe index (+7.01%) posting stronger gains.
The following analysis reviews January returns by asset group, sector, and the key factors that drive returns. The aim of the visual summary is to help investors to identify new opportunities and to benchmark returns for your portfolio.
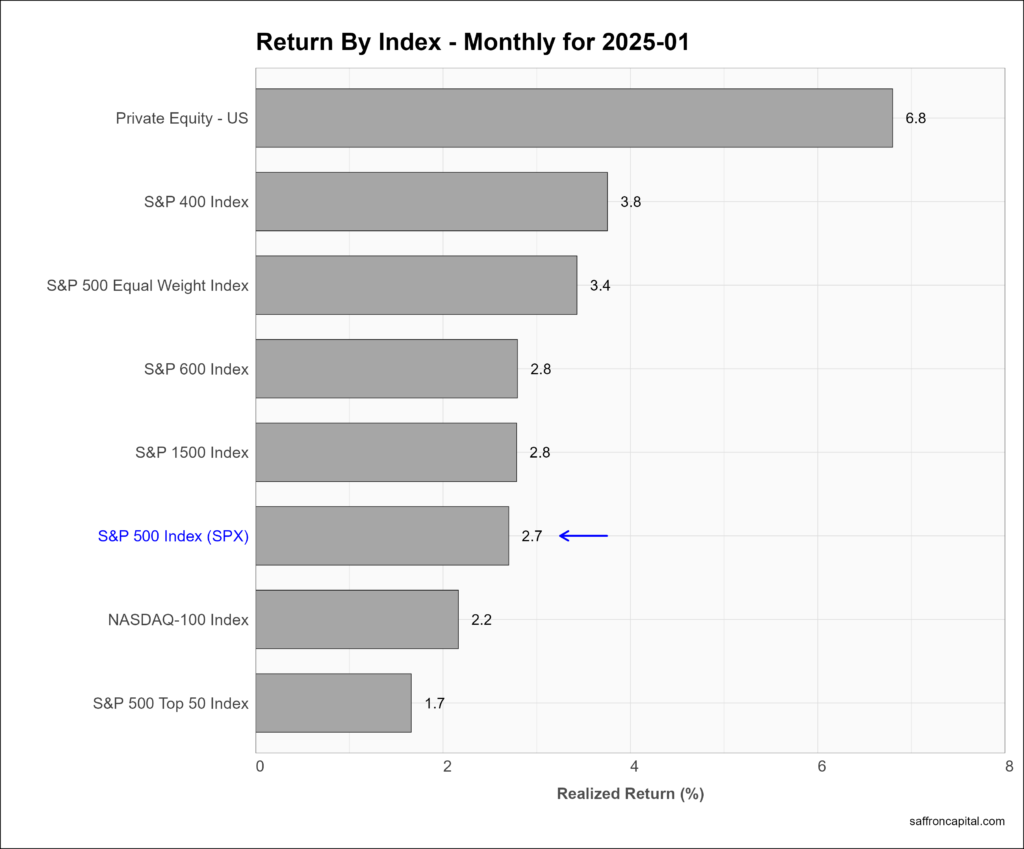
Core US Indices
It’s a telling start to the year that mega-cap stocks are lagging mid and small cap indices. At the same time, the equal-weighted S&P 500 index also beat the large-cap index . As a result, January’s returns were the result of broad market performance. This simple fact may have been overlooked by many distracted by the new administration, the Fed policy to reduce interest rates more slowly, or the drawdown in semiconductor stocks.
Click to enlarge
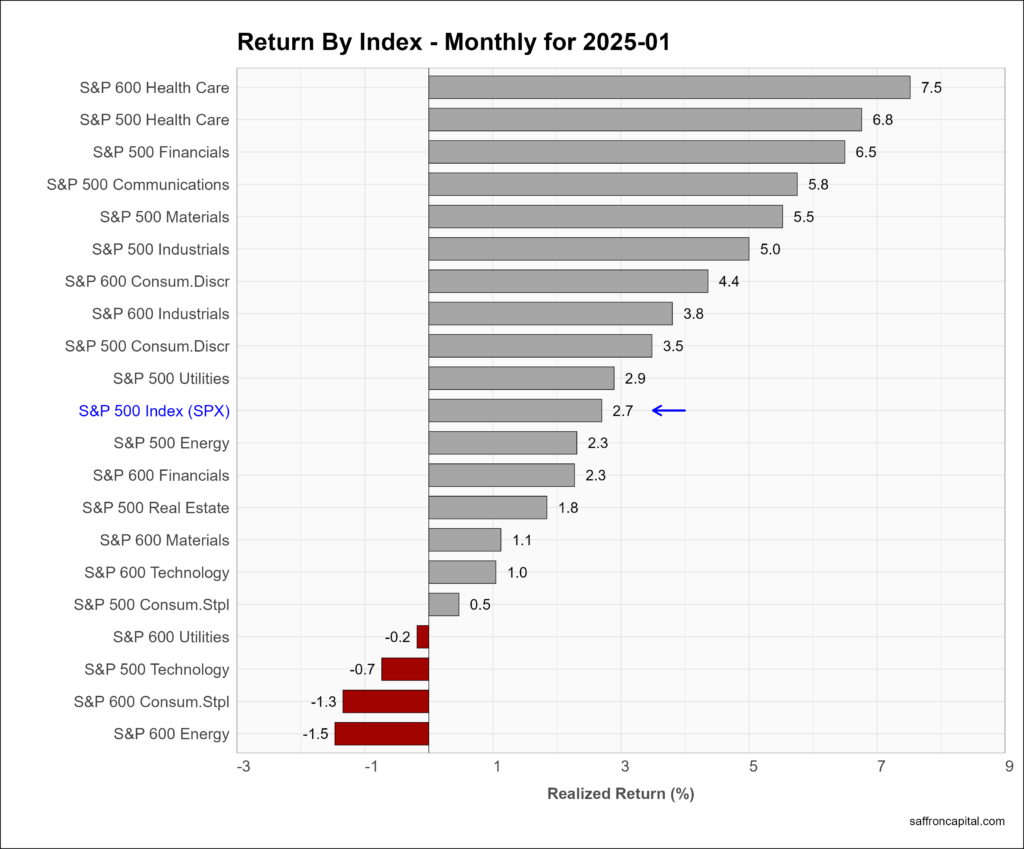
US Sector Indices
Most sectors posted gains in January, led by small-cap Health Care (+7.5%), large-cap Financials (+6.5%), and Communication Services (+5.8%). Laggards included small-cap Energy (-1.5%), small-cap Consumer Staples (-1.3%), and large-cap Technology (-0.7%). Market breadth is further confirmed with 6 of 11 large-cap sectors outperforming the S&P 500 index.
Click to enlarge
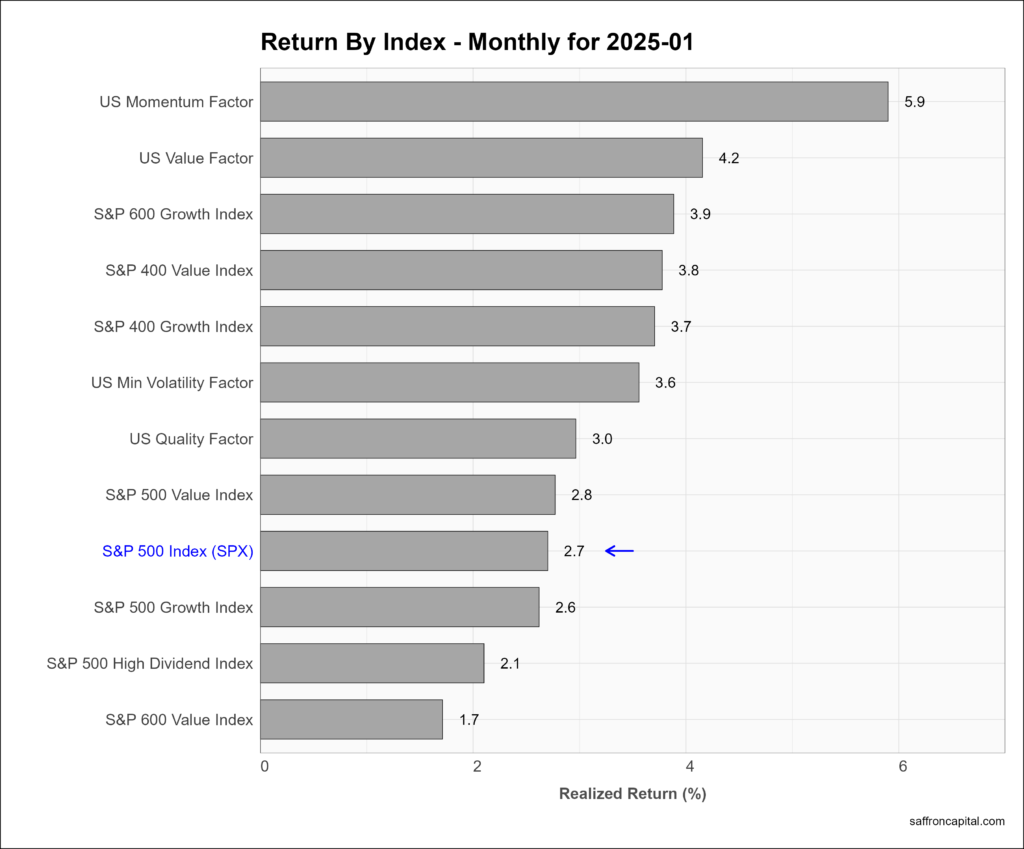
US Factor Indices
Factor portfolios are constructed to emphasize the core drivers behind returns, which include company size, relative value, profitability, growth, and momentum. Multi-factor portfolios combine two or more factors. During January, all the reported factor portfolios had positive gains, led by Momentum (+5.9%), US Value (+4.2%) and small-cap Growth (+3.9%).
Click to enlarge
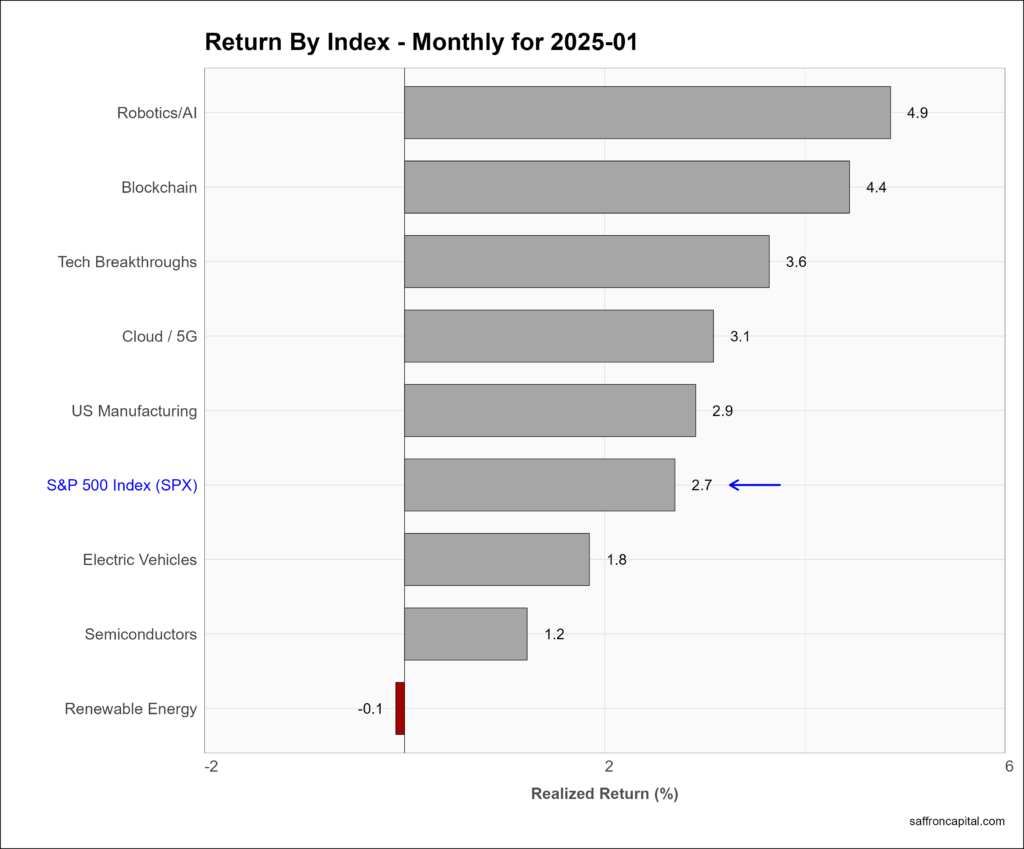
US Megatrend Equities
US megatrend equities are thematic growth portfolios. The aim is to select shares that capture the primary growth trends of the U.S. economy. For example, January returns were led by company shares engaged in Robotics/AI (+4.9%) and Blockchain technology (+4.4%). Manufacturing (+2.9%) shares in the US delivered median performance among the tracked portfolios. Shares for renewable Energy (-0.1%) and semiconductors (+1.7%) were the weakest of the tracked portfolios.
Click to enlarge
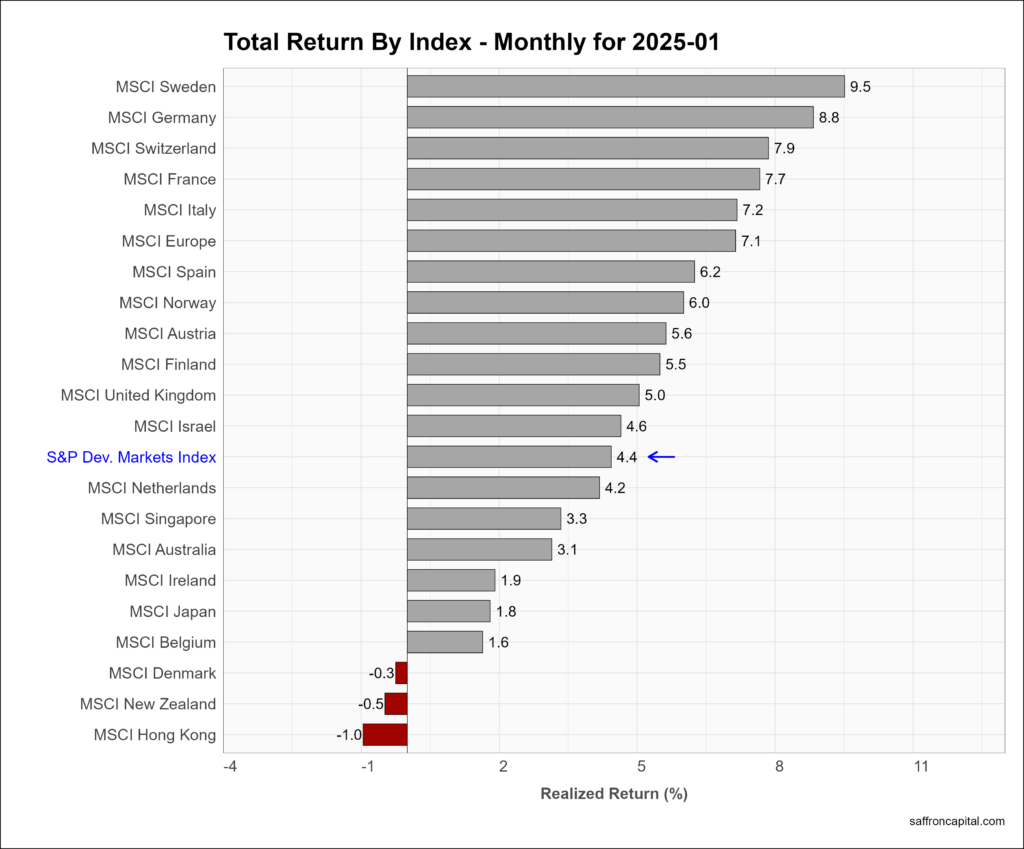
Developed Market Equities
International Developed Markets index (+4.4%) led equity returns to start the year with the Nordic and European countries setting the pace. The MSCI Europe index (+7.1%) easily outperformed the US, lead by Sweden (+9.5%), Germany (+8.8%) and Switzerland (+7.9%). Stocks in Japan (+1.4%) trailed the group index and US shares.
Click to enlarge
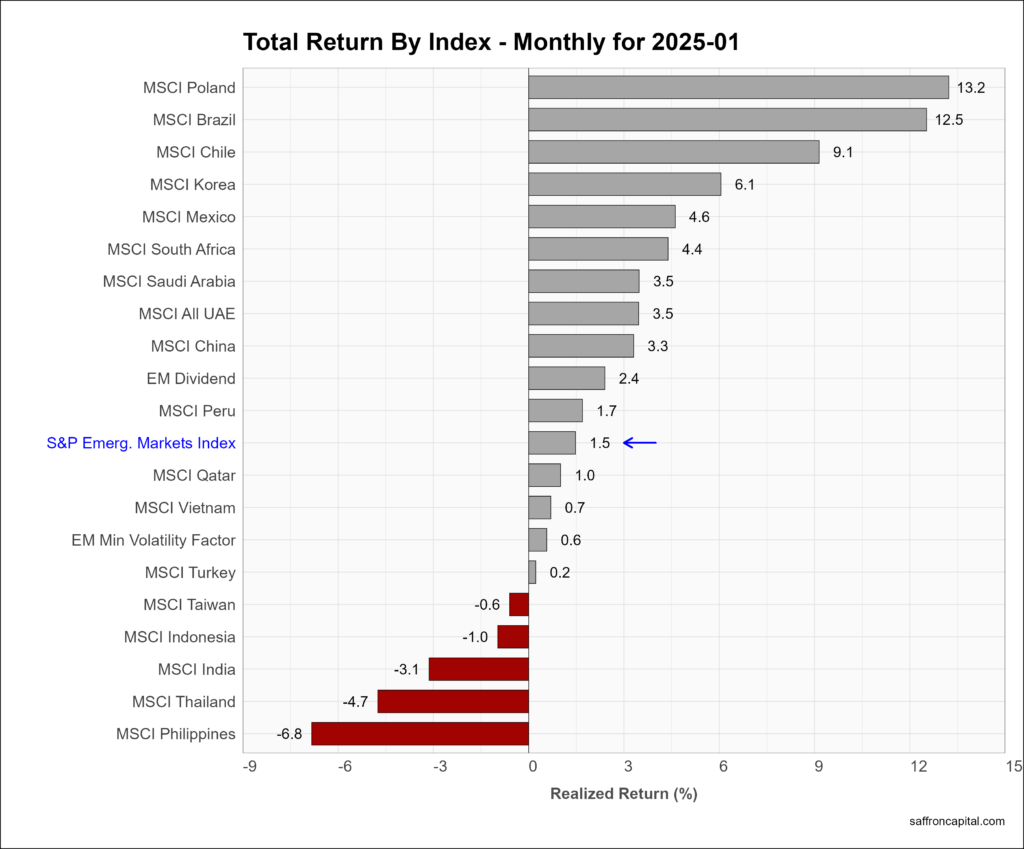
Emerging Market Equities
The S&P Emerging Markets Index (+1.5%) was also up in January, trailing developed market returns. However, several exceptions are worth noting, including Poland (+13.2%), Brazil (+12.5%), Chile (+9.1%), and South Korea (+6.1%). The weakest EM stock markets included the Philippines (-6.8%), Thailand (-4.7%), and India (-1.0%). The MSCI China index (+3.3%) beat the group average and US shares.
Click to enlarge
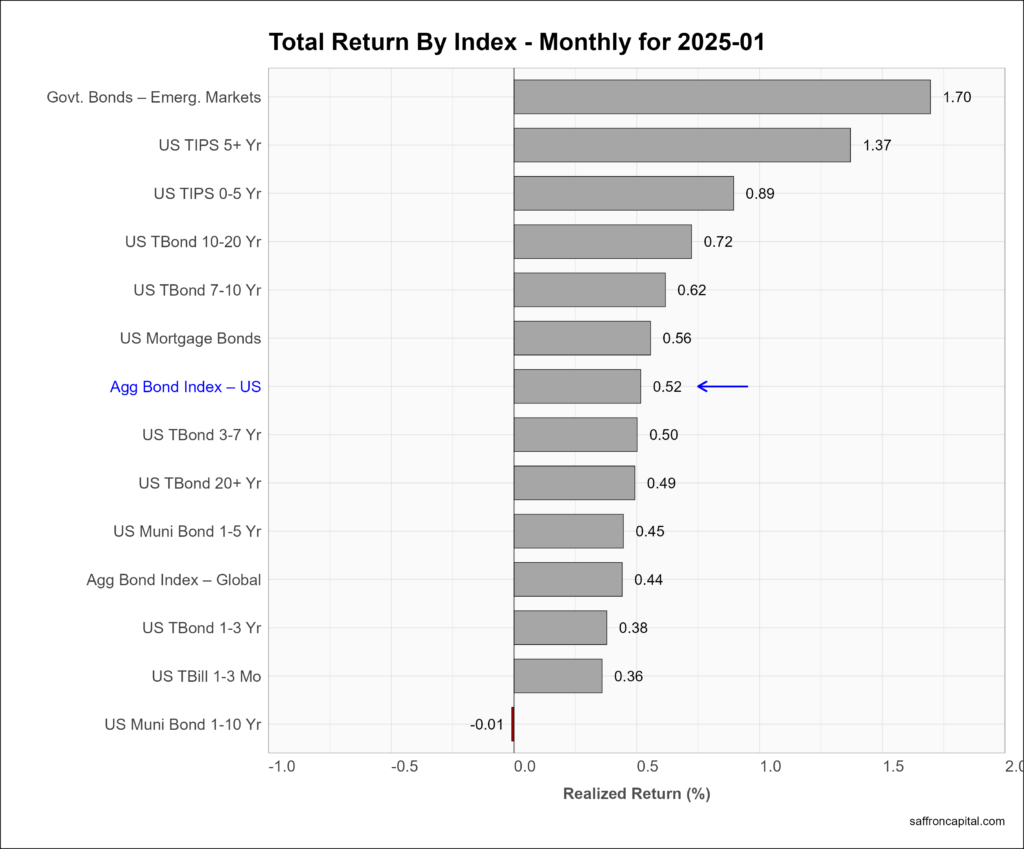
Government Bonds
During January, the yield-to-maturity on the 10-year Treasury Note fell from 4.80% to 4.50%. As a result, the US fixed income markets turned positive. January returns on the US Aggregate Government Bond Index (+0.52%) outperformed Global Government Bonds (+044%) but lagged the performance of Emerging Market Government (+1.70%) bonds. US Treasury Inflation Protected Securities (+1.37%) also had strong returns.
Click to enlarge
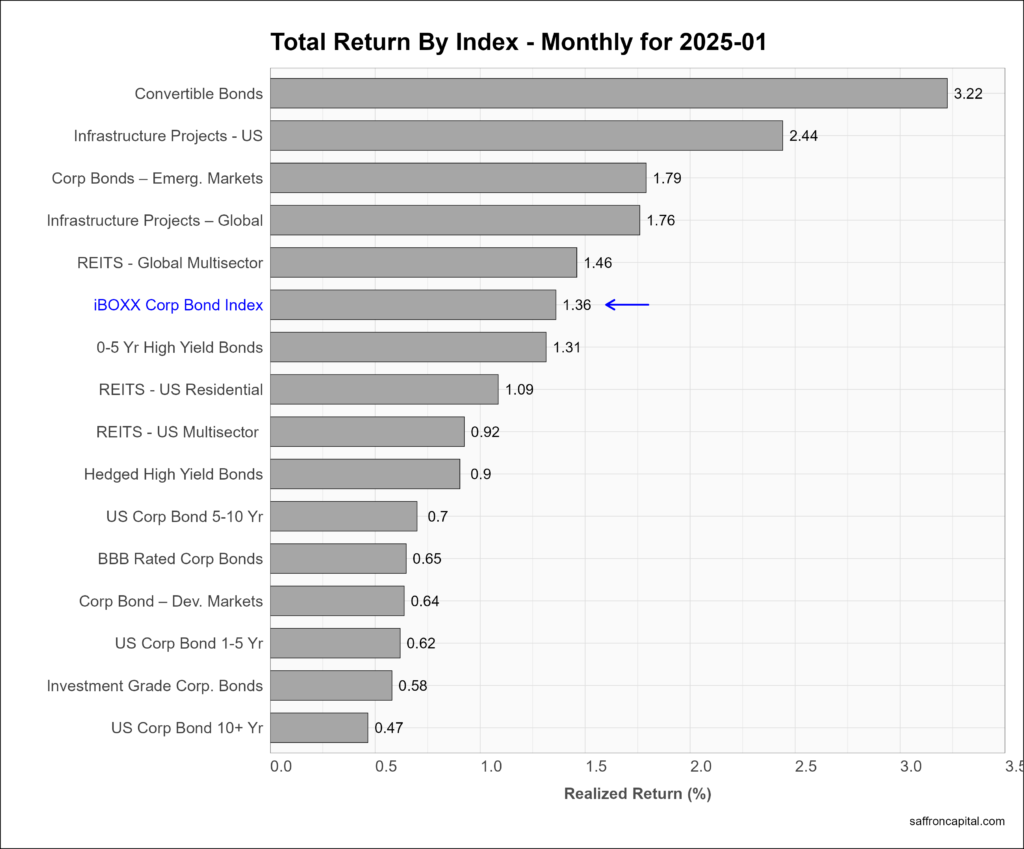
Corporate & Infrastructure Bonds
The yield-to-maturity on a 5-year corporate A-rated bond fell from a high of 5.40% in midmonth to a low of 5.18%. Meanwhile, the iBoxx Corporate Bond Index (+1.36%) was positive. Top sector returns included Convertible Bonds (+3.22%), US Infrastructure Project Bonds (+2.44%), and Emerging Market Corporate Bonds (+1.79%). Finally, returns on US Multisector REITS (+0.92%) failed to keep pace with the group index.
Click to enlarge
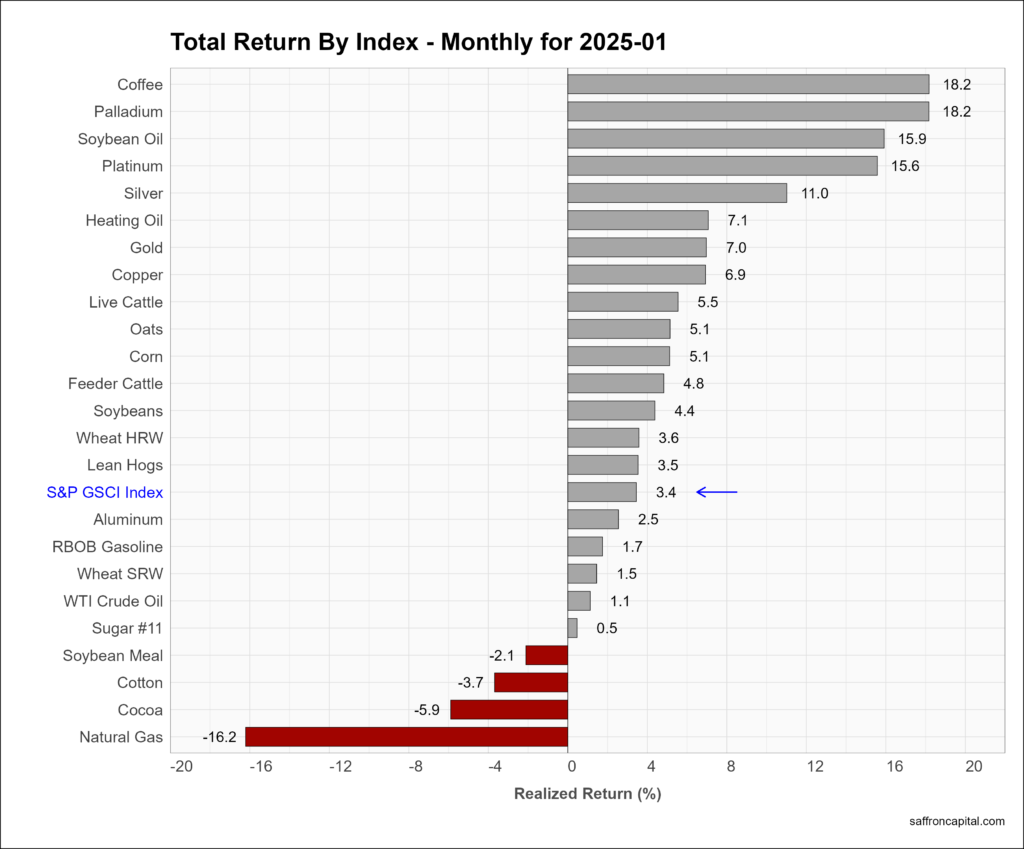
Commodities
Commodities, as measured by S&P GS Commodity Index (+3.4%) had the strong gains January, led by Coffee (+18.2%) which is entering its 5th harvest year with demand exceeding supply. Precous metals were notable give returns for Palladium (+18.2%), Platinum (+15.8%), Silver (+11.0%) and Gold (+7.0%). The weakest commodities were natural gas (-16.2%), Cocoa (-5.9%), and Cotton (-3.7%).
Click to enlarge
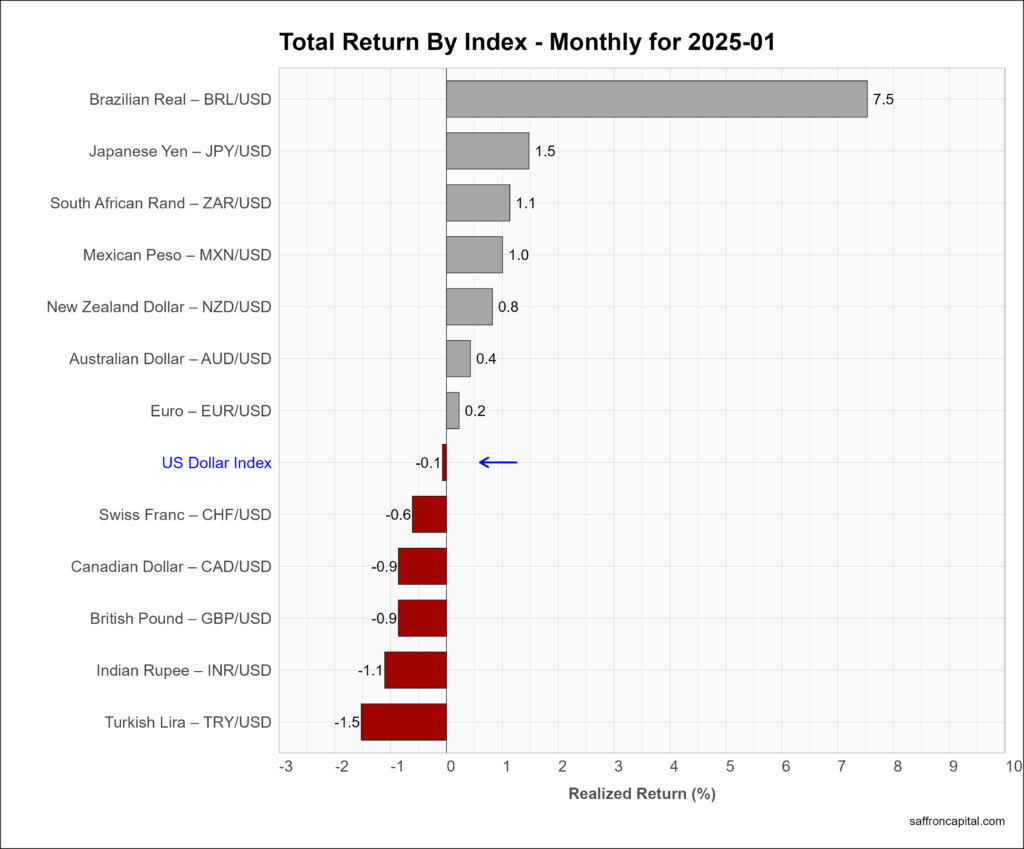
Currencies
The U.S. Dollar index (-0.1%) was basically flat in January with the Brazilian Real (+7.5%) posting the strongest monthly returns. The Japanese Yen (+1.5%) was also strong, while the Euro (+0.2%) was near unchanged. The Indian Rupee (-1.1%) and the Turkish Lira (-1.5%) were the weakest currencies.
Cryptocurrencies
Cryptocurrencies had outsized returns in January, led by XRP (+45.9%), Solana (+22.4%), and Cardano (+11.7%). Bitcoin (+9.6%) was the median return among the mainstream crypto assets.
Click to enlarge
Have questions or concerns about the performance of your portfolio? Could you benefit from a custom portfolio formulation that better aligns to the key factors behind returns? Whatever your needs, we are here to listen and to help. Contact us to schedule a meeting.
Saffron Capital LLC is a registered investment advisor that is employee-owned and Minnesota-based.


