
March 2026 Returns and Asset Performance
April 1, 2026Performance of Major Asset Classes
April 2026
Introduction
April returns confirmed a fast and powerful shift to risk-on trading as strong earnings, resilient growth, and accelerating AI investment demand drove gains across global markets. The S&P 500 surged +10.5%, while the NASDAQ-100 rallied +15.7% as large-cap technology regained leadership. Moreover, market breadth improved materially. The S&P 600 Small Cap Index gained +10.3%, confirming participation beyond mega-cap stocks. Technology led sector performance, with the S&P 500 Technology sector rising +20.0%, while Semiconductors (+40.4%) and Robotics/AI (+33.1%) dramatically outperformed on continued demand for advanced chips, AI infrastructure, and high-performance computing. Momentum and growth factors also sharply outperformed defensive strategies.
Outside the U.S., international equities rallied as a weaker dollar and improving risk sentiment supported global markets. The S&P Developed Markets Index gained +5.7%, while the S&P Emerging Markets Index advanced +12.5%, led by Korea (+30.7%) and Taiwan (+26.7%) given heavy reliance on semiconductor supply chains. Fixed income markets stabilized, although long-duration Treasuries continued to lag amid persistent inflation concerns and a steeper yield curve. Meanwhile, commodities advanced with the S&P GSCI Index up +6.6% on strength in gasoline, crude oil, and industrial metals. Finally, the U.S. dollar weakened by -1.8%.
The following analysis is a visual summary of monthly and annual returns by asset group. The goal is to help investors benchmark portfolio performance and identify emerging cross-asset trends shaping market leadership.
Core US Indices
April marked a sharp reversal from the March correction as investors rotated aggressively back into growth and risk assets. Mega-cap technology regained leadership. The NASDAQ-100 surged +15.7%, while the S&P 500 Top 50 gained +11.6% on strong earnings and continued enthusiasm around artificial intelligence and advanced computing. The rebound also broadened beyond Big Tech. The S&P 500 rallied +10.5%, while the S&P 600 Small Cap Index and S&P 1500 both gained more than +10%. However, the Equal Weight S&P 500 lagged at +6.0%, which confirms that leadership still concentrated in larger growth-oriented companies.
Year to date, smaller and broader indices still lead despite April’s rebound in mega caps. The S&P 600 remains the top performer at +14.3%, followed by the S&P 400 at +10.5%. Meanwhile, the Equal Weight S&P 500 (+6.7%) continues to outperform the cap-weighted S&P 500 (+5.7%), which suggests market participation remains healthier and less dependent on the largest stocks than in prior years. In contrast, the S&P 500 Top 50 continues to lag at +2.9%, despite April’s powerful recovery in mega-cap technology.
US Sector Indices
April returns delivered a violent reversal in sector leadership as investors rotated back into growth, cyclicals, and artificial intelligence themes. Technology led decisively, with S&P 500 Technology surging +20.0% and small-cap Technology rallying +23.9% as semiconductor and AI-related stocks exploded higher. Industrials also posted strong gains, especially in small caps (+11.6%), reflecting renewed optimism around manufacturing, infrastructure, and capital spending. Meanwhile, defensive leadership faded. Utilities and Consumer Staples lagged badly in large caps, while Energy became the only major sector to decline (-2.6%) as oil prices stabilized after the March spike. Overall, April reflected a broad return to risk-taking and a sharp unwind of the prior inflation and geopolitical trade.
Year to date, leadership still favors inflation-sensitive and cyclical sectors despite April’s rebound in growth. Energy remains the dominant winner, gaining +34.3% in the S&P 500 and +48.3% in the S&P 600. Small-cap Technology also stands out at +31.4%, while Materials and Industrials continue to post strong double-digit gains. In contrast, several large-cap growth and domestic demand sectors still lag. Financials remain down -4.3%, while Health Care has fallen -5.3%. Overall, 2026 continues to reward sectors tied to commodities, industrial activity, and capital investment, although April marked a major recovery in technology leadership.
US Factor Indices
Factor portfolios group stocks by shared characteristics such as value, growth, momentum, quality, and size to isolate specific drivers of market performance. April returns for long-only factors showed a sharp return to risk-taking and trend-following behavior after the March correction. Momentum led decisively, surging +18.3%, while the US Value Factor gained +17.5% and large-cap Growth rallied +14.8%. Small-cap growth also rebounded strongly at +11.6%. In contrast, defensive strategies lagged badly. Minimum Volatility gained just +2.0%, while the High Dividend Index rose only +1.2%. Overall, April reflected aggressive buying of cyclical, higher-beta, and AI-linked exposures as investors rotated away from defensive positioning.
Year to date, leadership still favors value and income despite April’s powerful growth rebound. The US Value Factor leads at +22.7%, while small-cap Growth (+14.6%) and small-cap Value (+13.9%) also post strong gains. Moreover, the High Dividend Index remains a top performer at +13.7%, which confirms continued demand for cash flow and valuation support. In contrast, large-cap Growth (+5.4%) and Quality (+4.6%) continue to lag broader factor leadership. Overall, 2026 reflects a market that still rewards cyclical exposure, valuation discipline, and smaller-cap participation more than traditional defensive growth leadership.
US Thematic Portfolios
Thematic portfolios group stocks around broad structural trends, such as artificial intelligence, electrification, energy security, and supply chain reshoring. April marked a powerful return to innovation and high-growth themes as investors aggressively rotated back into AI and advanced technology. Semiconductors led decisively, surging +40.4%, while Robotics/AI gained +33.1% as markets repriced the long-term earnings potential of AI infrastructure and computing demand. Blockchain also rebounded sharply (+23.0%) alongside strength in Bitcoin and digital assets. Meanwhile, industrial and resource-linked themes remained strong. Rare Earth Metals gained +19.8%, Renewable Energy rose +13.6%, and US Manufacturing advanced +11.4%. In contrast, Aerospace & Defense lagged and finished roughly flat.
Year to date, leadership still concentrates in themes tied to infrastructure, energy transition, and strategic technology supply chains. Semiconductors dominate at +53.3%, followed by Rare Earth Metals at +42.6% and Robotics/AI at +28.6%. Renewable Energy (+26.4%), US Manufacturing (+19.1%), and Uranium/Nuclear Energy (+17.5%) also continue to outperform the broader market. In contrast, Blockchain has gained just +9.9%, while Aerospace & Defense continues to lag at +1.9%. Overall, 2026 continues to reward themes tied to AI compute demand, electrification, industrial reshoring, and resource scarcity.
Click to enlarge
Developed Market Equities
April returns show developed markets participating in the global risk-on rebound, although gains generally lagged the strongest U.S. technology benchmarks. The S&P Developed Markets Index gained +5.7%, supported by broad advances across Europe and Asia. Israel (+12.7%), Finland (+11.9%), and Austria (+10.1%) led performance, while Germany (+6.5%) and Japan (+5.5%) also posted solid gains as industrial and technology shares recovered. Meanwhile, defensive and commodity-heavy markets lagged. Norway gained just +1.4%, while the U.K. rose +3.5%. Overall, developed markets benefited from improving global risk sentiment, a weaker dollar, and renewed demand for cyclical and export-oriented equities.
Year to date, leadership remains highly uneven across developed markets. Norway continues to dominate at +30.1% on strong energy and commodity exposure, while Israel (+18.8%), Finland (+14.6%), and Australia (+12.6%) also post strong gains. Japan remains resilient at +10.4%, benefiting from continued manufacturing and technology strength. In contrast, parts of continental Europe continue to lag. Germany remains slightly negative at -0.6%, while Denmark has fallen -4.0%. Overall, developed market performance in 2026 still favors commodity-linked, export-oriented, and industrial economies over slower-growth European markets.
Click to enlarge
Emerging Market Equities
April returns show emerging markets regaining strong momentum, led by Asia and semiconductor-linked exporters. The S&P Emerging Markets Index gained +12.5%, outperforming most developed market benchmarks. Korea surged +30.7% and Taiwan jumped +26.7% as investors rotated aggressively into AI, semiconductor, and technology supply-chain exposure. Turkey (+9.9%) and Vietnam (+8.8%) also posted strong gains, while India (+5.5%) and Brazil (+3.4%) lagged but remained positive. China rose just +2.5%, reflecting continued skepticism around domestic growth and property weakness. In contrast, Indonesia fell -5.4%, the weakest major market in the group. Overall, April reflected a sharp rebound in high-beta export economies tied to global technology and manufacturing demand.
Year to date, leadership remains concentrated in a handful of emerging markets. Korea leads decisively at +65.4%, followed by Taiwan at +41.5%, as AI infrastructure and chip demand continue to dominate global equity flows. Brazil (+25.0%) and Turkey (+23.4%) also show strong gains tied to commodities and cyclical recovery. Meanwhile, the S&P Emerging Markets Index is up +16.8%, reflecting broad improvement across the asset class. However, dispersion remains extreme. Indonesia has fallen -20.2%, while India (-8.6%) and China (-4.2%) continue to lag. Overall, 2026 still favors export-driven and commodity-linked emerging markets over slower domestic-demand economies.
Click to enlarge
Government Bonds
April showed another weak month for duration as long-term sovereign bonds remained under pressure. US Treasury 20+ Year bonds fell -0.84%, while 10–20 Year bonds lost -0.50%. Intermediate Treasuries were flat to slightly negative, and the US Aggregate Bond Index gained just +0.17%. In contrast, inflation-linked and short-duration assets outperformed. Emerging market sovereign bonds gained +2.49%, while 5+ Year TIPS rose +1.08% and short-term municipals returned +1.19%. Overall, April reinforced the market preference for carry, inflation protection, and shorter duration over long-term rate exposure.
Year to date, leadership remains concentrated in inflation-sensitive and short-duration fixed income. Short-term TIPS lead, with 0–5 Year TIPS up +1.93%, followed by 5+ Year TIPS at +1.50% and T-bills at +1.17%. Emerging market sovereign debt and municipal bonds also remain positive. In contrast, long-duration Treasuries continue to struggle, with 10–20 Year bonds down -0.74% and 20+ Year bonds off -0.66%. The US Aggregate Bond Index is up just +0.20%, confirming that higher yields and persistent inflation expectations continue to limit broad bond market returns.
Click to enlarge
Corporate & Infrastructure Bonds
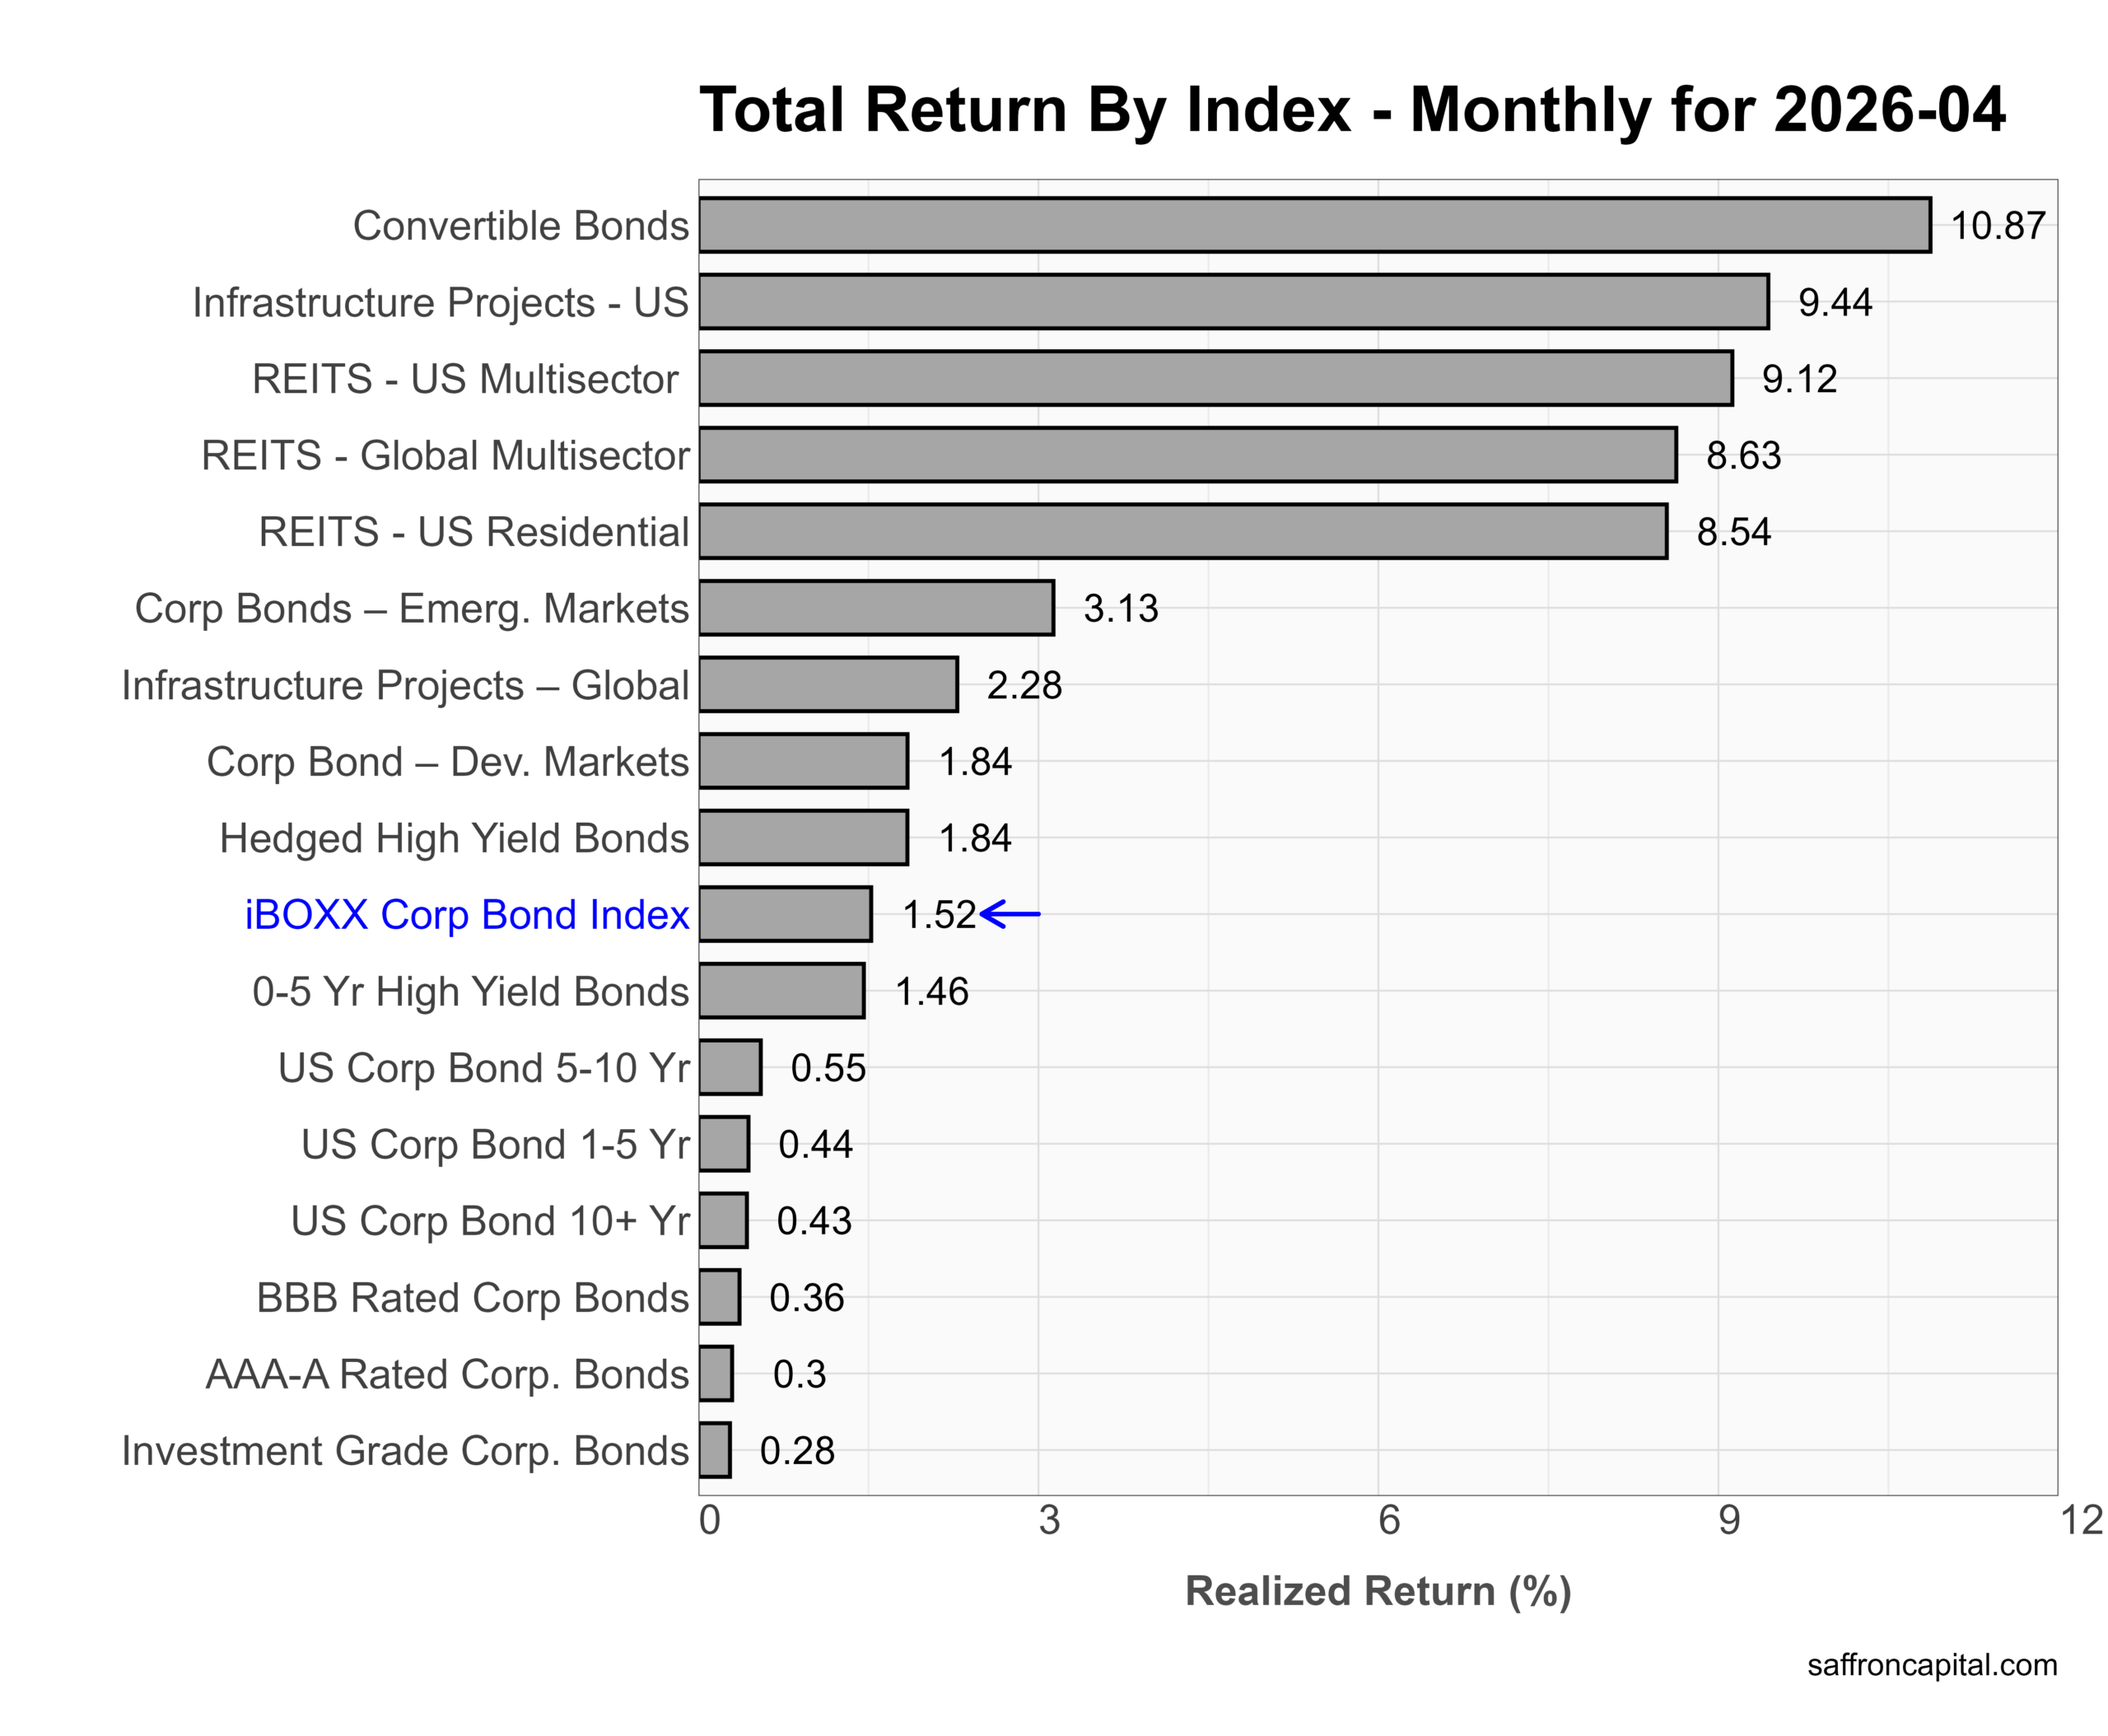
April favored equity-linked credit and real assets as spreads remained stable and risk appetite improved. Convertible bonds led with a +10.9% gain, while US infrastructure projects rose +9.4%. REITs also rallied sharply, with US Multisector REITs up +9.1% and Residential REITs gaining +8.5%. Core corporate bonds posted modest gains, with the iBOXX Corporate Bond Index up +1.5%, while investment-grade and long-duration corporates lagged below +0.5%. Overall, April rewarded spread exposure and equity-sensitive income assets more than traditional corporate duration.
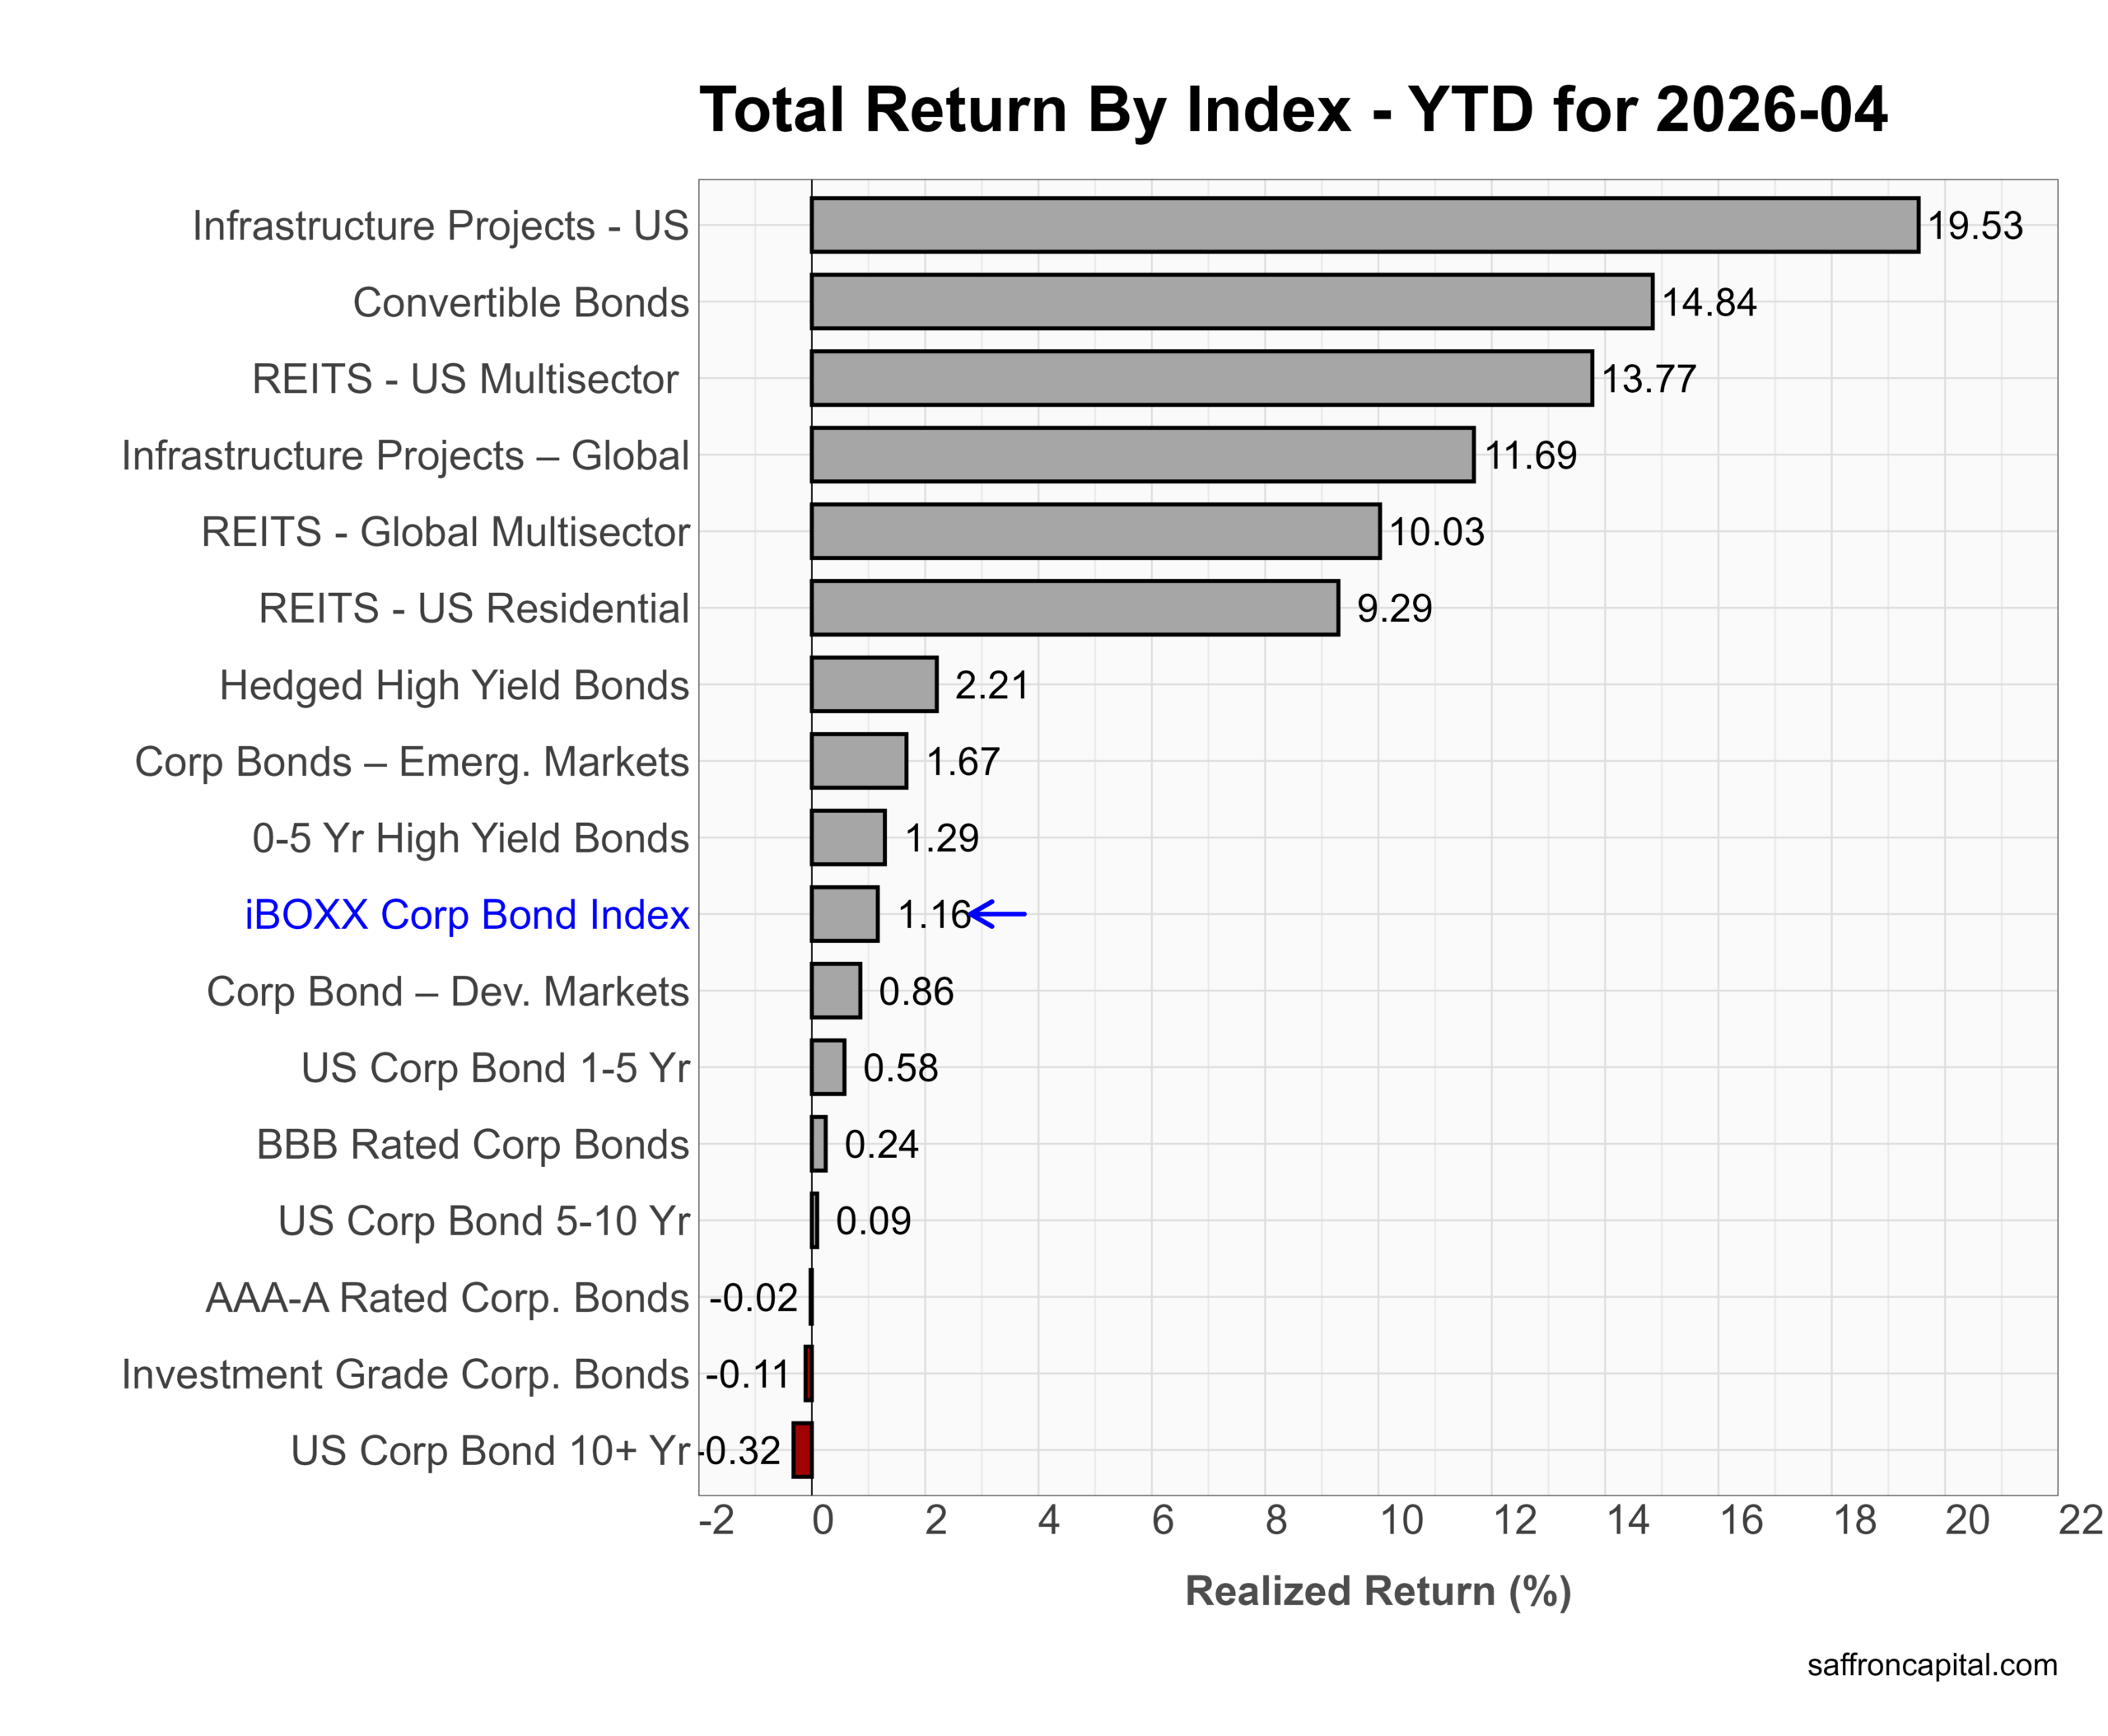
Year to date, leadership remains concentrated in infrastructure, REITs, and convertibles. US infrastructure leads at +19.5%, followed by convertible bonds at +14.8% and US Multisector REITs at +13.8%. Global infrastructure and REITs also remain strong. In contrast, traditional investment-grade corporates continue to lag, with the iBOXX Corporate Bond Index up just +1.2% and long-duration corporates still negative. Overall, 2026 continues to favor real assets and equity-linked income over pure duration exposure.
Click to enlarge
Commodities
April remained commodity bullish, though leadership broadened beyond crude oil. The S&P GSCI gained 6.6%. Cotton surged 17.4%, while RBOB gasoline rose 13.1% and soybean oil gained 10.9%. Wheat and cocoa also posted strong advances. Energy stayed firm, with WTI crude up 3.6%, but natural gas fell -3.8%. Precious metals weakened modestly, with gold down -1.0% and silver off -1.2%. Overall, April reflected continued inflation-sensitive strength across energy and agriculture.
Year to date, the trend remains overwhelmingly commodity bullish. The S&P GSCI is up 49.1%, led by gasoline (+110.5%), heating oil (+92.5%), and WTI crude (+83.0%). Soybean oil (+58.9%) and wheat (+34.7%) also show major gains. However, dispersion remains extreme. Cocoa has collapsed -41.2%, while natural gas (-24.9%) and coffee (-18.1%) continue to lag. In short, 2026 remains an energy-driven commodity bull market with sharp divergence beneath the surface.
Click to enlarge
Currencies
April saw broad dollar weakness. The US Dollar Index fell -1.8% as commodity and cyclical currencies rallied. The Brazilian real gained 4.5%, while the Australian dollar rose 4.4%. The pound (+3.0%), New Zealand dollar (+2.8%), and Mexican peso (+2.6%) also strengthened. Defensive currencies participated as well, with the Swiss franc up 2.4% and yen higher by 1.3%. Overall, easing dollar pressure and stronger global risk appetite supported foreign currencies.
Year to date, FX leadership favors commodity exporters. The Brazilian real leads at +10.3%, followed by the Australian dollar at +7.9%. The peso (+3.1%) and renminbi (+2.4%) also show gains, while the US Dollar Index is slightly negative at -0.1%. In contrast, the Turkish lira remains the weakest major currency at -4.9%. In short, 2026 FX markets favor commodity-linked and higher-beta currencies over the dollar.
Cryptocurrencies
April brought a sharp crypto rebound. Dogecoin led with a 15.4% gain, while Bitcoin rallied 11.8% and Ethereum rose 7.3%. Smaller gains followed in XRP (+2.2%), Avalanche (+2.0%), and Cardano (+1.8%). Solana was flat at -0.1%, while Tether remained unchanged. Overall, the rebound was concentrated in the largest and most liquid crypto assets.
Year to date, losses remain severe despite April’s recovery. Bitcoin is down 12.8%, while Ethereum has fallen 23.9%. XRP (-25.5%), Avalanche (-26.1%), Cardano (-26.1%), and Solana (-33.3%) continue to lag sharply. Tether remains stable near flat. In short, crypto rebounded in April, but the broader asset class remains deep in a 2026 drawdown.
Click to enlarge
Risk-Adjusted Royalty
Returns alone do not always tell the full story. Sharpe ratios measure how much return investors earned for each unit of risk assumed.
April’s leadership shifted decisively back toward technology and growth. Semiconductors posted the highest Sharpe ratio at 21.8, followed by the US Value Factor (19.6) and Robotics/AI (19.3). Large-cap technology also ranked near the top, with the S&P 500 Technology Index at 18.5 and the NASDAQ-100 at 18.1. Momentum (16.7), the S&P 500 Top 50 (16.4), and the S&P 500 Growth Index (16.1) also delivered strong risk-adjusted returns.
Importantly, leadership broadened beyond pure speculation. Convertible bonds (13.8), US multisector REITs (11.9), and the US Quality Factor (11.3) also ranked among the top performers. In short, April rewarded growth, AI, and large-cap technology, but with stronger market breadth and better risk-adjusted participation than earlier in 2026.
Have questions or concerns about the performance of your portfolio? Could you benefit from a capital preservation strategy or a custom portfolio formulation that better aligns to your return goals and risk appetite? Whatever your needs, we are here to listen and to help. Contact us here.
Saffron Capital LLC is a registered investment advisor that provides guided growth and risk-managed portfolios. The company is employee-owned and Minnesota-based.
Related posts


