
April 2026 Returns and Asset Performance
May 2, 2026Performance of Major Asset Classes
May 2026
Introduction
May returns reflected a more selective risk-on environment than April. U.S. equities extended their advance, but leadership narrowed as investors favored large-cap growth, momentum, and technology-related themes. The S&P 500 gained +5.3%, while the NASDAQ-100 surged +10.6%, driven by continued enthusiasm for artificial intelligence, cloud infrastructure, and semiconductor demand. Market breadth weakened as the Technology sector +19.8% was only sector to outperform the S&P 500 index. At the same time, smaller companies lagged. Factor performance reinforced the May performance trend. U.S. Momentum advanced +11.2% and Growth gained +8.1%, while defensive income-oriented strategies underperformed. Fixed income posted modest gains as longer-duration Treasuries and corporate bonds benefited from lower yields and stable credit conditions. In contrast, commodity markets moved sharply lower. The S&P GSCI Index declined -7.5%, led by weakness in crude oil, gasoline, and refined products despite strength in natural gas and several industrial metals. Cryptocurrency markets also paused after strong gains earlier in the year, with Bitcoin falling -3.9% and Ethereum declining -10.9%. Overall, May favored growth assets and duration exposure while commodity-linked and inflation-sensitive markets lagged.
The following brief provides a visual summary of May returns and year-to-date performance across major asset classes. The objective is to help investors benchmark portfolio results, evaluate market leadership, and identify emerging cross-asset trends that may influence portfolio positioning in the months ahead.
Core US Indices
May extended the equity rally, although leadership remained concentrated in large-cap growth and technology stocks. The NASDAQ-100 gained +10.6%, easily outperforming the broader market. For example, the S&P 500 advanced +5.3%, while the S&P 500 Top 50 gained +5.7%. Note that performance weakened as market capitalization declined. The S&P 400 Mid Cap Index rose +2.5%, the Equal Weight S&P 500 gained +2.6%, and the S&P 600 Small Cap Index advanced just +1.1%. The gap between the NASDAQ-100 and smaller-company indices highlights a market still driven by growth expectations rather than broad economic participation.
Year to date, leadership remains more balanced than the May returns suggest. The NASDAQ-100 leads with a gain of +20.3%, but small- and mid-cap stocks continue to post strong results. The S&P 600 has gained +15.6%, while the S&P 400 is up +13.3%. The S&P 500 has returned +11.3%, nearly matching the broader S&P 1500 at +11.4%. Meanwhile, the Equal Weight S&P 500 has gained +9.5%, outperforming the S&P 500 Top 50 at +8.8%. Year-to-date performance still points to healthy participation across the broader U.S. equity market.
US Sector Indices
Investors rewarded earnings growth and AI exposure while reducing exposure to commodity-sensitive sectors. S&P 500 Technology surged +19.8%, while S&P 600 Technology gained +14.3%, far outpacing the broader S&P 500 return of +5.3%. Outside of Technology, few sectors generated meaningful gains. Health Care and Consumer Discretionary posted modest advances, while Industrials, Materials, Financials, and Real Estate finished slightly lower. Energy ranked last as falling crude oil and refined product prices pushed the S&P 500 Energy sector down -5.6% and S&P 600 Energy down -7.5%.
Year to date, sector leadership remains split between Technology and Energy. Small-cap Technology leads all sectors with a gain of +50.3%, followed by S&P 600 Energy at +37.1% and S&P 500 Technology at +32.8%. Materials and Industrials also continue to post strong double-digit gains, reflecting ongoing investment in infrastructure, manufacturing, and capital spending. In contrast, several traditionally defensive and economically sensitive sectors continue to lag. S&P 500 Financials remain down -5.3%, Health Care has fallen -3.0%, and Communications sits at -1.4%. Despite Energy’s weakness in May, 2026 leadership still favors sectors tied to technology investment, industrial activity, and long-term capital formation.
US Factor Indices
Factor portfolios group stocks by shared characteristics such as value, growth, momentum, quality, and size. They help investors identify the themes driving market leadership. May delivered a clear signal. Investors favored growth and trend-following strategies. The US Value Factor gained 18.6%, Momentum rose 11.2%, and S&P 500 Growth advanced 8.1%, all well ahead of the S&P 500 return of 5.3%. In contrast, defensive strategies lagged. High Dividend fell 1.0%, while Minimum Volatility gained just 2.1%. The message from May was straightforward: investors rewarded growth, leadership, and risk-taking.
Year to date, leadership remains concentrated in Value, Momentum, and Growth. The US Value Factor leads at 40.4%, followed by Momentum at 26.3% and S&P 500 Growth at 20.9%. Small-cap Growth and Value also continue to post strong gains. Meanwhile, Quality, Minimum Volatility, and High Dividend remain near the bottom of the rankings. Overall, 2026 continues to favor cyclical exposure, earnings growth, and market leadership over defensive positioning.
US Thematic Portfolios
Thematic portfolios group stocks around long-term investment trends such as artificial intelligence, digital assets, electrification, energy security, and industrial reshoring. May returns confirmed the market’s preference for innovation and technology leadership. Blockchain gained 23.4%, Semiconductors rose 23.3%, and Robotics/AI advanced 20.5%. Tech Breakthroughs added 15.2%, while Renewable Energy gained 13.5%. In contrast, commodity-linked themes struggled. Uranium/Nuclear Energy fell 8.7%, and Rare Earth Metals declined 5.5%. The key takeaway is simple: investors favored technology, AI infrastructure, and digital asset exposure while reducing positions tied to energy and resource scarcity.
Year to date, leadership remains concentrated in themes connected to AI and advanced computing. Semiconductors lead with a gain of 89.1%, followed by Robotics/AI at 55.0% and Renewable Energy at 43.5%. Blockchain has gained 35.7%, while Rare Earth Metals have returned 34.8%. Manufacturing, electrification, and technology innovation themes also continue to outperform the broader market. Overall, 2026 continues to reward investors positioned for AI adoption, digital infrastructure, and long-term technology investment.
Click to enlarge
Developed Market Equities
Developed markets participated in the May rally, although returns varied widely across countries. The S&P Developed Markets Index gained 2.3%, led by the Netherlands at 6.9%, Austria at 5.5%, and Israel at 5.3%. Japan also delivered a solid gain of 4.3%. Most European markets finished higher as investors responded to improving risk sentiment and stronger technology shares. In contrast, Hong Kong fell 2.6%, while Norway, Australia, and the U.K. posted small losses. The key takeaway is that developed market leadership shifted toward technology and export-oriented economies rather than commodity-driven markets.
Year to date, leadership remains concentrated in a handful of standout markets. Norway leads with a gain of 28.9%, followed by Israel at 25.1%, Finland at 18.8%, and the Netherlands at 17.6%. Japan has gained 15.1%, continuing its strong run. The S&P Developed Markets Index has returned 9.6%, broadly in line with many major markets. Overall, 2026 continues to favor countries with exposure to technology, industrial production, and global trade, while commodity and defensive markets have delivered more mixed results.
Click to enlarge
Emerging Market Equities
Emerging markets extended their advance in May, led once again by Asia’s technology exporters. The S&P Emerging Markets Index gained 6.3%, outperforming most developed market benchmarks. Korea surged 28.0% and Taiwan gained 14.4% as investors continued to favor semiconductor and AI supply-chain exposure. Peru also delivered a strong return of 8.1%. In contrast, several commodity and domestic-demand markets struggled. Turkey fell 10.1%, Brazil declined 9.5%, and Indonesia dropped 15.7%. The key takeaway is that technology-driven export economies continue to attract capital while commodity-sensitive markets face increasing pressure.
Year to date, leadership remains highly concentrated. Korea leads with a gain of 111.7%, while Taiwan has returned 61.8%. The S&P Emerging Markets Index has gained 24.2%, supported by strength across much of Asia and Latin America. Thailand, Peru, Poland, Mexico, and Brazil have all posted double-digit gains. However, dispersion remains extreme. Indonesia has fallen 32.0%, while India and China remain negative for the year. Overall, 2026 continues to reward markets tied to AI infrastructure, semiconductor production, and global technology demand.
Click to enlarge
Government Bonds
The key takeaway for May is that investors cautiously extended duration as inflation fears eased and bond market volatility declined. Government bonds delivered modest gains as yields stabilized after a volatile spring. The U.S. Aggregate Bond Index gained 0.29%, while long-duration Treasuries outperformed. The 20+ Year Treasury Index returned 0.54%, and the 10-20 Year Treasury Index gained 0.44%. Emerging market government bonds led all major bond sectors with a gain of 1.09%. Meanwhile, intermediate Treasury maturities remained flat to slightly negative.
Year to date, bond returns remain modest and highly dependent on duration and inflation exposure. Short-term TIPS lead with a gain of 2.02%, followed by emerging market government bonds at 1.92% and long-term TIPS at 1.69%. Cash and short-duration bonds continue to outperform most Treasury benchmarks. The U.S. Aggregate Bond Index returned 0.50%, while intermediate- and long-duration Treasuries remain slightly negative.
Click to enlarge
Corporate & Infrastructure Bonds
Corporate credit outperformed most bond sectors in May. Convertible Bonds gained 7.2% as strong equity markets boosted equity-linked securities. Most investment-grade and high-yield sectors posted modest gains between 0.4% and 1.5%. In contrast, infrastructure assets declined about 2.7%, while REITs were little changed. The key takeaway is that investors favored credit and equity participation over real assets.
Year to date, Convertible Bonds lead with a gain of 23.1%, followed by U.S. Infrastructure at 16.3% and U.S. Multisector REITs at 14.1%. Traditional corporate bonds have produced positive but modest returns, with the iBoxx Corporate Bond Index up 1.6%. Overall, equity-sensitive income sectors continue to outperform traditional fixed income.
Click to enlarge
Commodities
May returns saw commodities reverse course as energy markets corrected. The S&P GSCI Index fell 7.5%, led lower by WTI crude oil (-16.9%), RBOB gasoline (-16.3%), and heating oil (-14.5%). In contrast, natural gas surged 18.8%, while copper (+6.9%) and aluminum (+6.4%) benefited from continued industrial demand. The key takeaway is that energy weakness overwhelmed strength in industrial metals and agriculture.
Despite the May setback, commodities remain one of the strongest asset classes in 2026. The S&P GSCI Index has gained 37.9%, led by gasoline (+76.2%), heating oil (+64.6%), WTI crude oil (+52.1%), and soybean oil (+53.9%). Industrial metals and several agricultural markets also remain firmly positive. However, performance varies widely beneath the surface. Cocoa has fallen 35.3%, coffee is down 23.8%, and palladium has lost 17.6%. Overall, 2026 remains an energy-led commodity bull market despite May’s correction.
Click to enlarge
Currencies
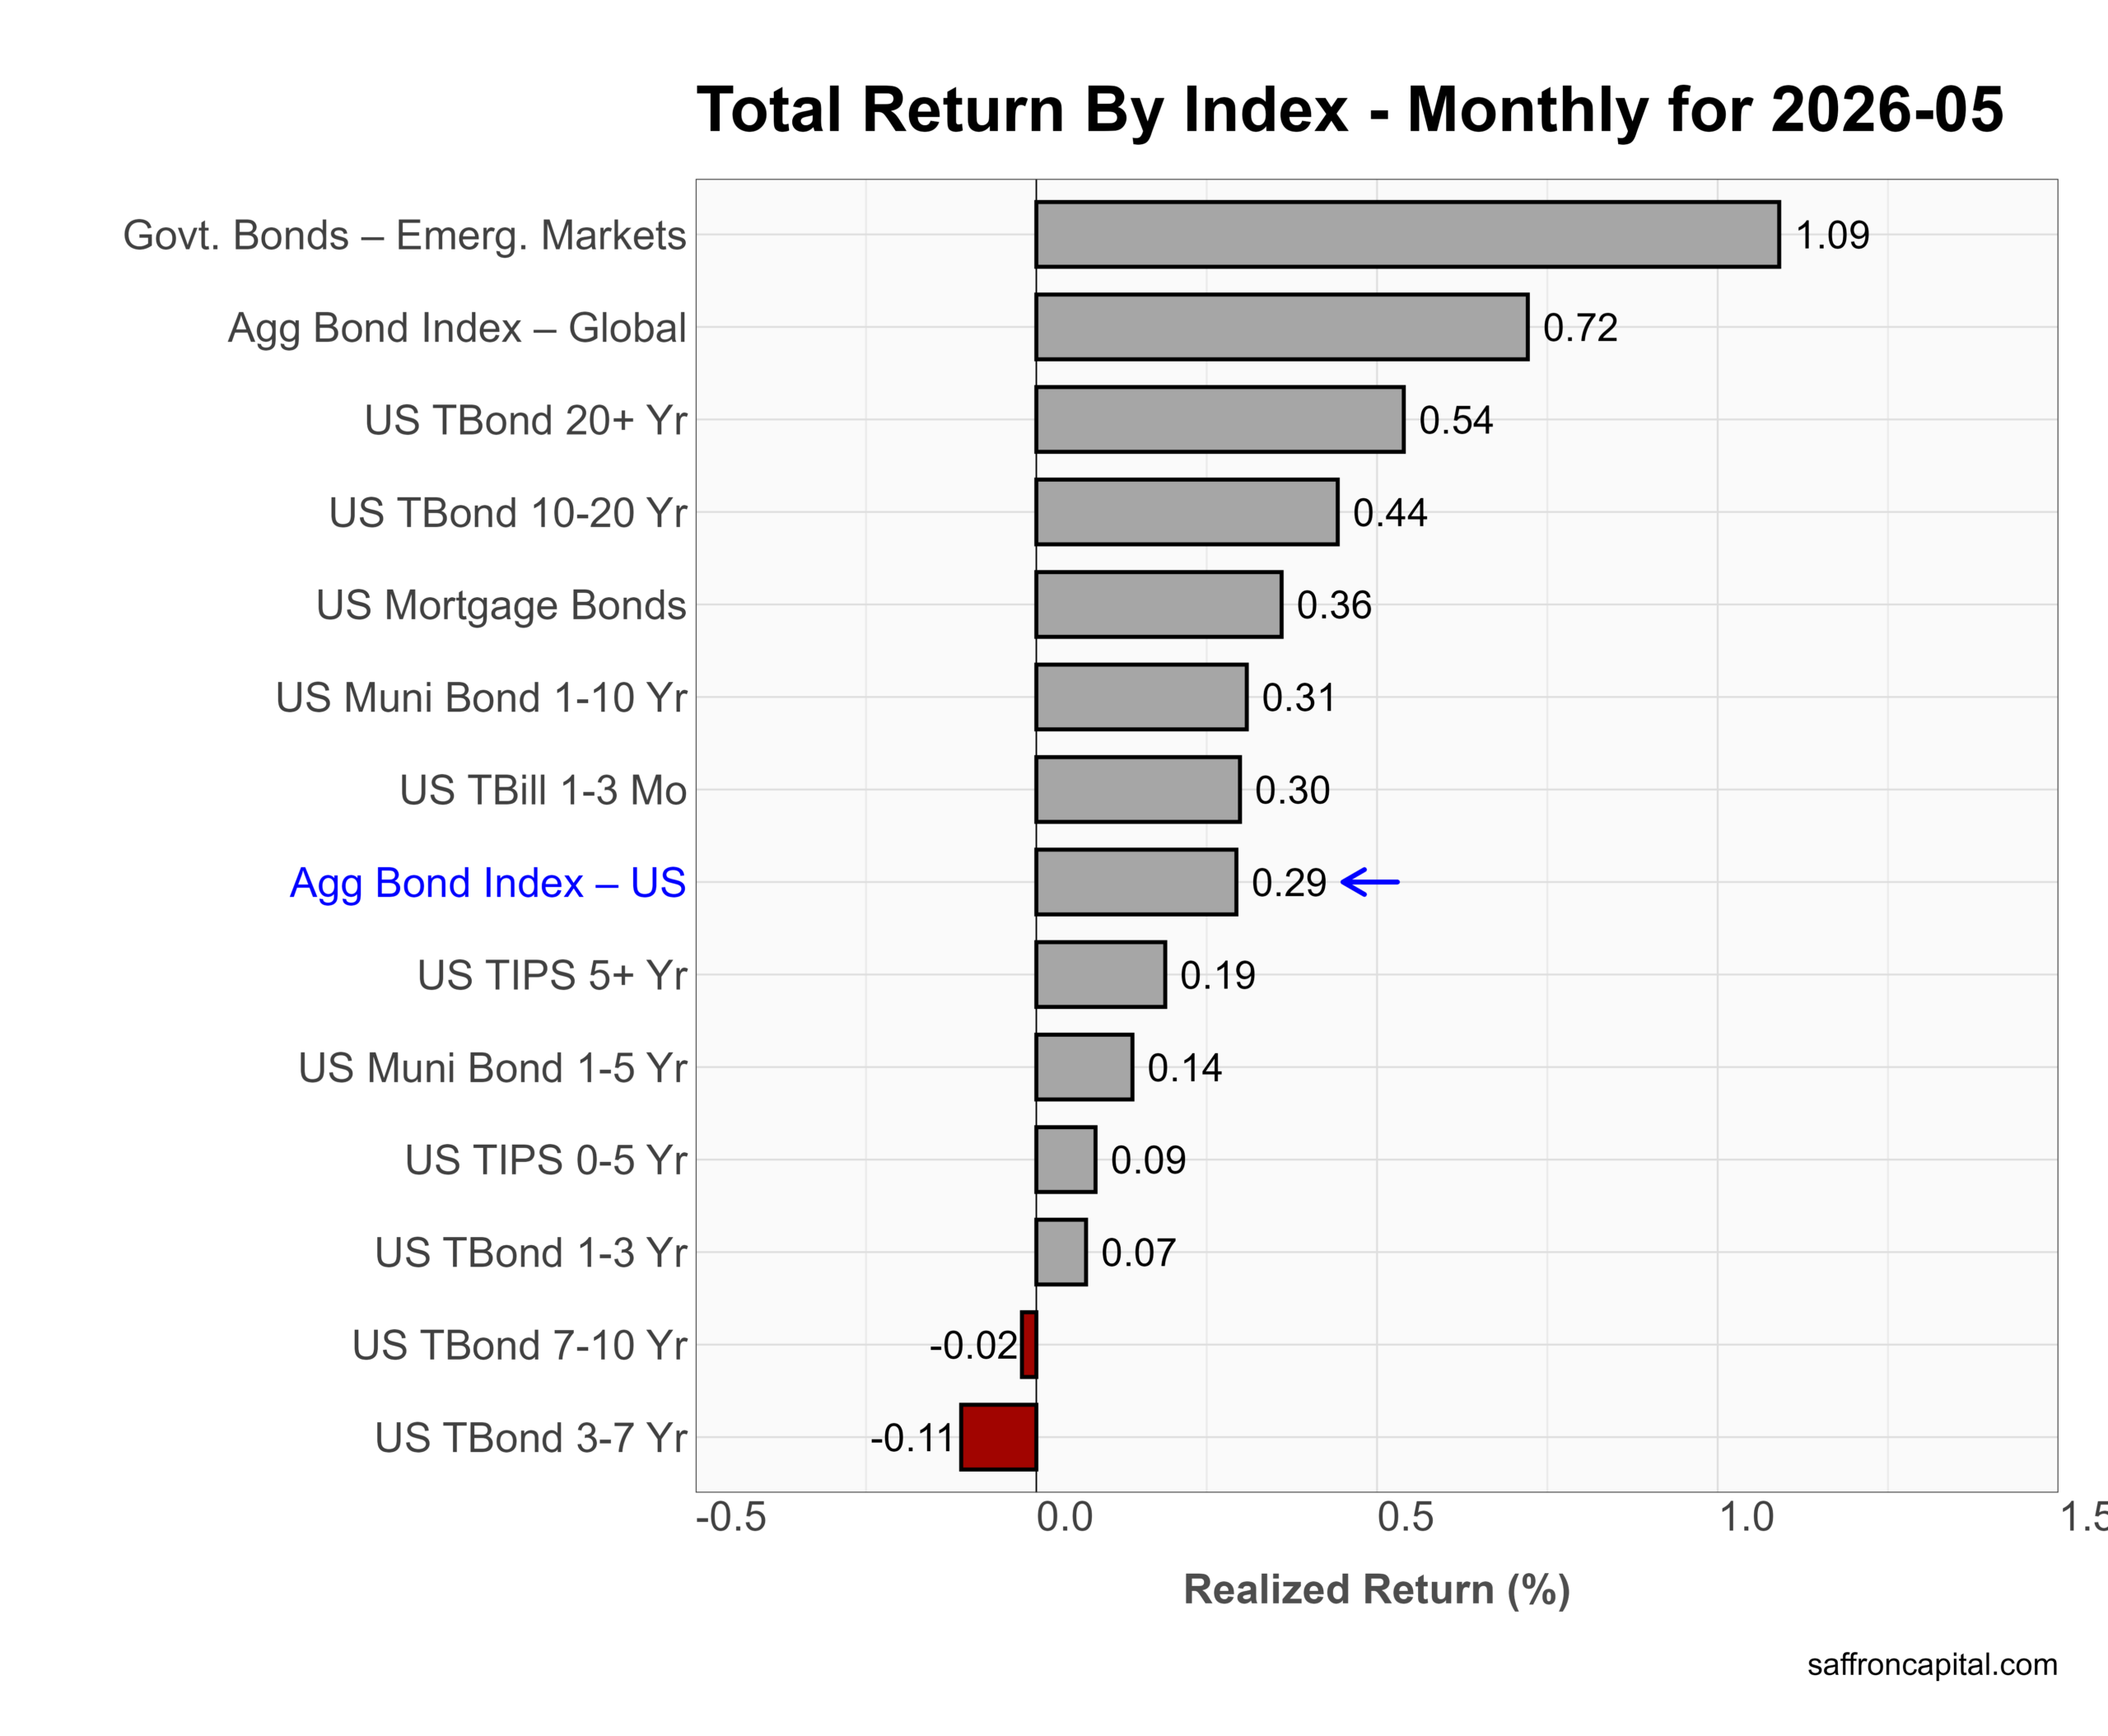
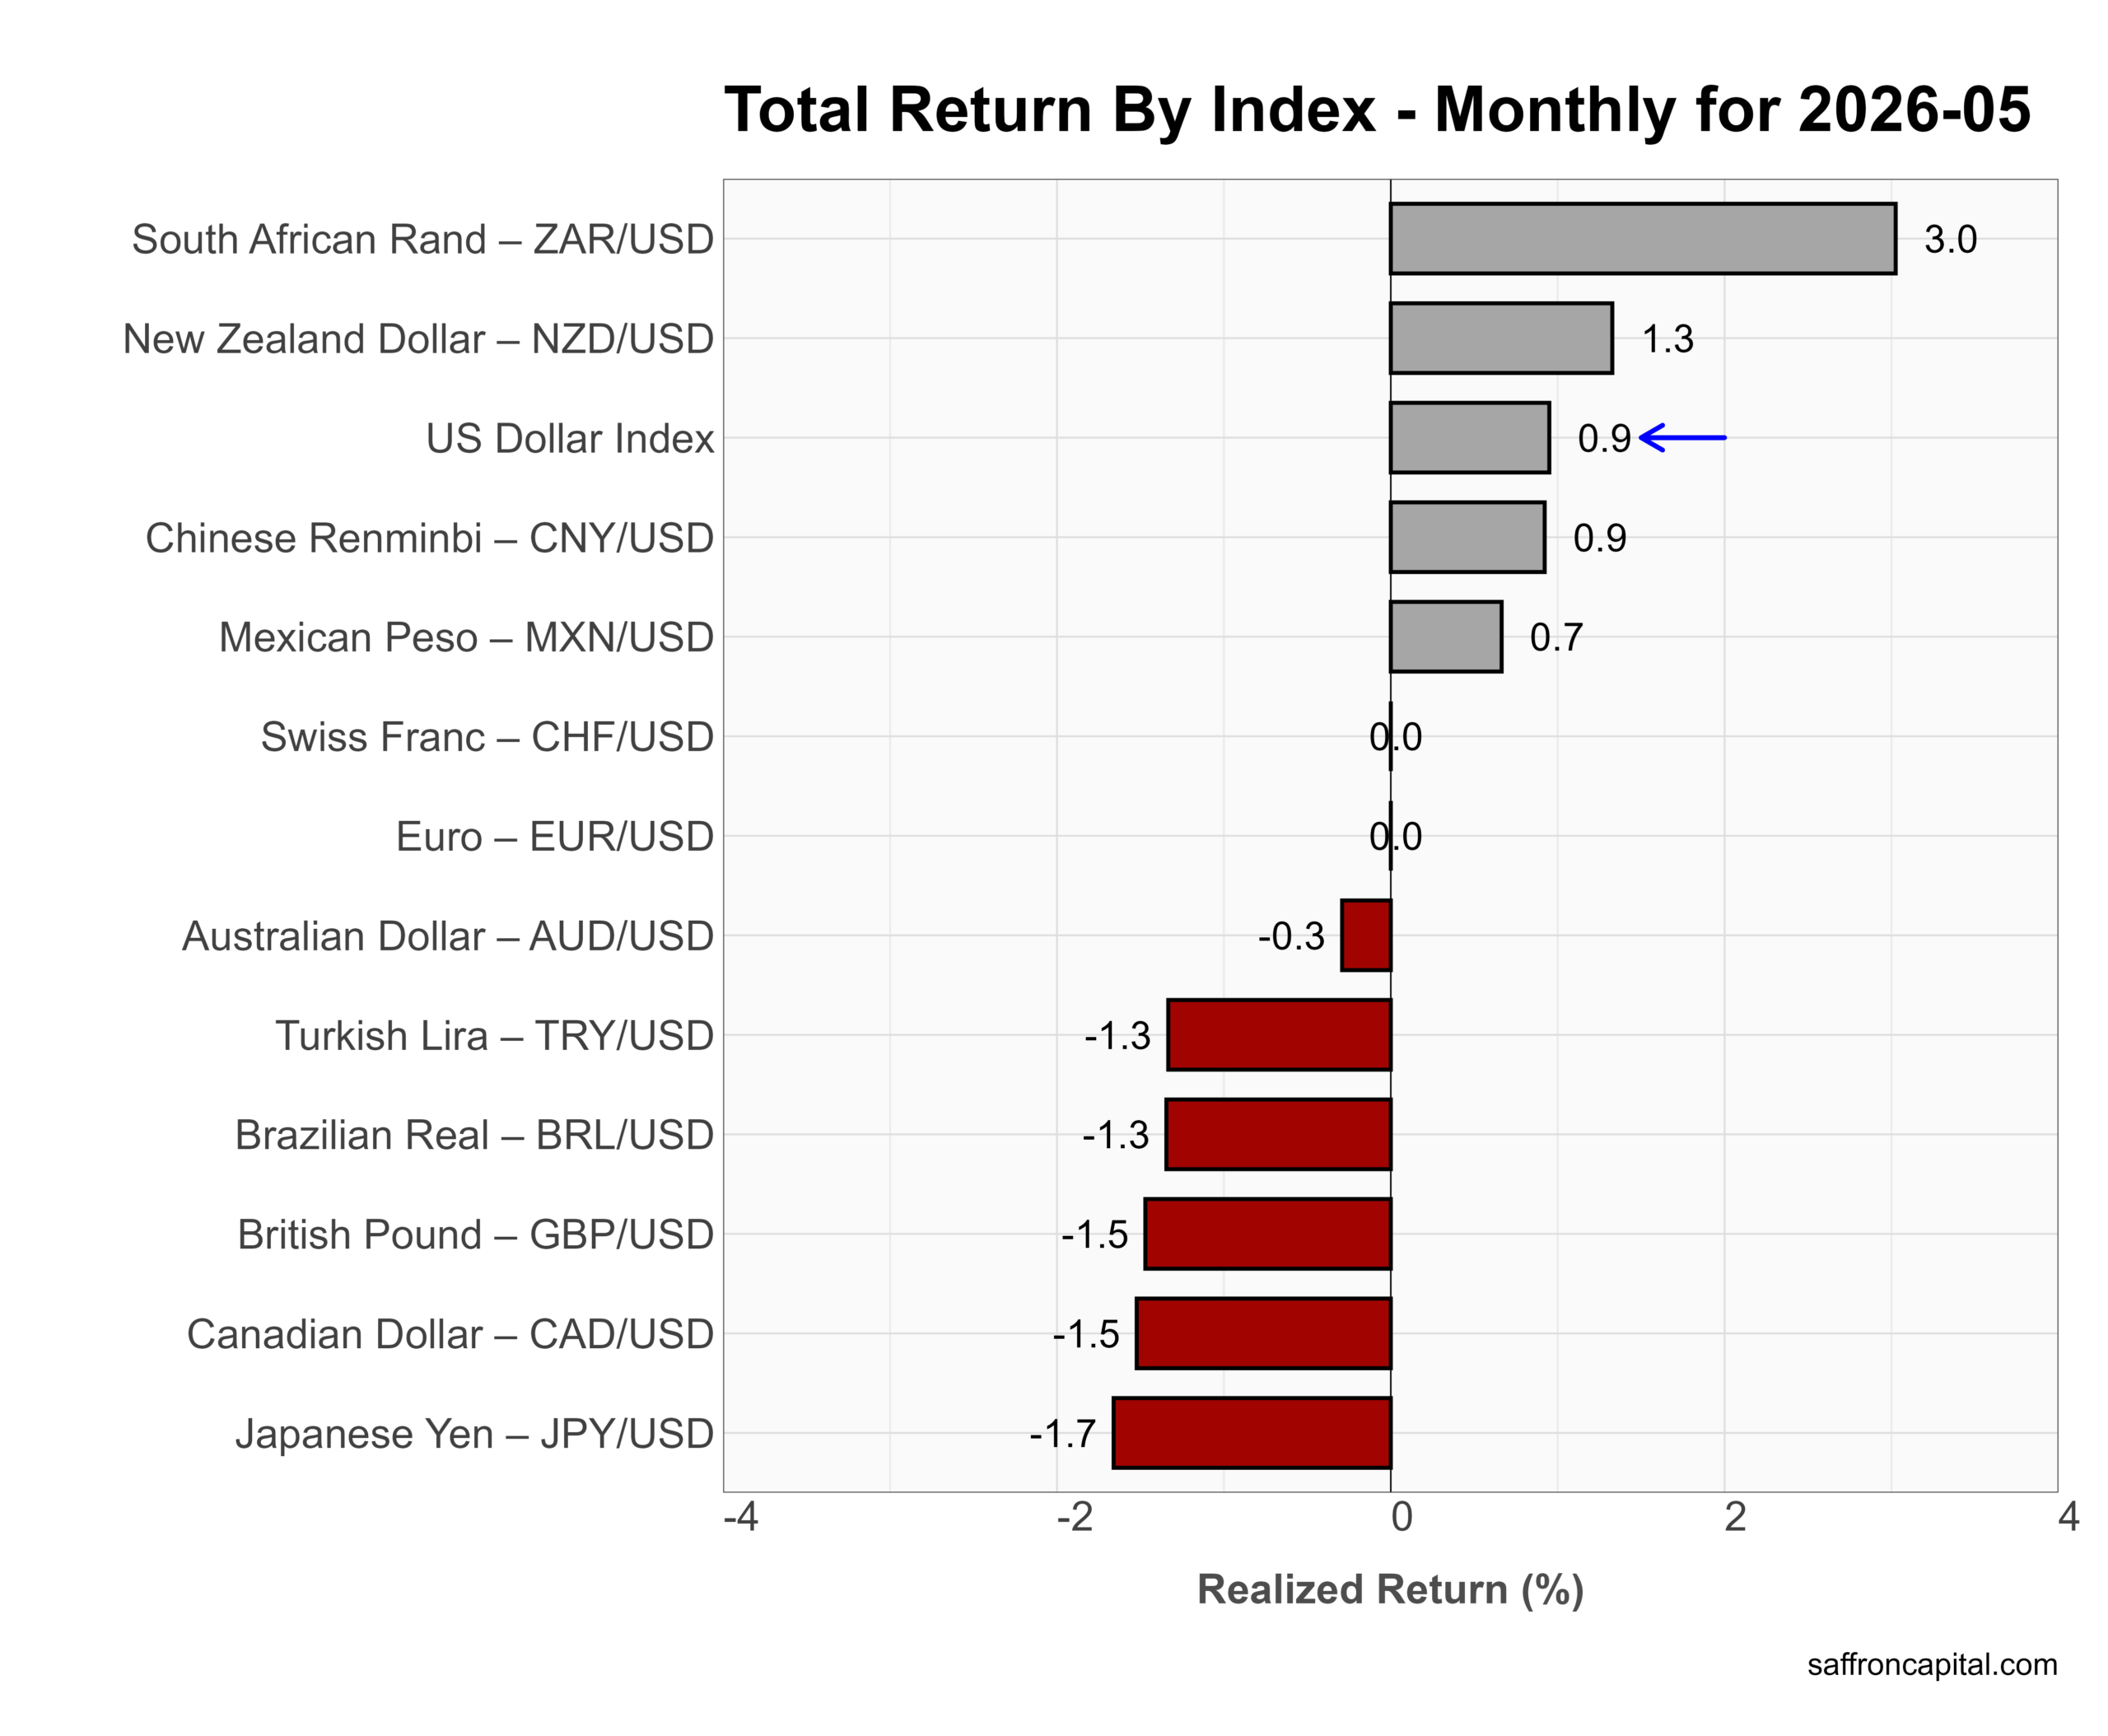
May produced a mixed currency market. The U.S. Dollar Index gained 0.9%, reversing part of the prior weakness. The South African rand led with a 3.0% gain, while the New Zealand dollar rose 1.3%. The renminbi and peso also advanced. In contrast, the yen fell 1.7%, while the pound, Canadian dollar, and Brazilian real lost more than 1%. The main takeaway is that dollar strength returned, but currency leadership remained fragmented rather than risk-off.
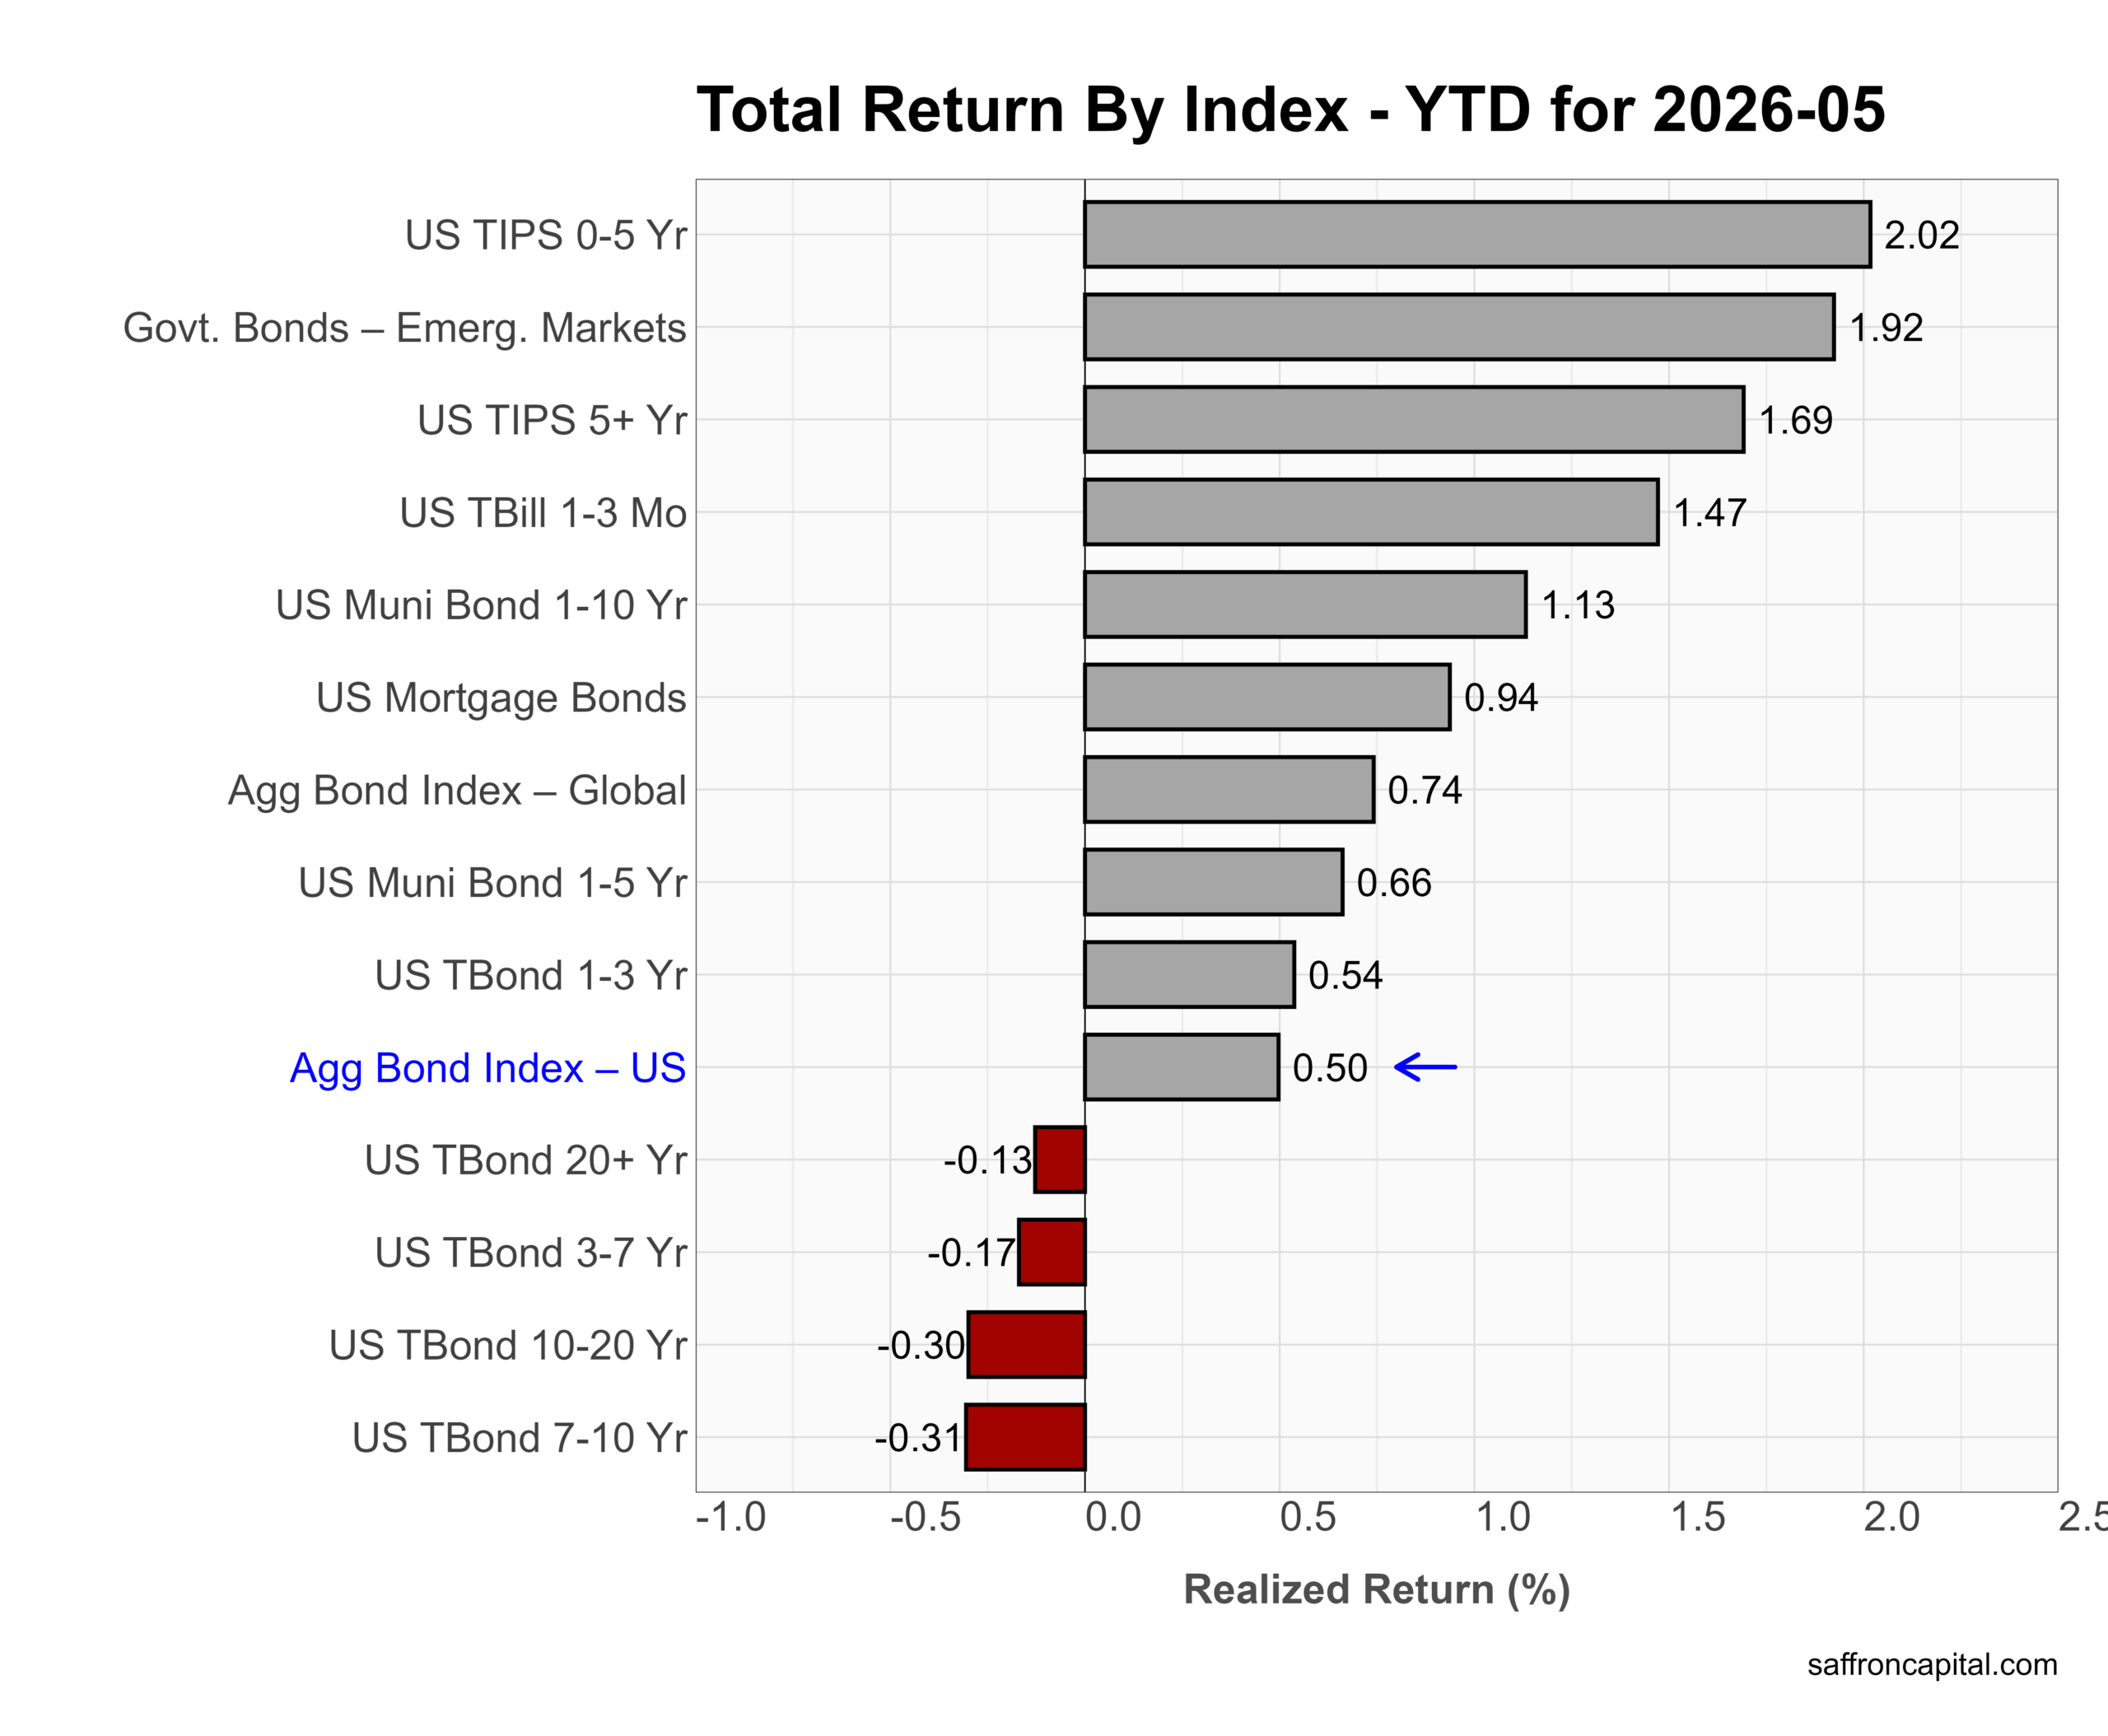
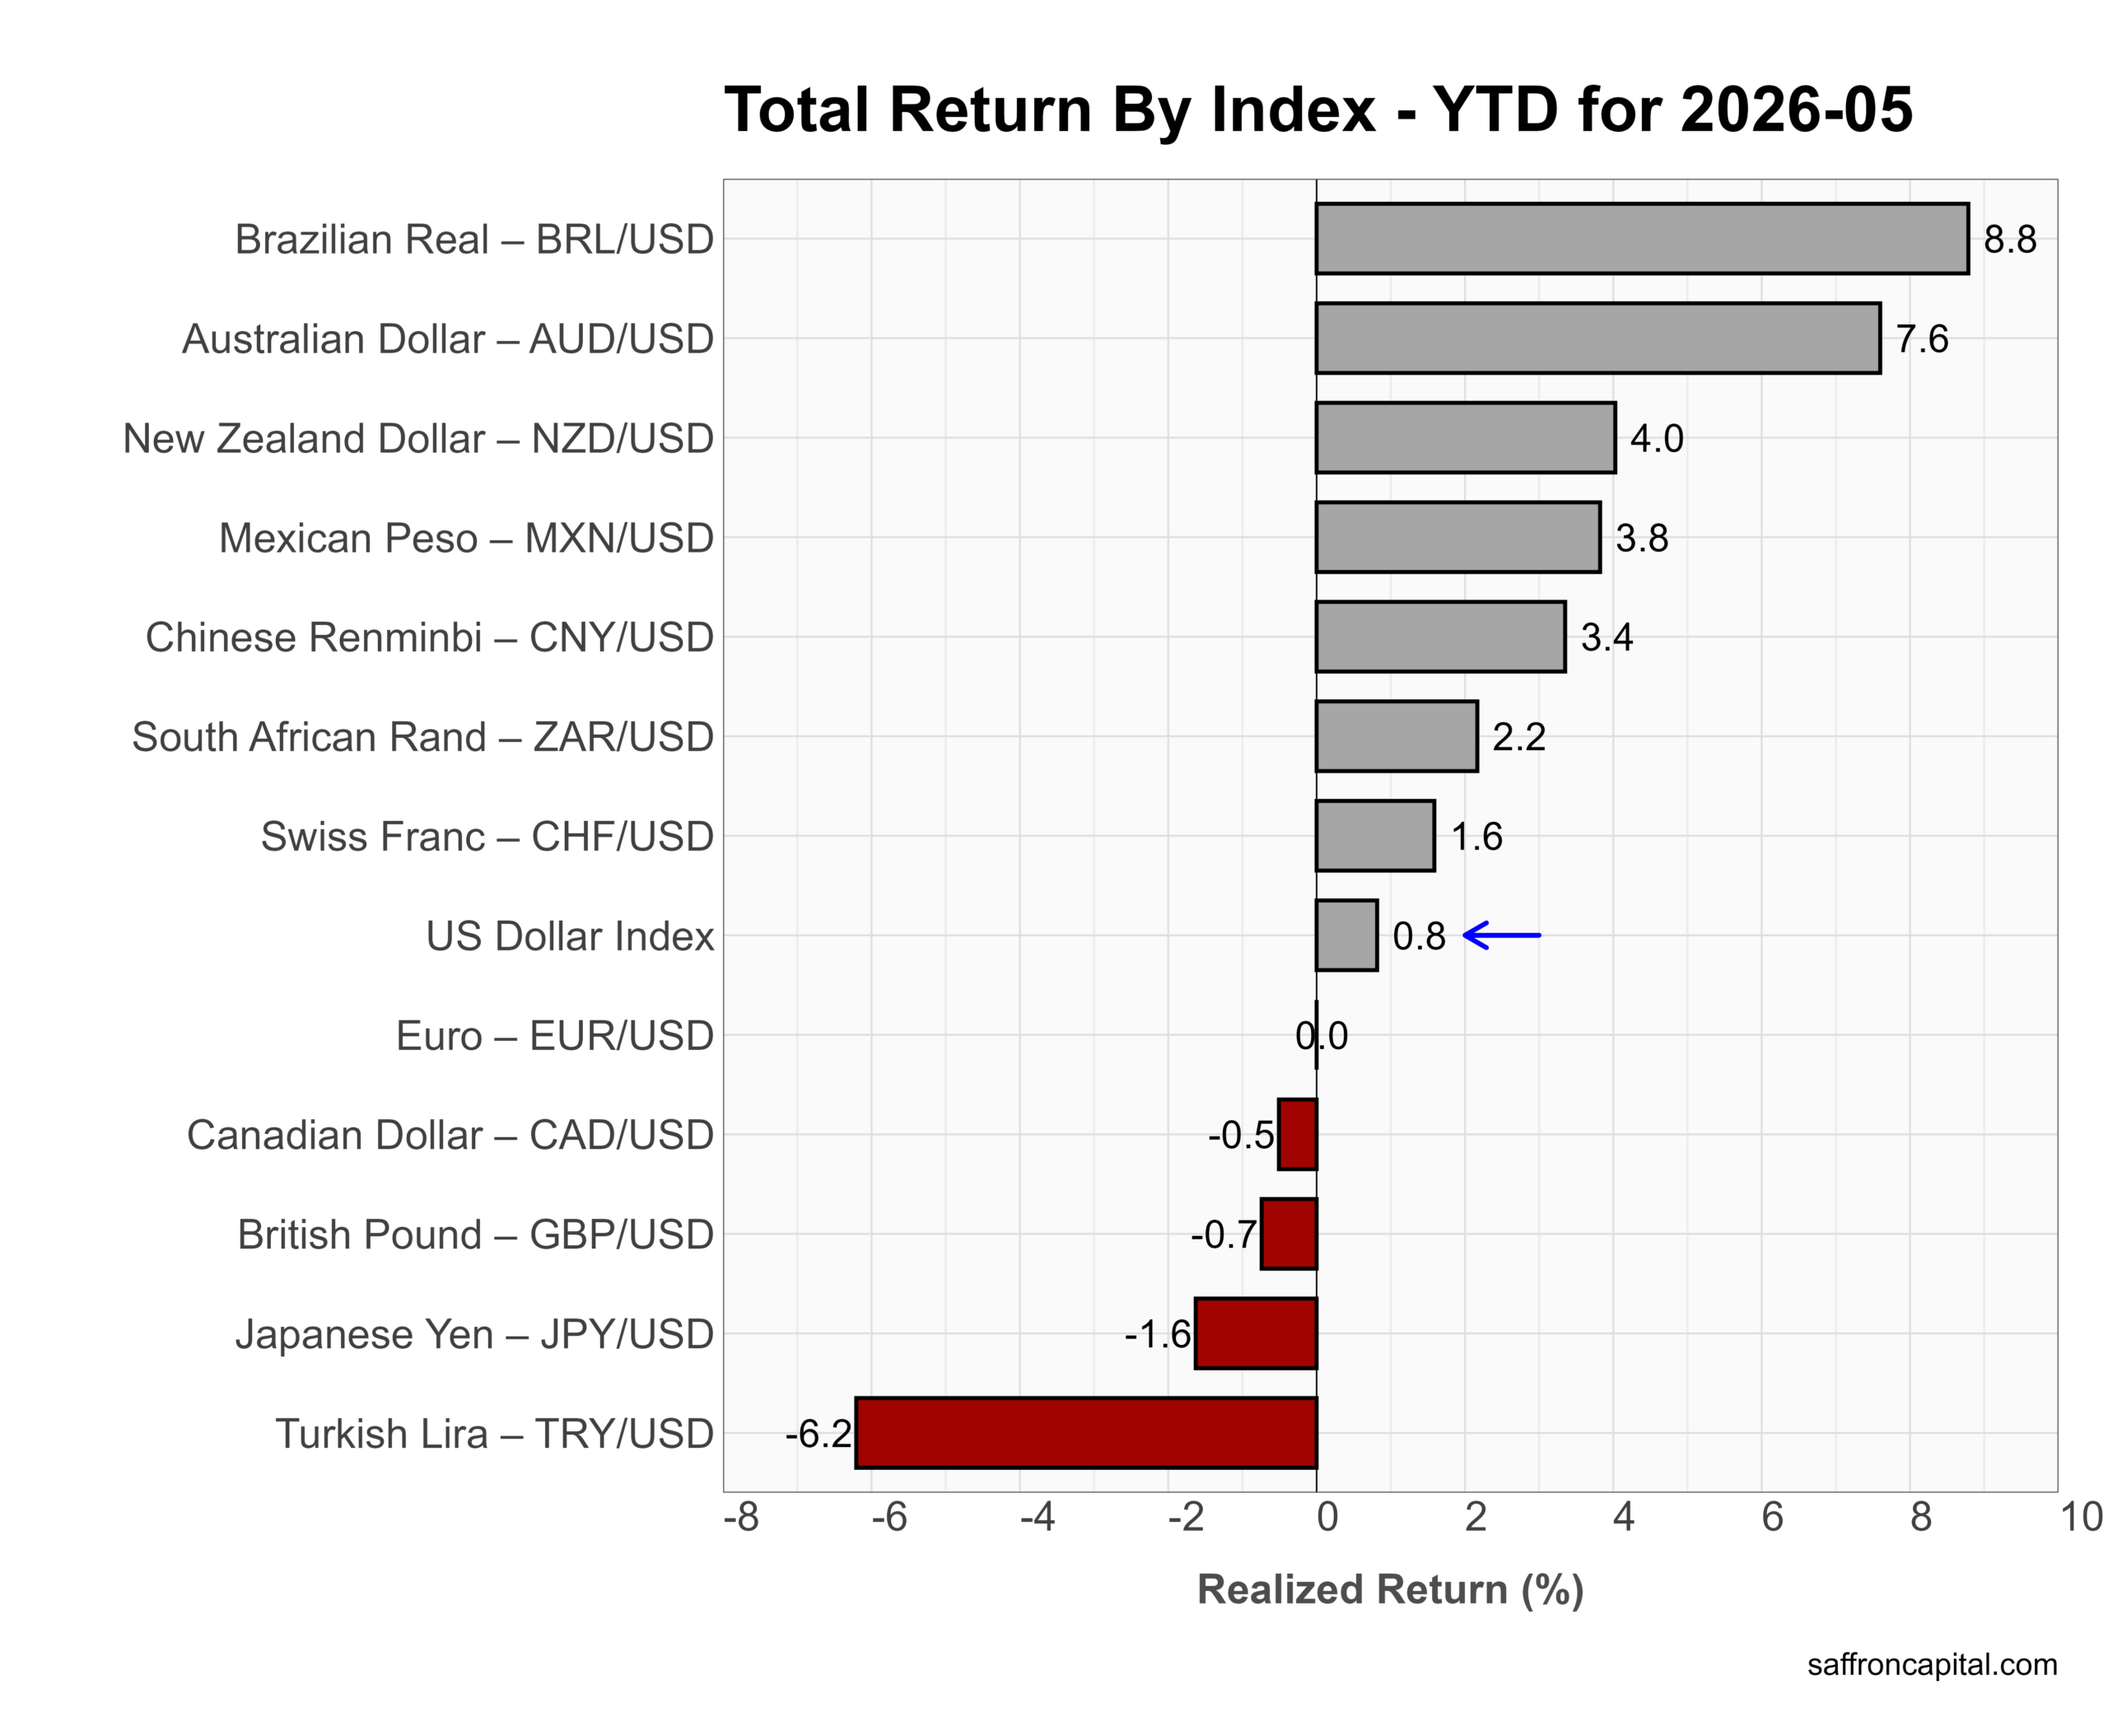
Year to date, commodity and export-oriented currencies still lead. The Brazilian real tops the rankings with an 8.8% gain, followed by the Australian dollar at 7.6%. The New Zealand dollar, peso, and renminbi also show solid advances. Meanwhile, the Dollar Index remains near unchanged at 0.8%, while the yen and pound continue to lag. The Turkish lira remains the weakest major currency at -6.2%. Overall, 2026 still favors commodity-linked currencies, although May suggests the dollar may be stabilizing after its earlier decline.
Cryptocurrencies
crypto failed to participate in the broader risk-on rally seen across equities and technology stocks. May returns were weak as Bitcoin fell 3.9%, while Ethereum dropped 10.9% (the worst performance among major tokens). Cardano, Avalanche, and XRP also lost between 3% and 5%. Tether remained stable near flat.
Year to date, the drawdown remains severe. Bitcoin is down 16.2%, while Ethereum has fallen 32.2%. Solana (-34.2%), Cardano (-30.1%), Avalanche (-28.3%), and XRP (-27.7%) continue to post large losses. Tether remains unchanged. In short, crypto remains one of the weakest major asset classes in 2026, with speculative tokens under the greatest pressure.
Click to enlarge
Risk-Adjusted Royalty
Returns alone do not tell the full story. The Sharpe ratio measures how much return investors earned for each unit of risk taken.
May’s rankings show clear leadership from technology, innovation, and growth. Tech Breakthroughs led with a Sharpe ratio of 15.5, followed by S&P 500 Technology at 15.2. The US Value Factor (12.1), NASDAQ-100 (12.0), and S&P 500 Growth Index (10.3) also ranked near the top. Robotics/AI, Semiconductors, and Renewable Energy continued to post strong risk-adjusted returns.
The key takeaway is that investors did not simply chase risk. Technology and AI themes generated both strong returns and efficient risk-adjusted performance. Value, Momentum, Quality, and Convertible Bonds also ranked among the leaders, which points to healthy market breadth beneath the technology rally. In short, May rewarded growth and innovation, but disciplined factor exposures also delivered attractive risk-adjusted results.
An invitation
Have questions or concerns about the performance of your portfolio? Could you benefit from a capital preservation strategy or a custom portfolio formulation that better aligns to your return goals and risk appetite? Whatever your needs, we are here to listen and to help. Contact us here.
Saffron Capital LLC is a registered investment advisor that provides guided growth and risk-managed portfolios. The company is employee-owned and Minnesota-based.
Related posts


