August Returns and Asset Performance
September 2, 2022
October Returns and Asset Performance
November 2, 2022Major Asset Classes
September 2022
Performance Comparison
Introduction
September returns across the major asset classes were negative. For example, the S&P 500 index achieved a new low for the year and three consecutive quarterly losses. Returns in developed and emerging stock markets were also negative. Both sectors fared even worse than US equities. Meanwhile, bonds rallied early in September. US government and corporate high yield bonds outperformed US equities with only modest losses. Finally, the US Dollar continued to rise to a new high for the year, negatively impacting many commodities.
The following analysis provides a visual record of September returns across and within the major asset classes. The brief report is intended to help investor’s to benchmark their portfolio performance.
US Equities
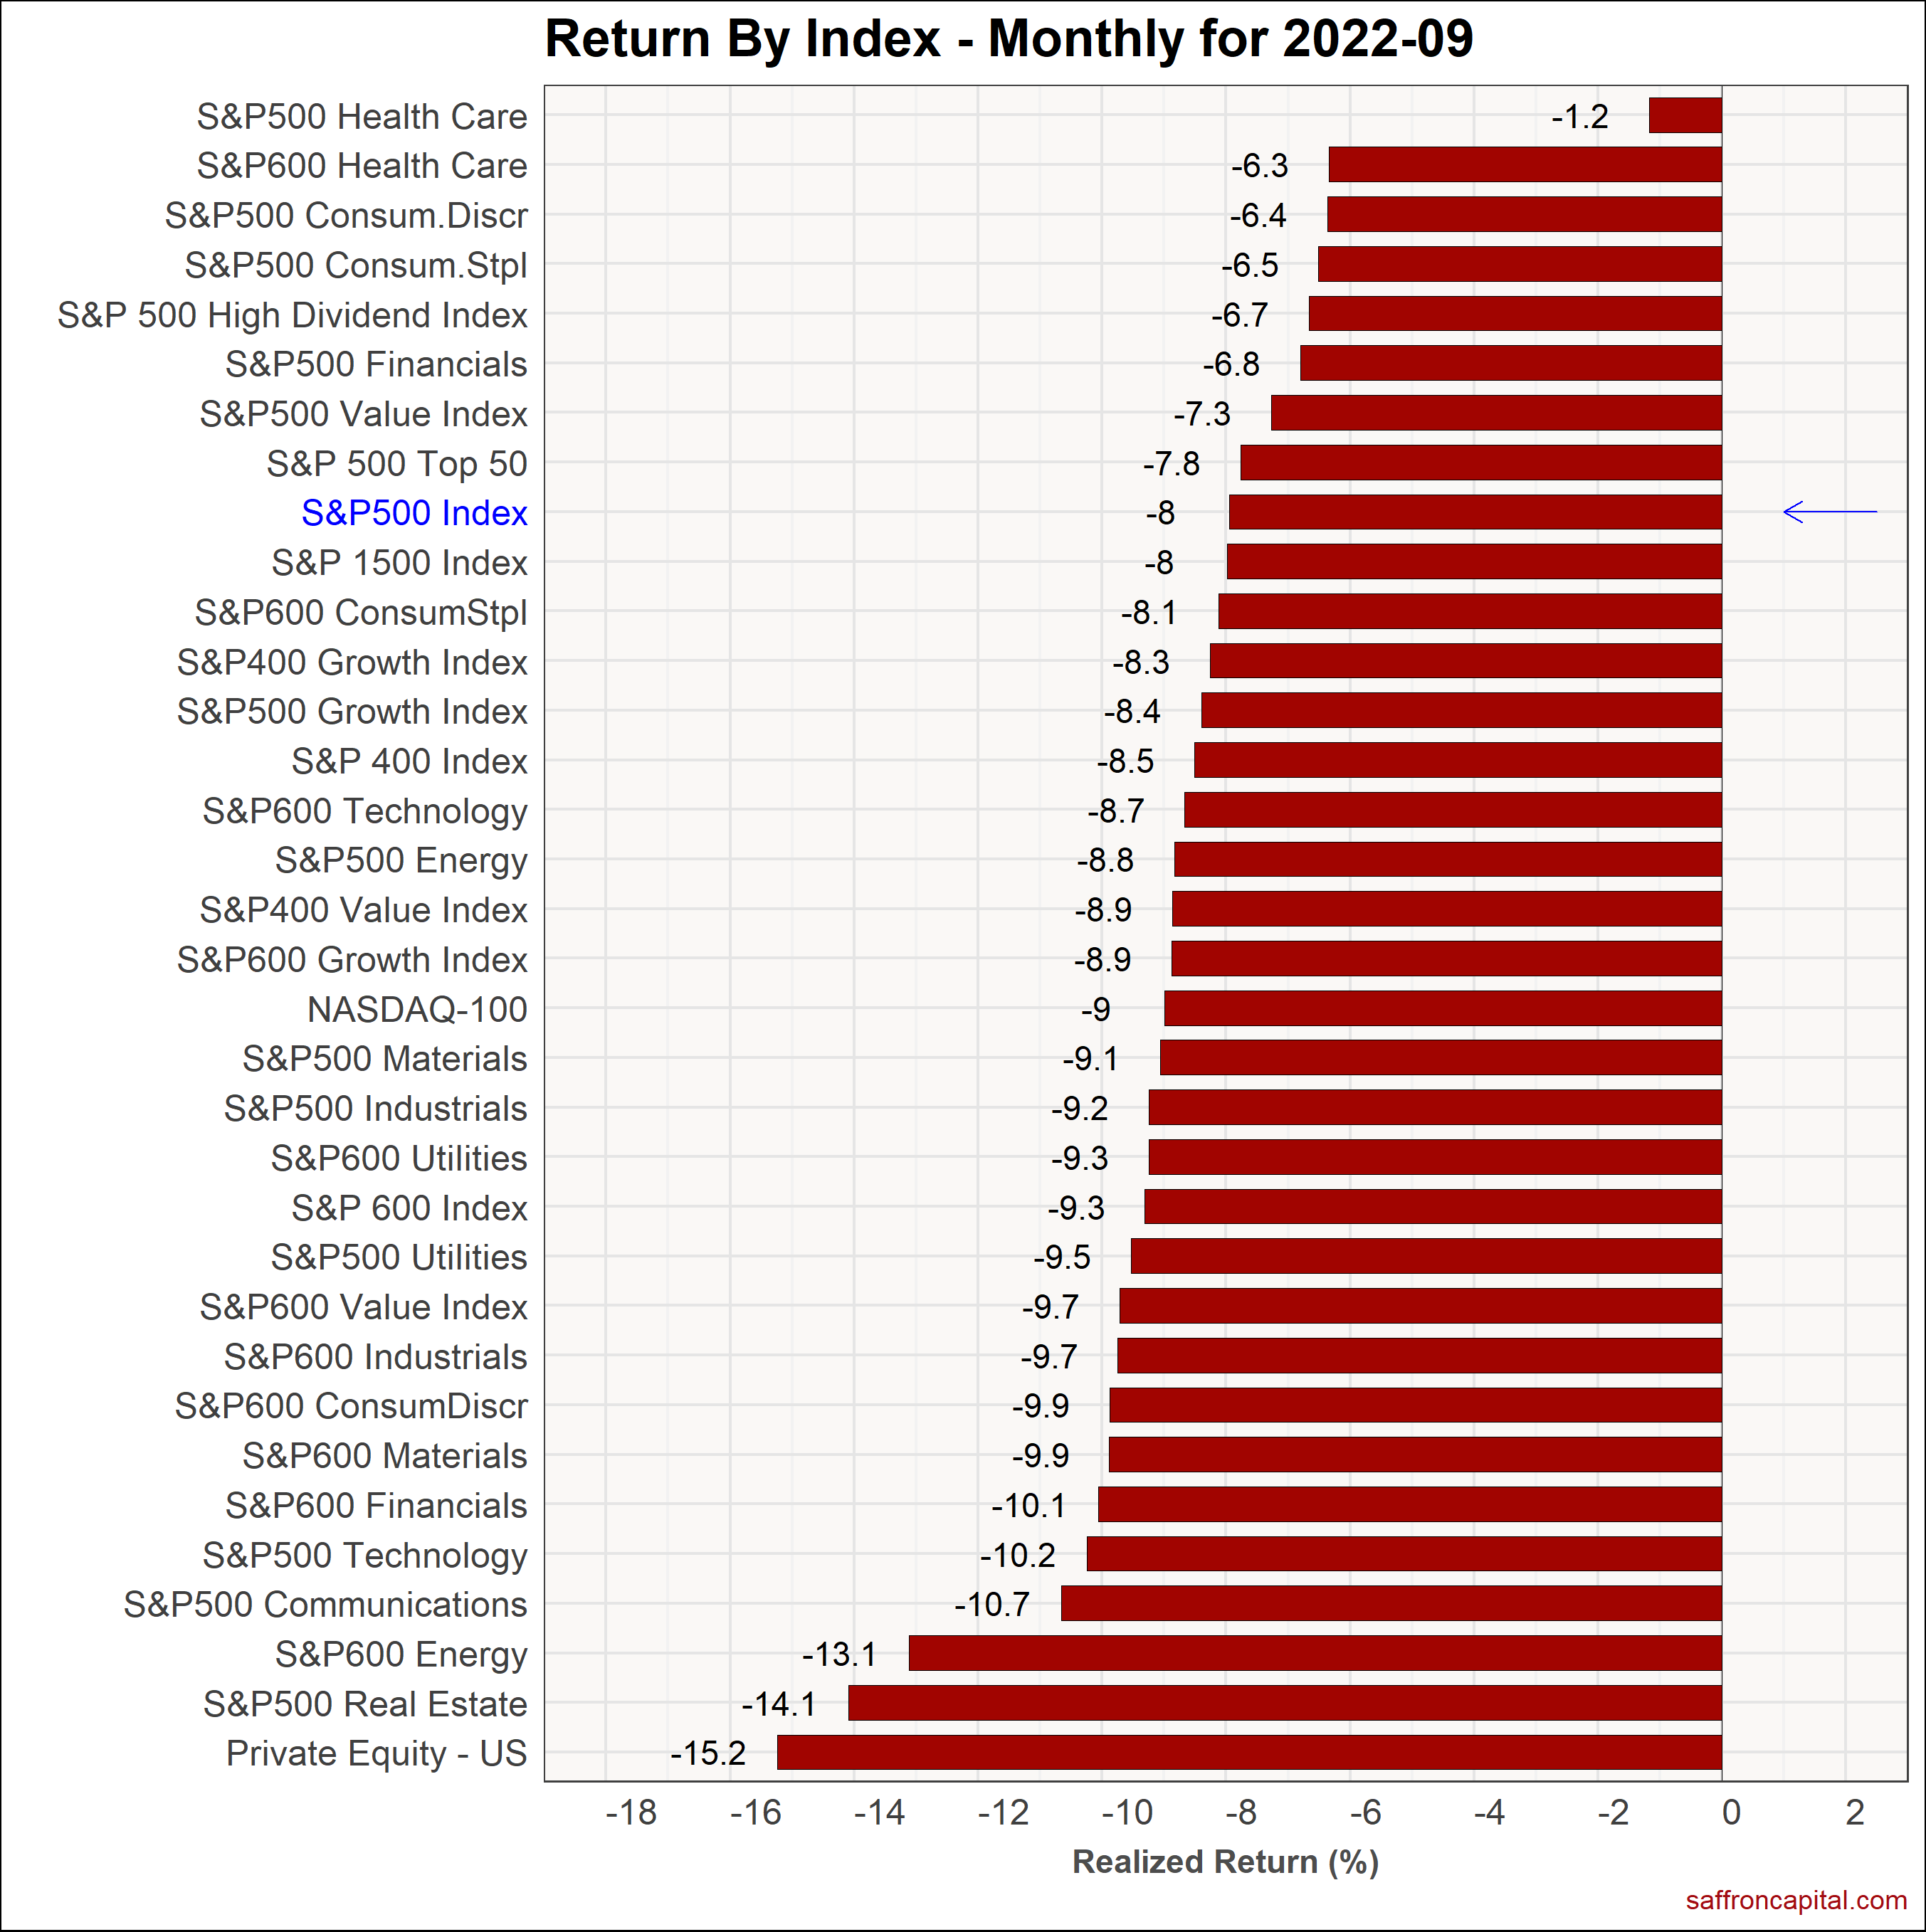
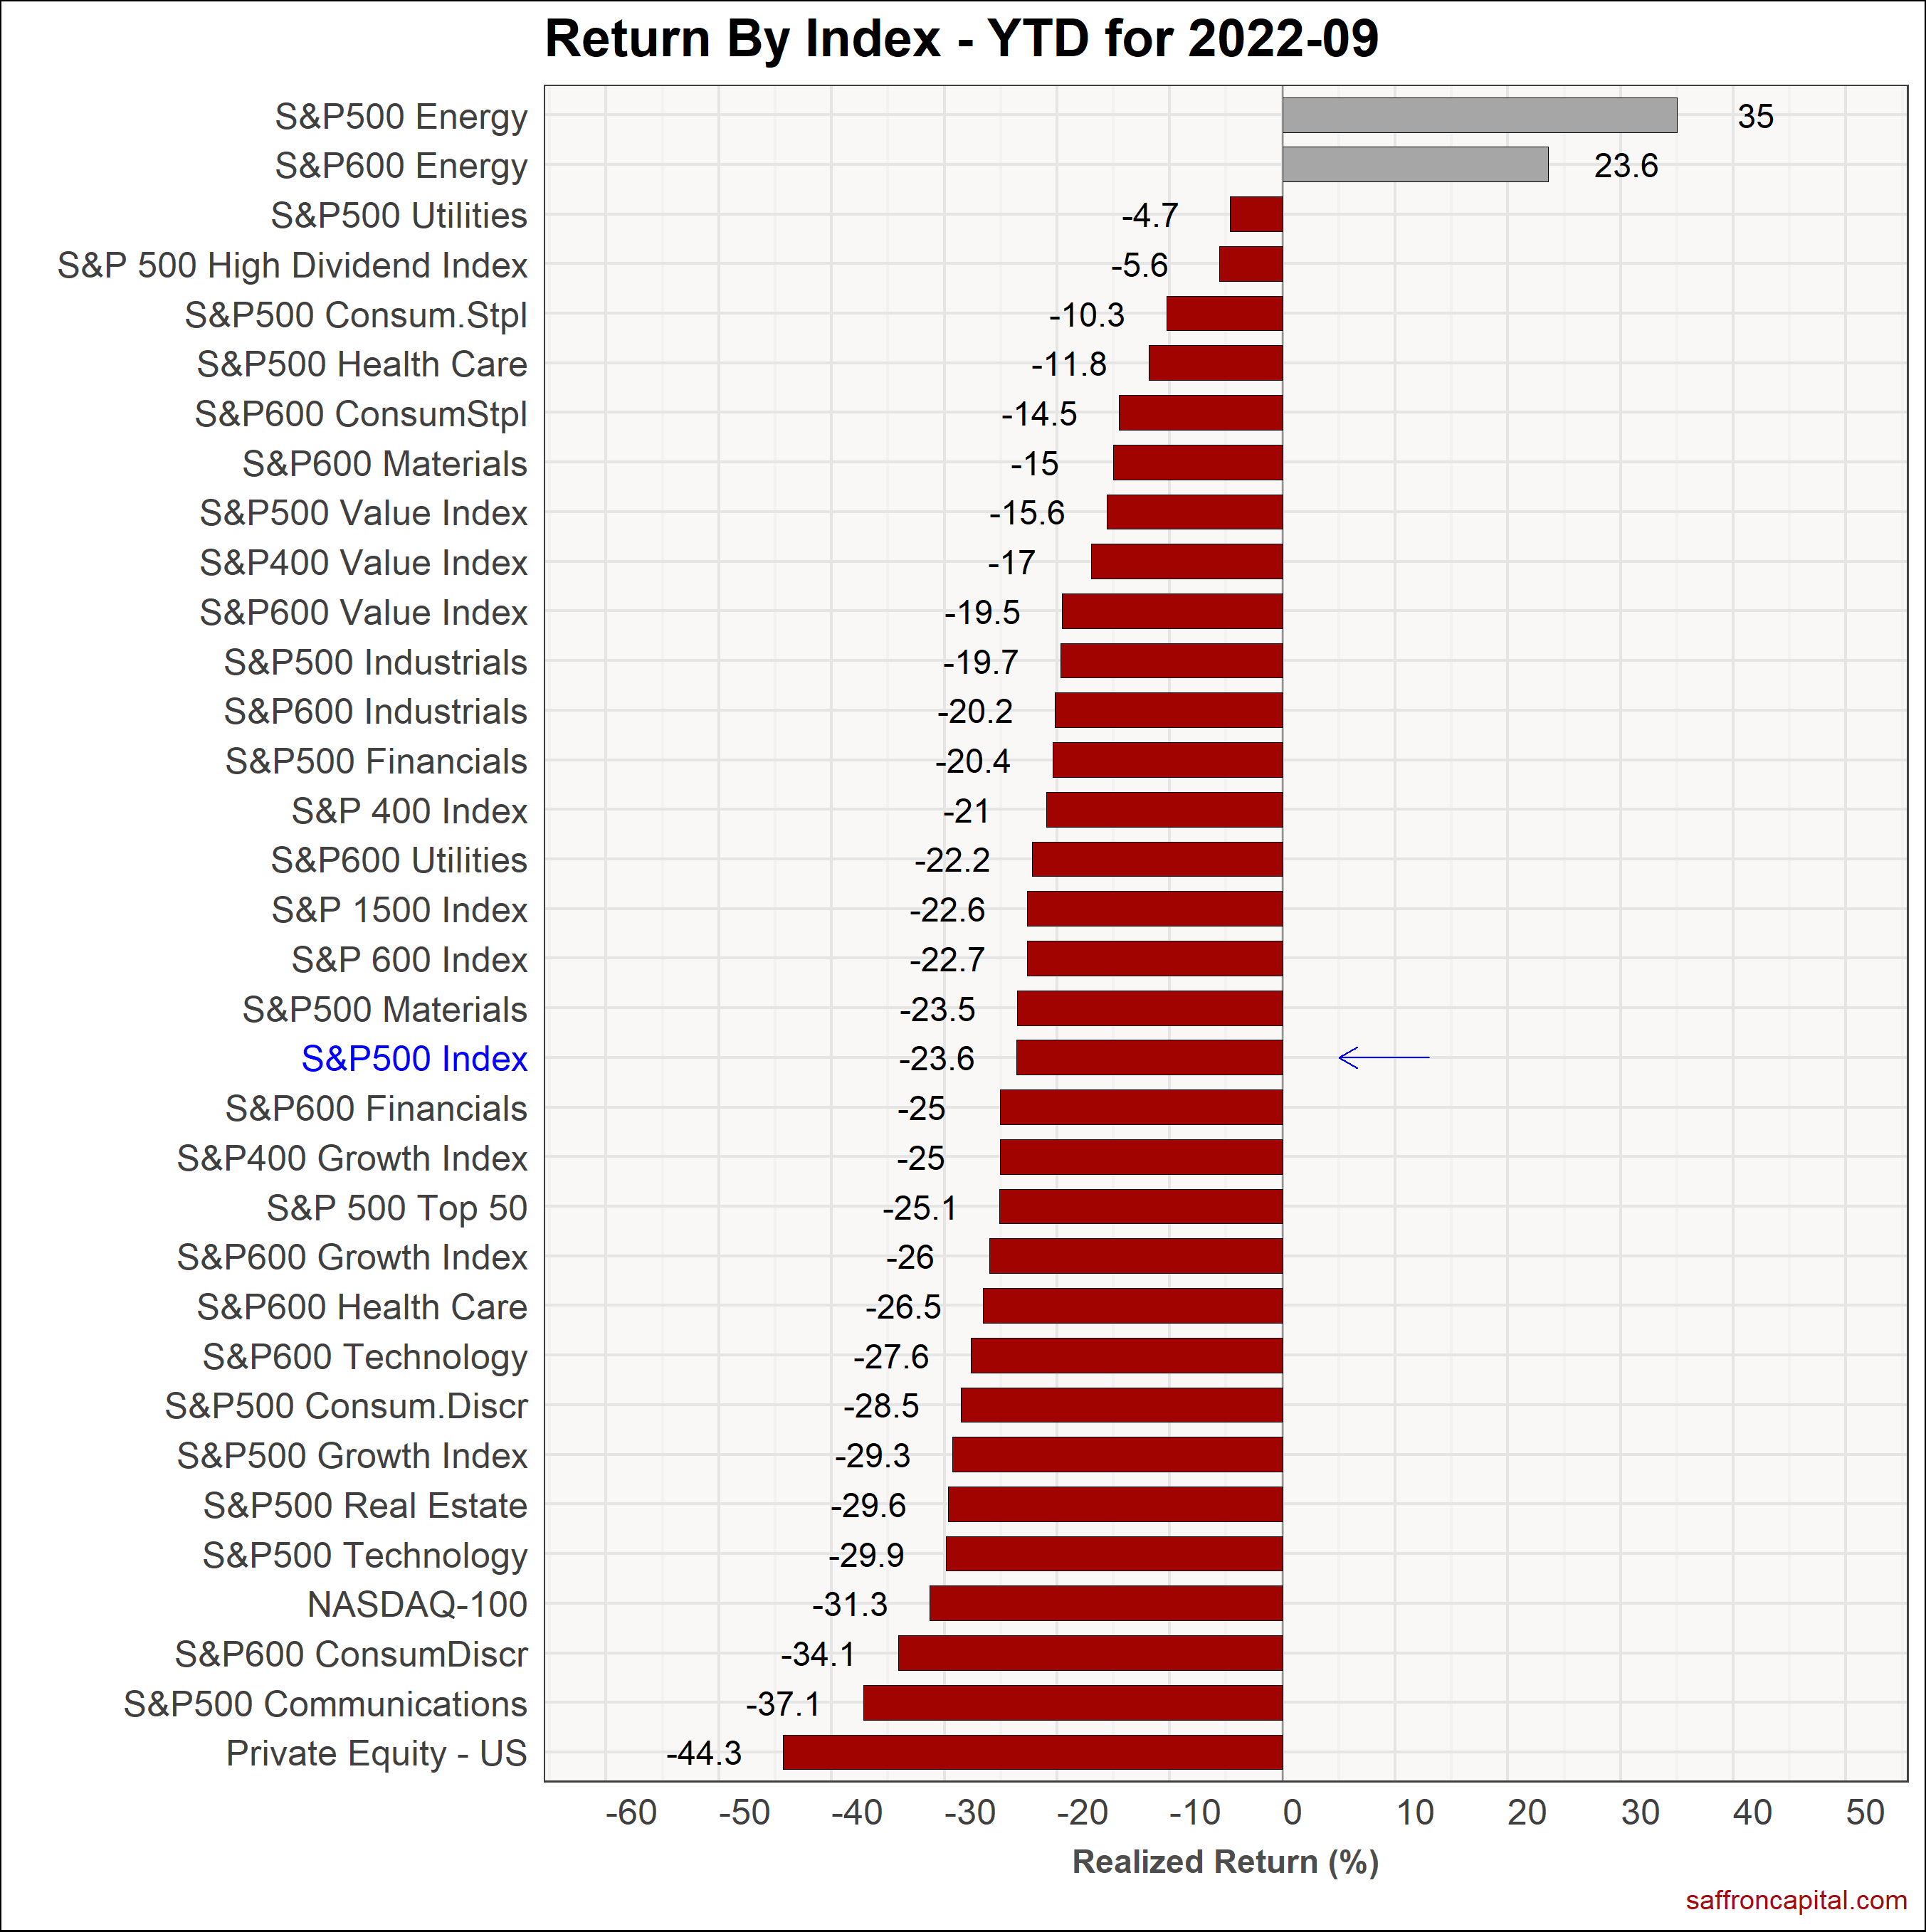
September returns for the large cap S&P 500 index (-8.0%) ranked among the worse since September 2008. Equities were pulled down by several sectors, notably real estate (-14.1%), communications (-10.7%) and technology (-10.2.%) shares. Not surprisingly, growth (–8.4%) trailed value (-7.3-%) stocks. Top performers for the month were large cap Healthcare (-1.2%), small cap Healthcare (-6.3%) and large cap Consumer Discretionary (-6.4%) shares. The S&P 500 High Dividend index (-6.7%) also outperformed the broader index. On a year-to-date (YTD) basis, the benchmark S&P 500 index (-23.6%) continued to experience drawdowns. Weakness is most evident in private equity (-44.3%), communications (-28.6%), technology (-27.6%), and real estate (-29.6%) sectors. The top performers since January are large cap energy (+35.0%), small cap Energy (+23.6%), large cap Utilities (-4.7), and high dividend stocks (-5.6%).
Developed Market Equities
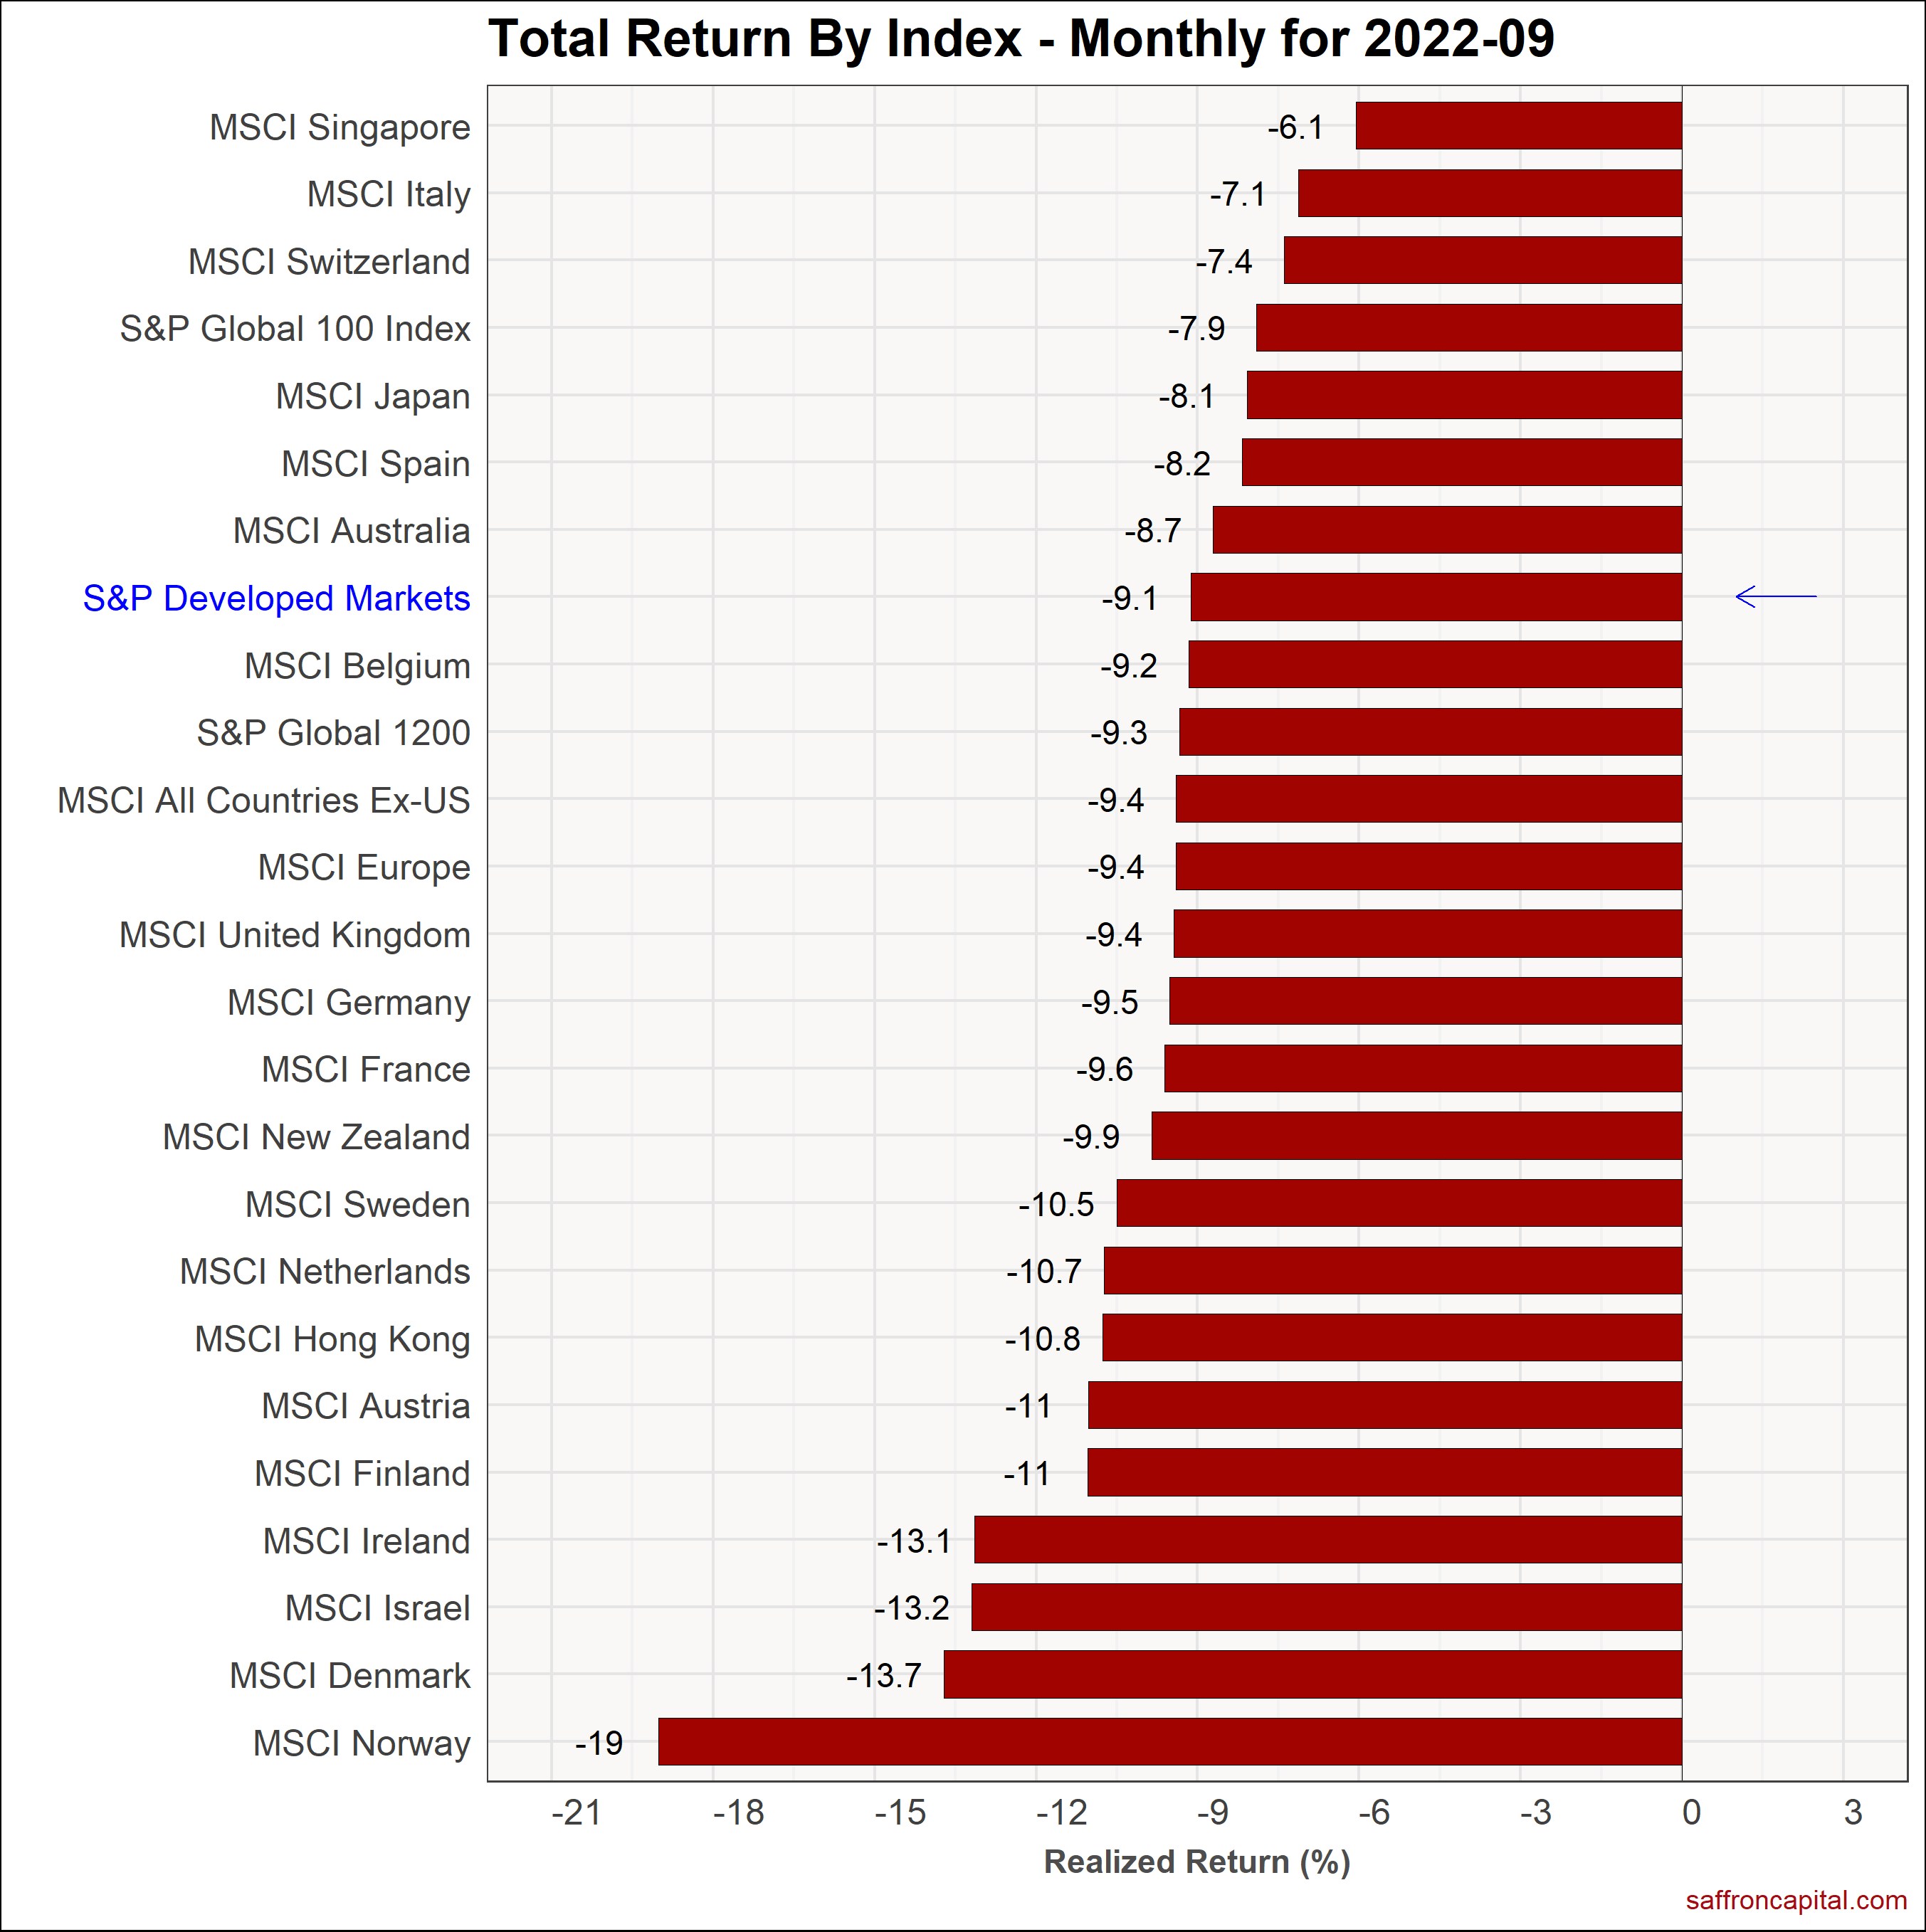
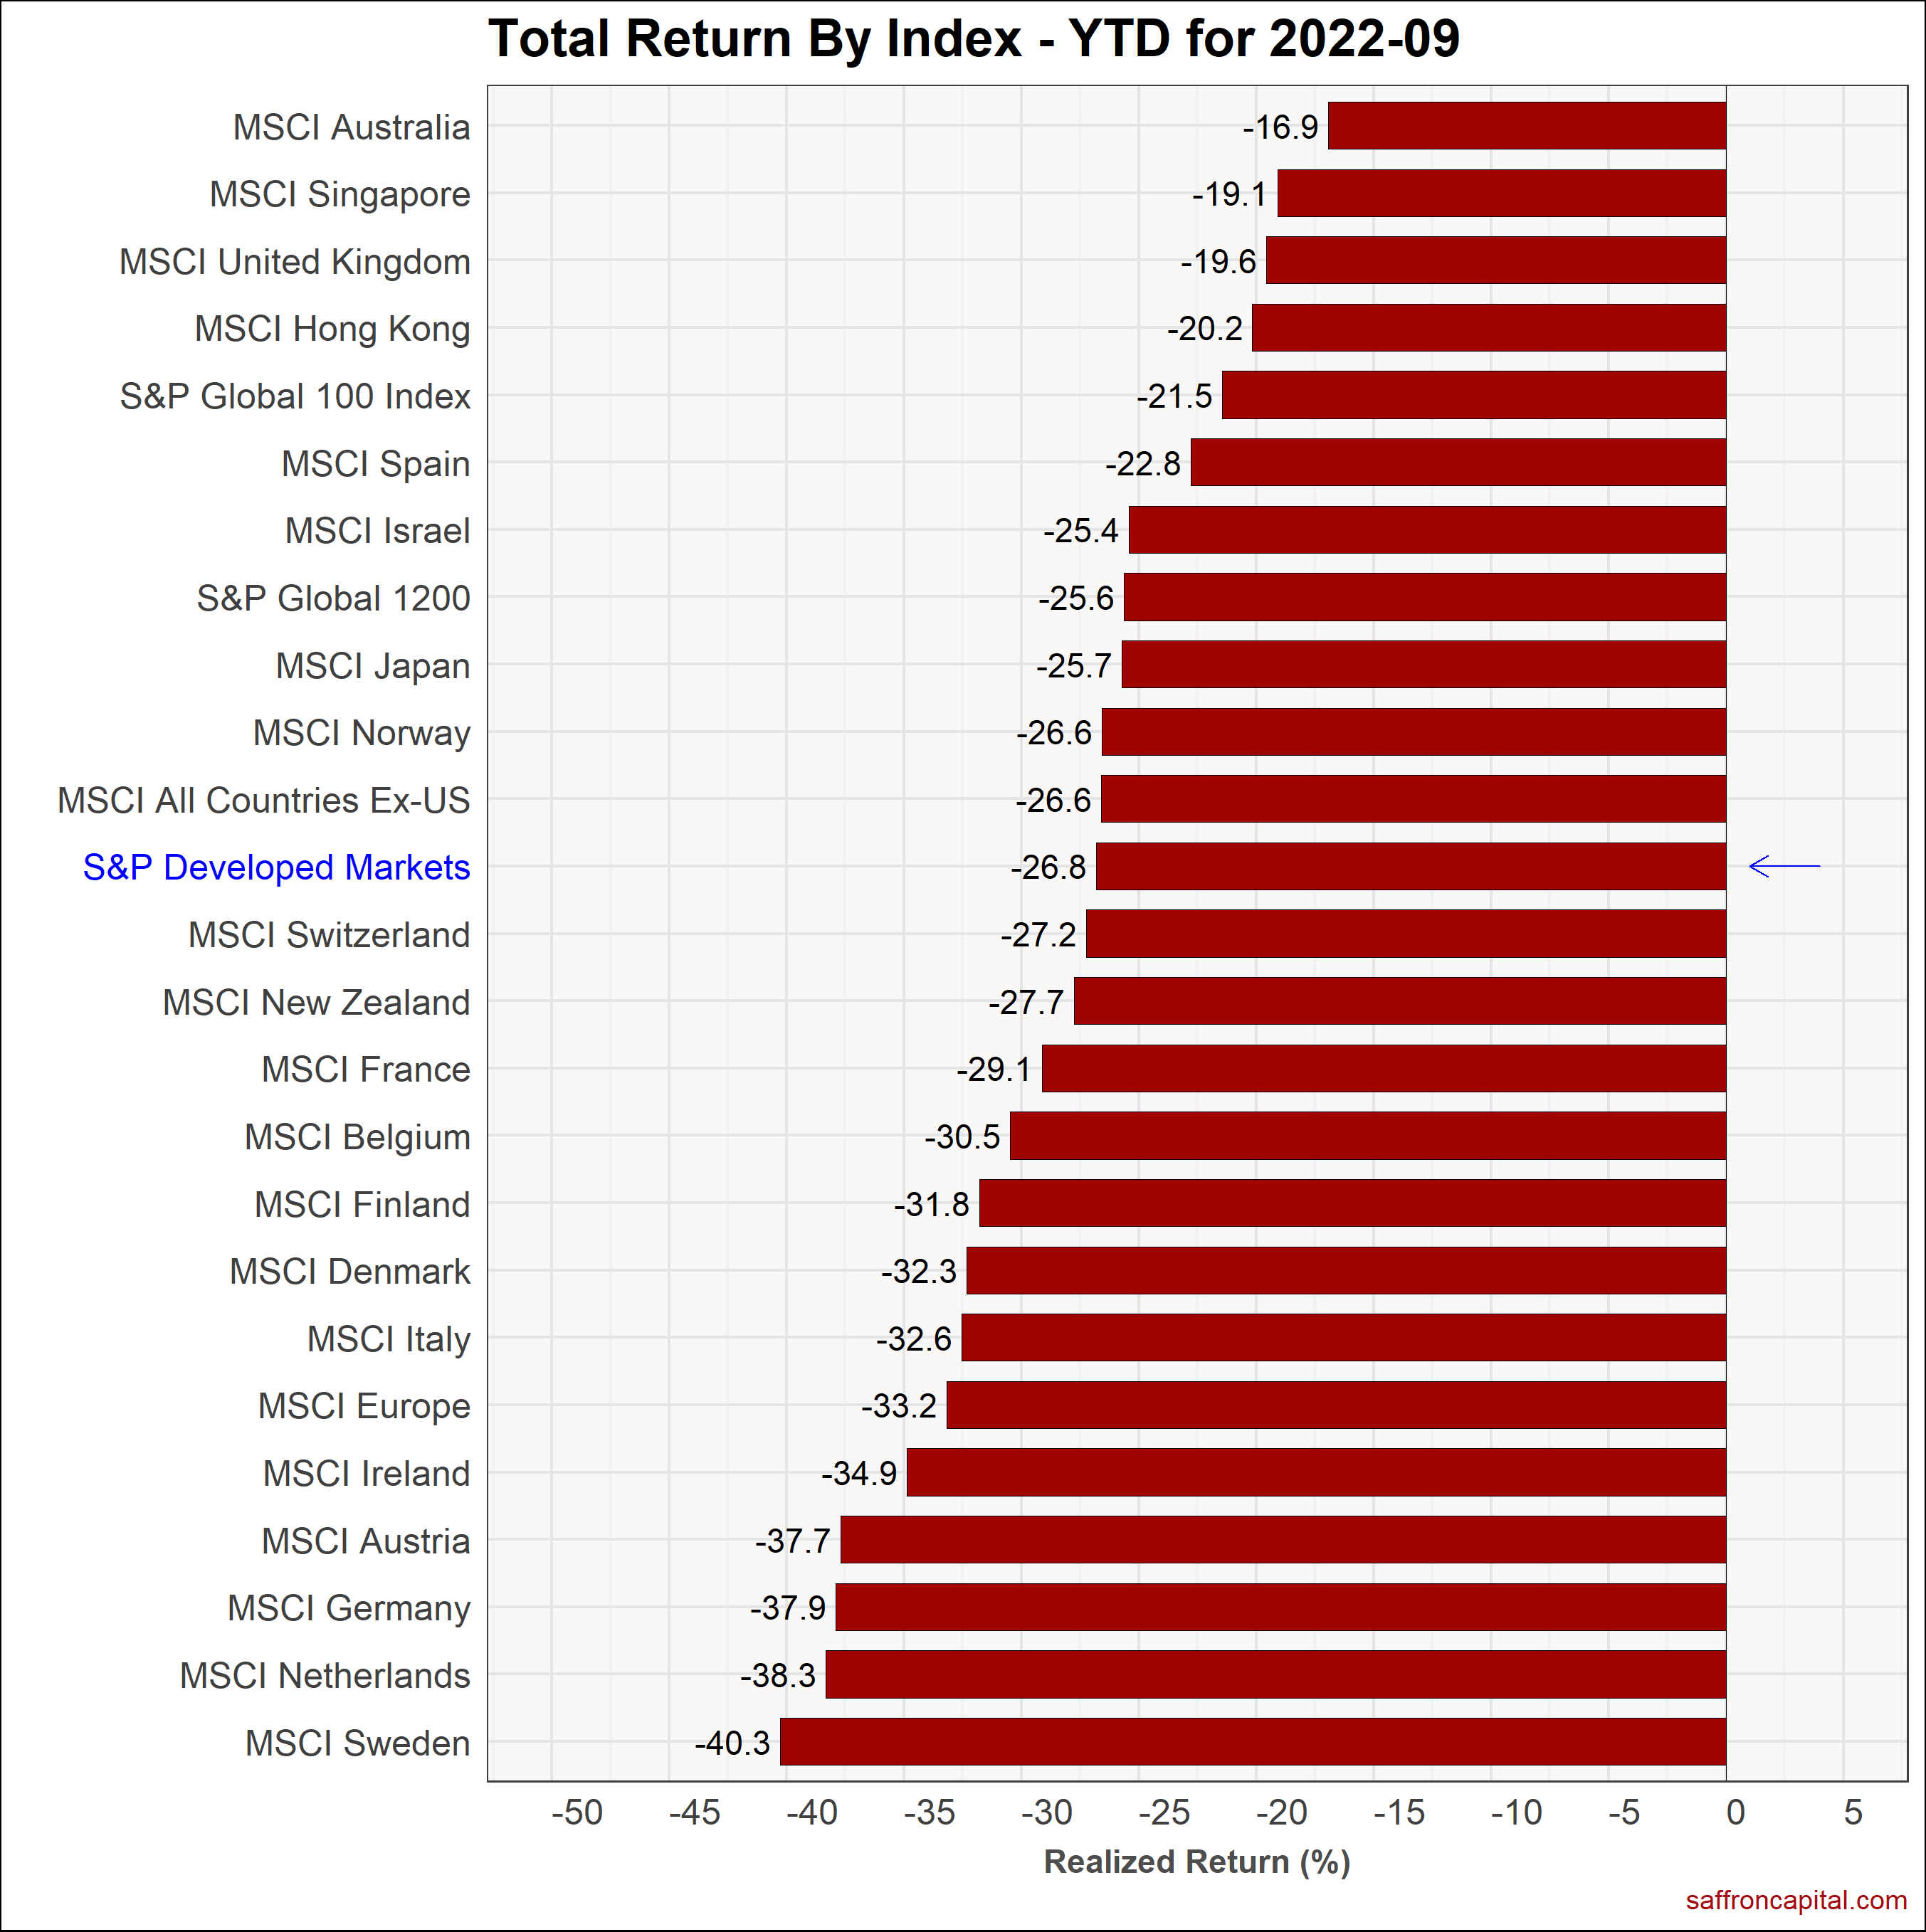
Elsewhere, developed market equities were hard hit. Specifically, the S&P Developed Markets index (-9.1%) lagged the S&P 500 index by 110 bps in September. Markets in Singapore (-6.1%), Italy (-7.1%) and Switzerland (-7.4%) topped the leaders list and outperformed US equities. In contrast. Norway (-19.0%), Germany (-13.7%), and Israel (-13.2%) had the most negative returns. On a year to date basis, the S&P Developed Markets index (-26.8%) trails US equities by 320 basis points with every developed market in the red since January.
Emerging Market Equities
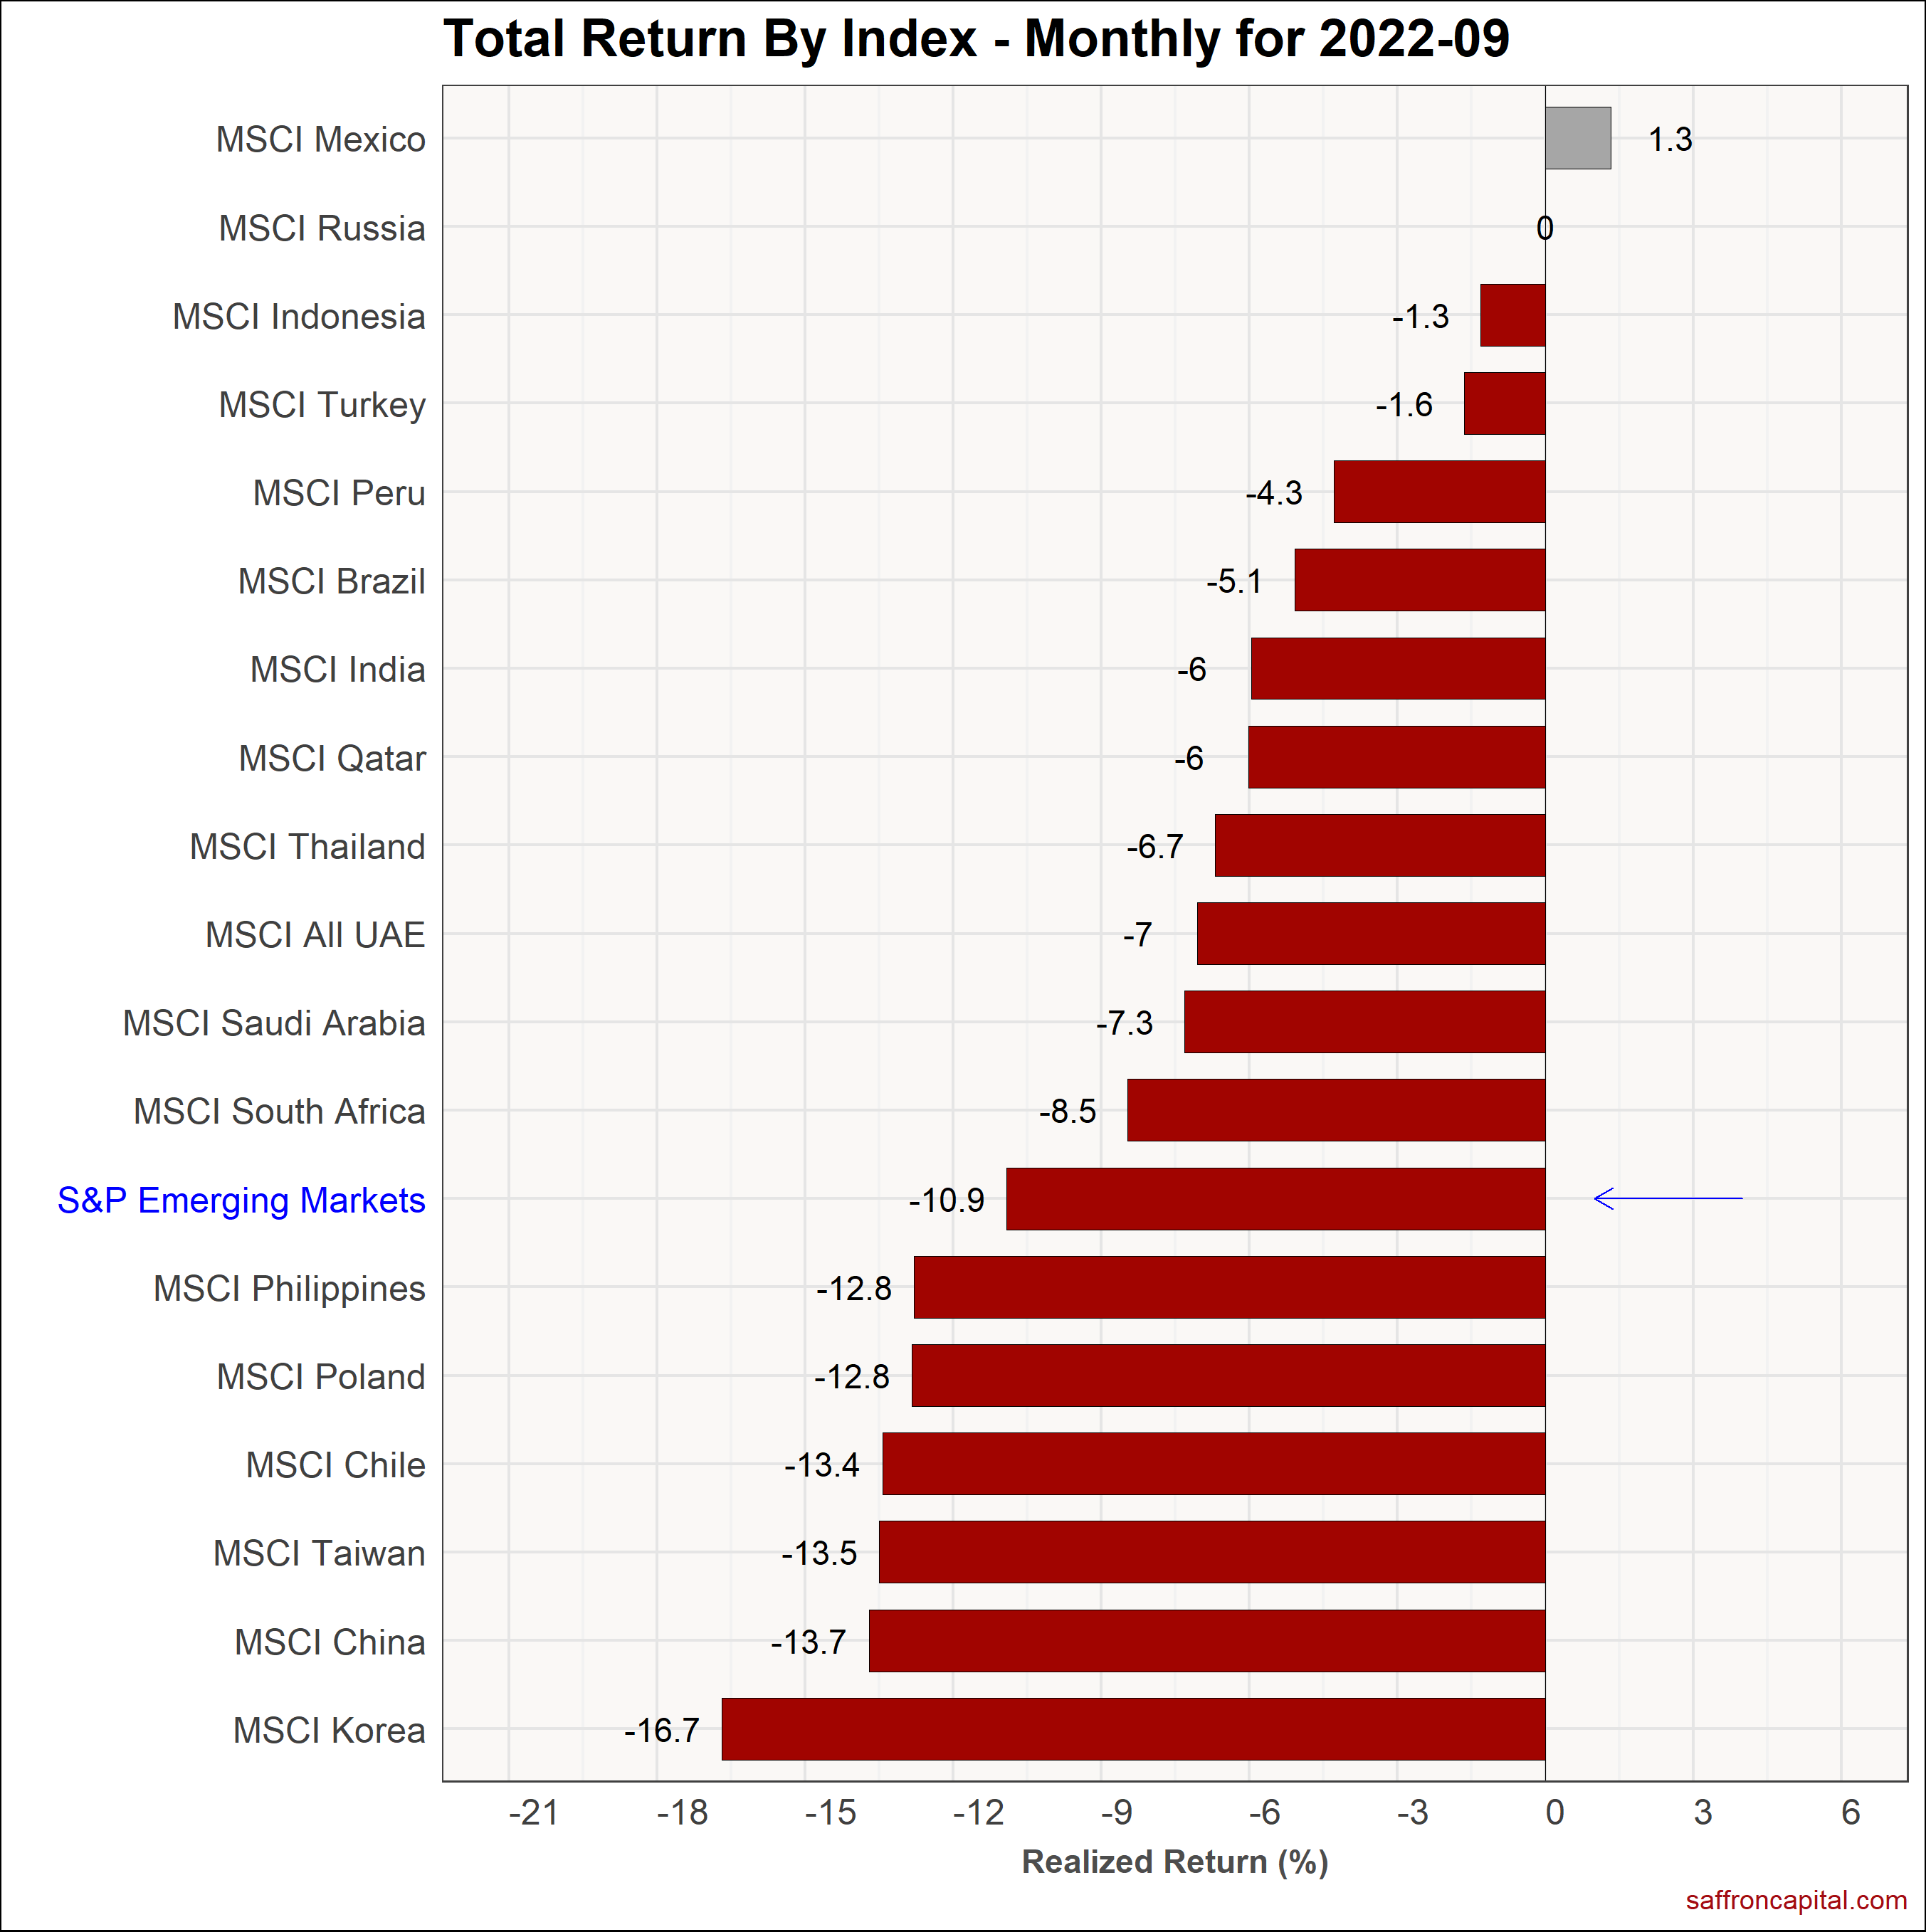
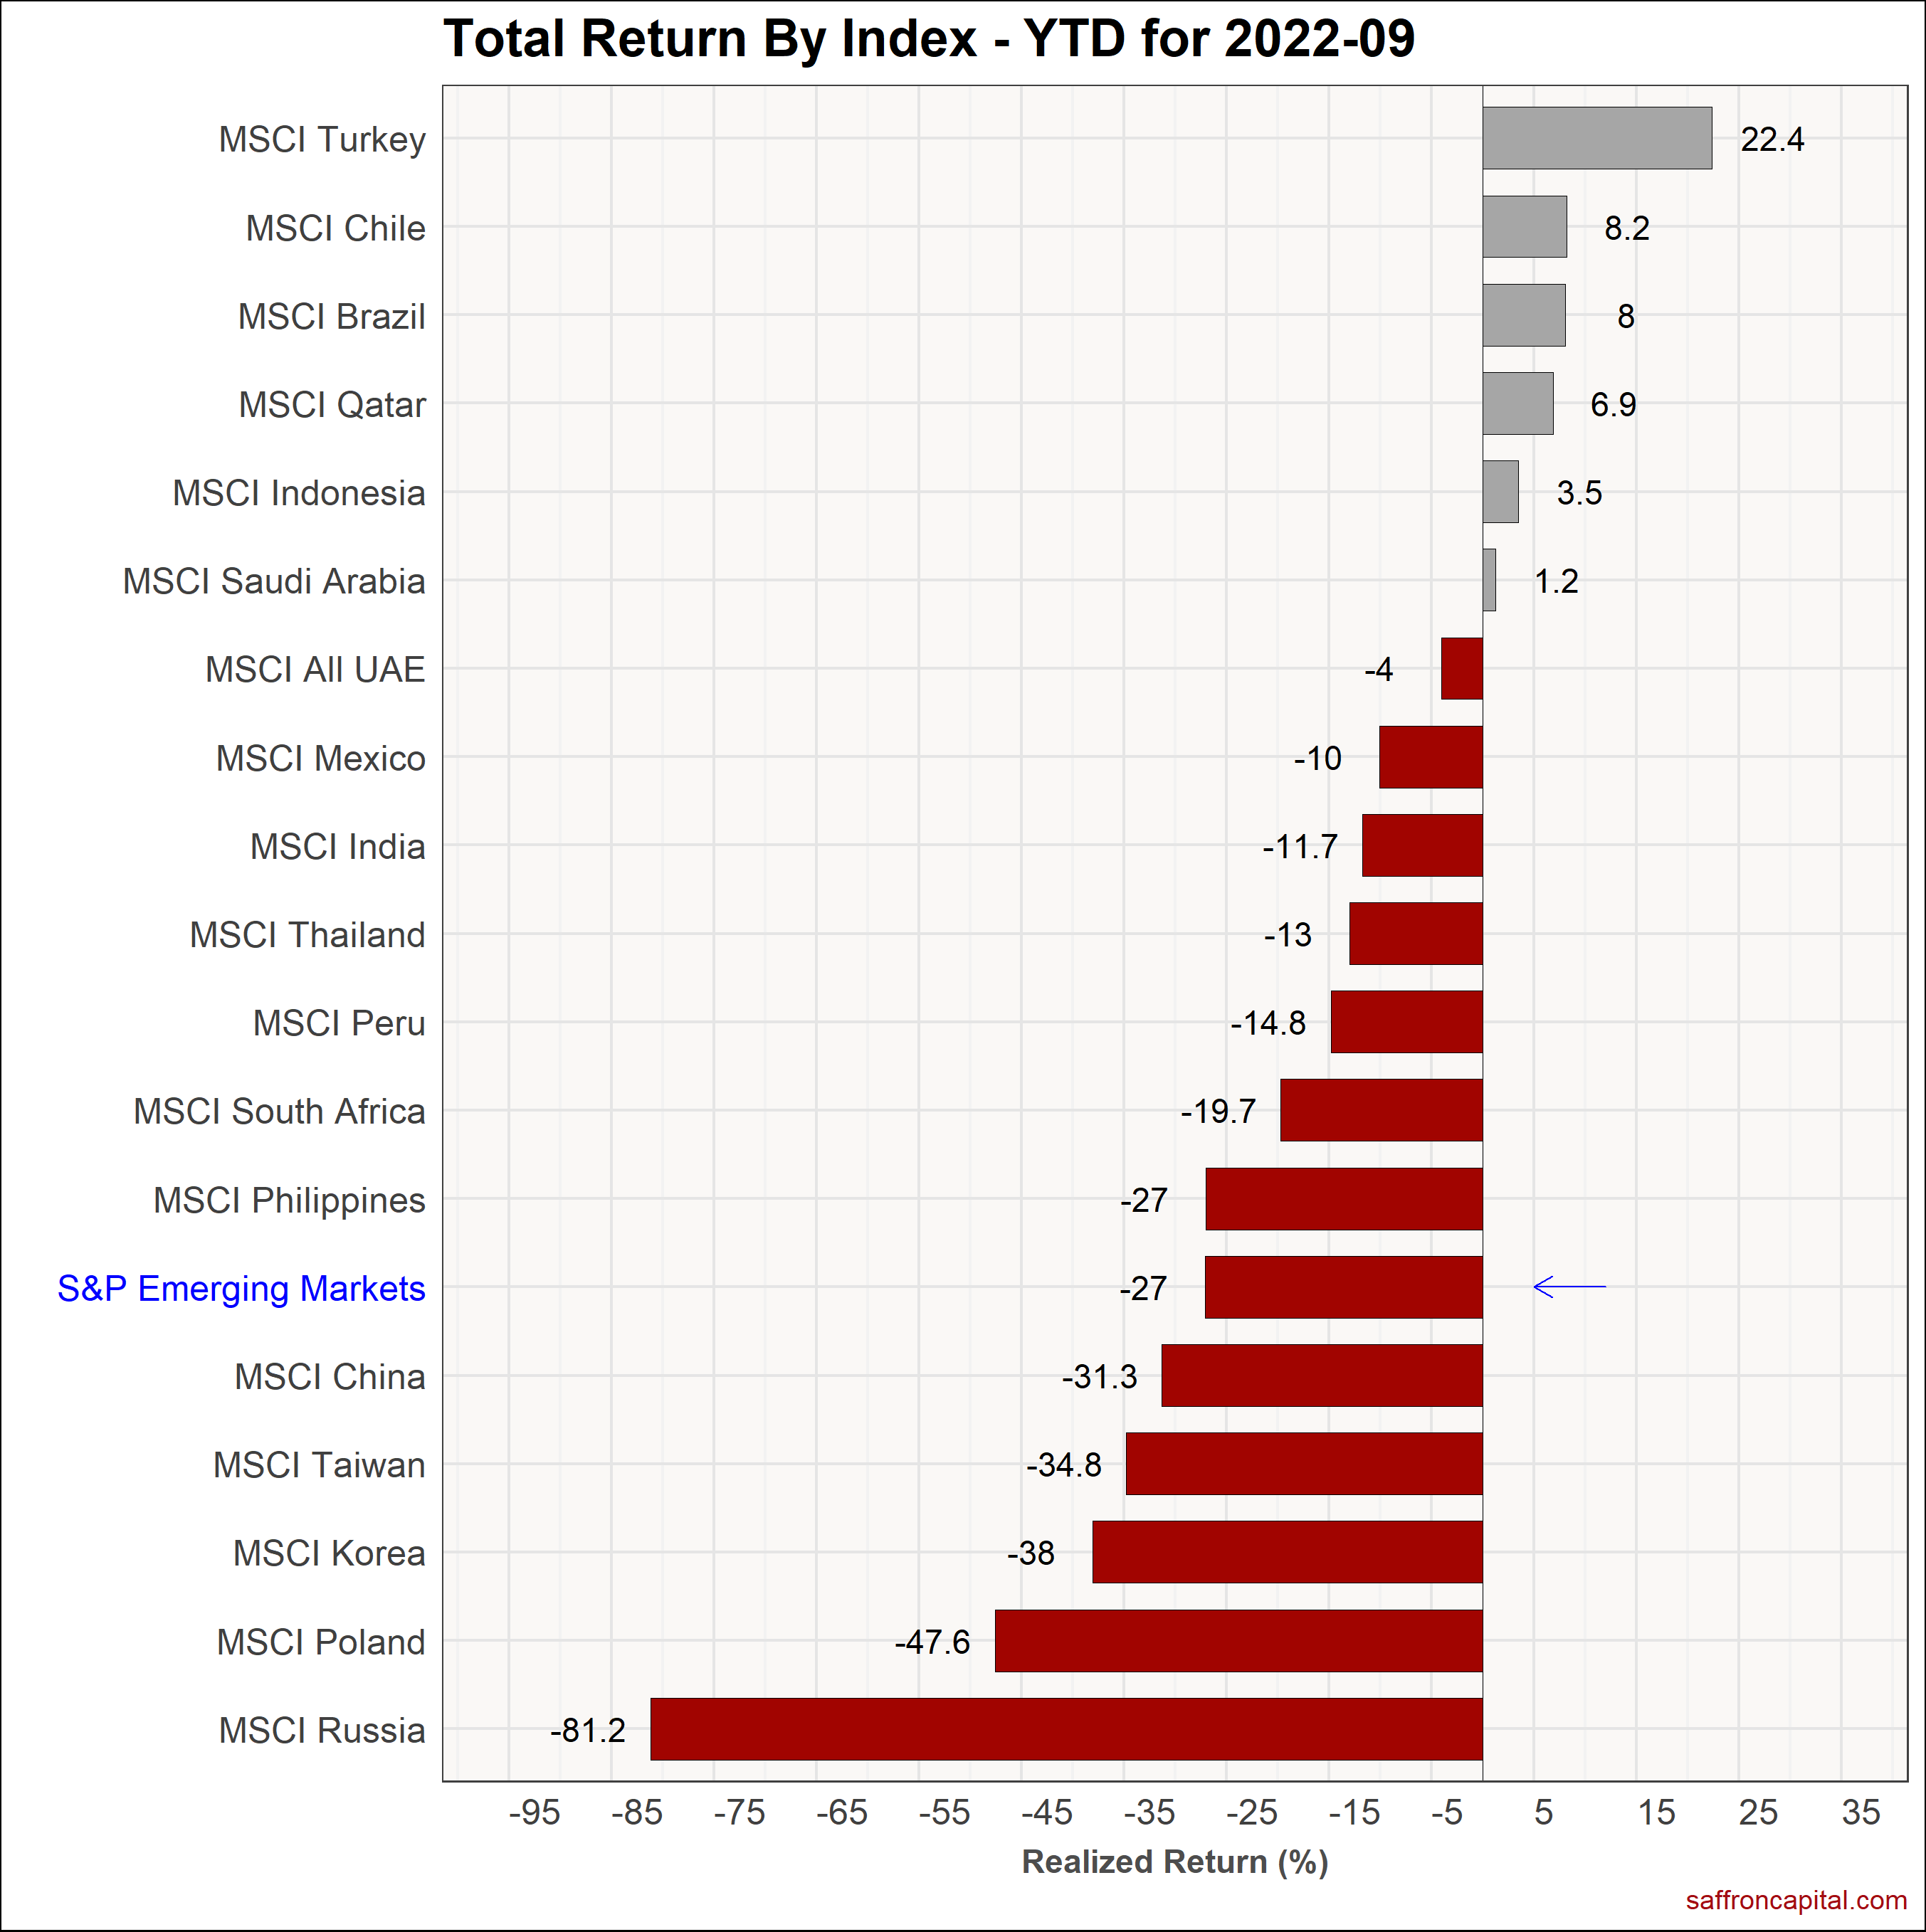
The S&P Emerging Markets Index (-10.9%) trailed developed and US markets in September. The strongest stock markets were in Mexico (+1.3%), Indonesia (-1.3%) and Turkey (-1.6%). Meanwhile, India (-6.0%) continued to beat the emerging market index and U.S. equities. Korea (-16.7%). China (-13.7%) and Taiwan (-13.5%), fell the hardest. On a year to date basis, the S&P Emerging Market index (-27.0%) remains down and is roughly flat to the performance of developed markets.
Government Bonds
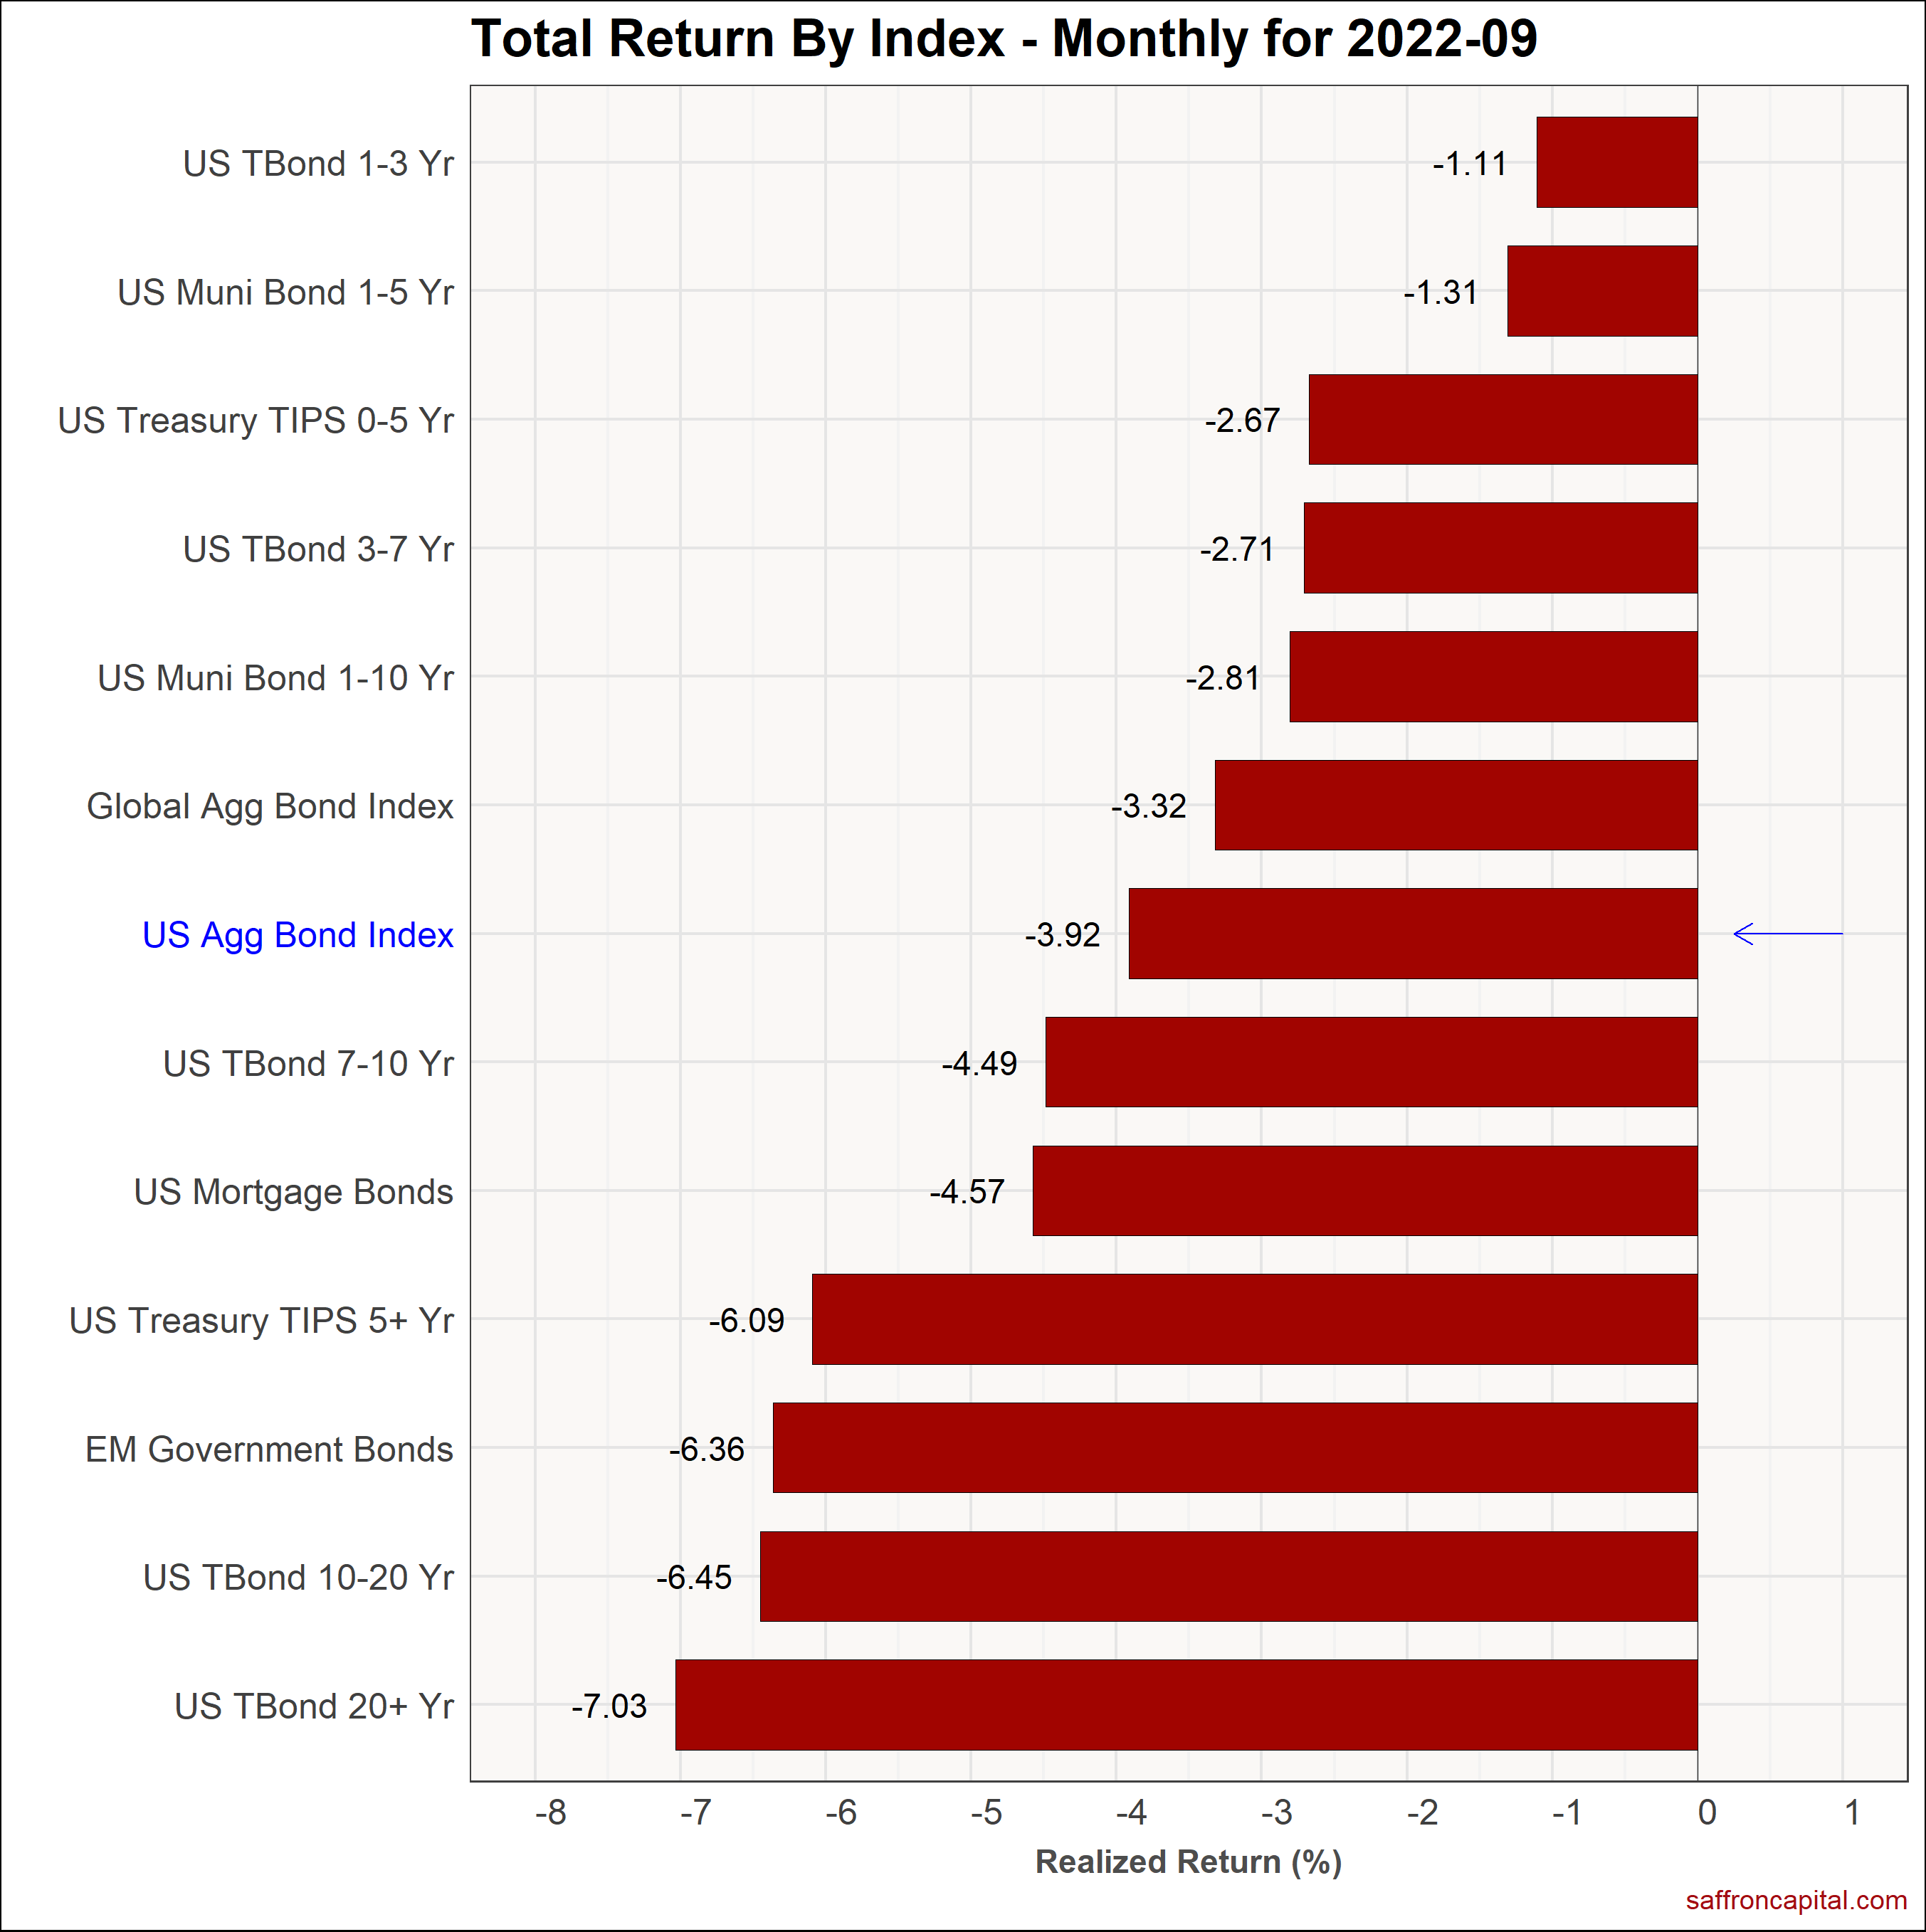
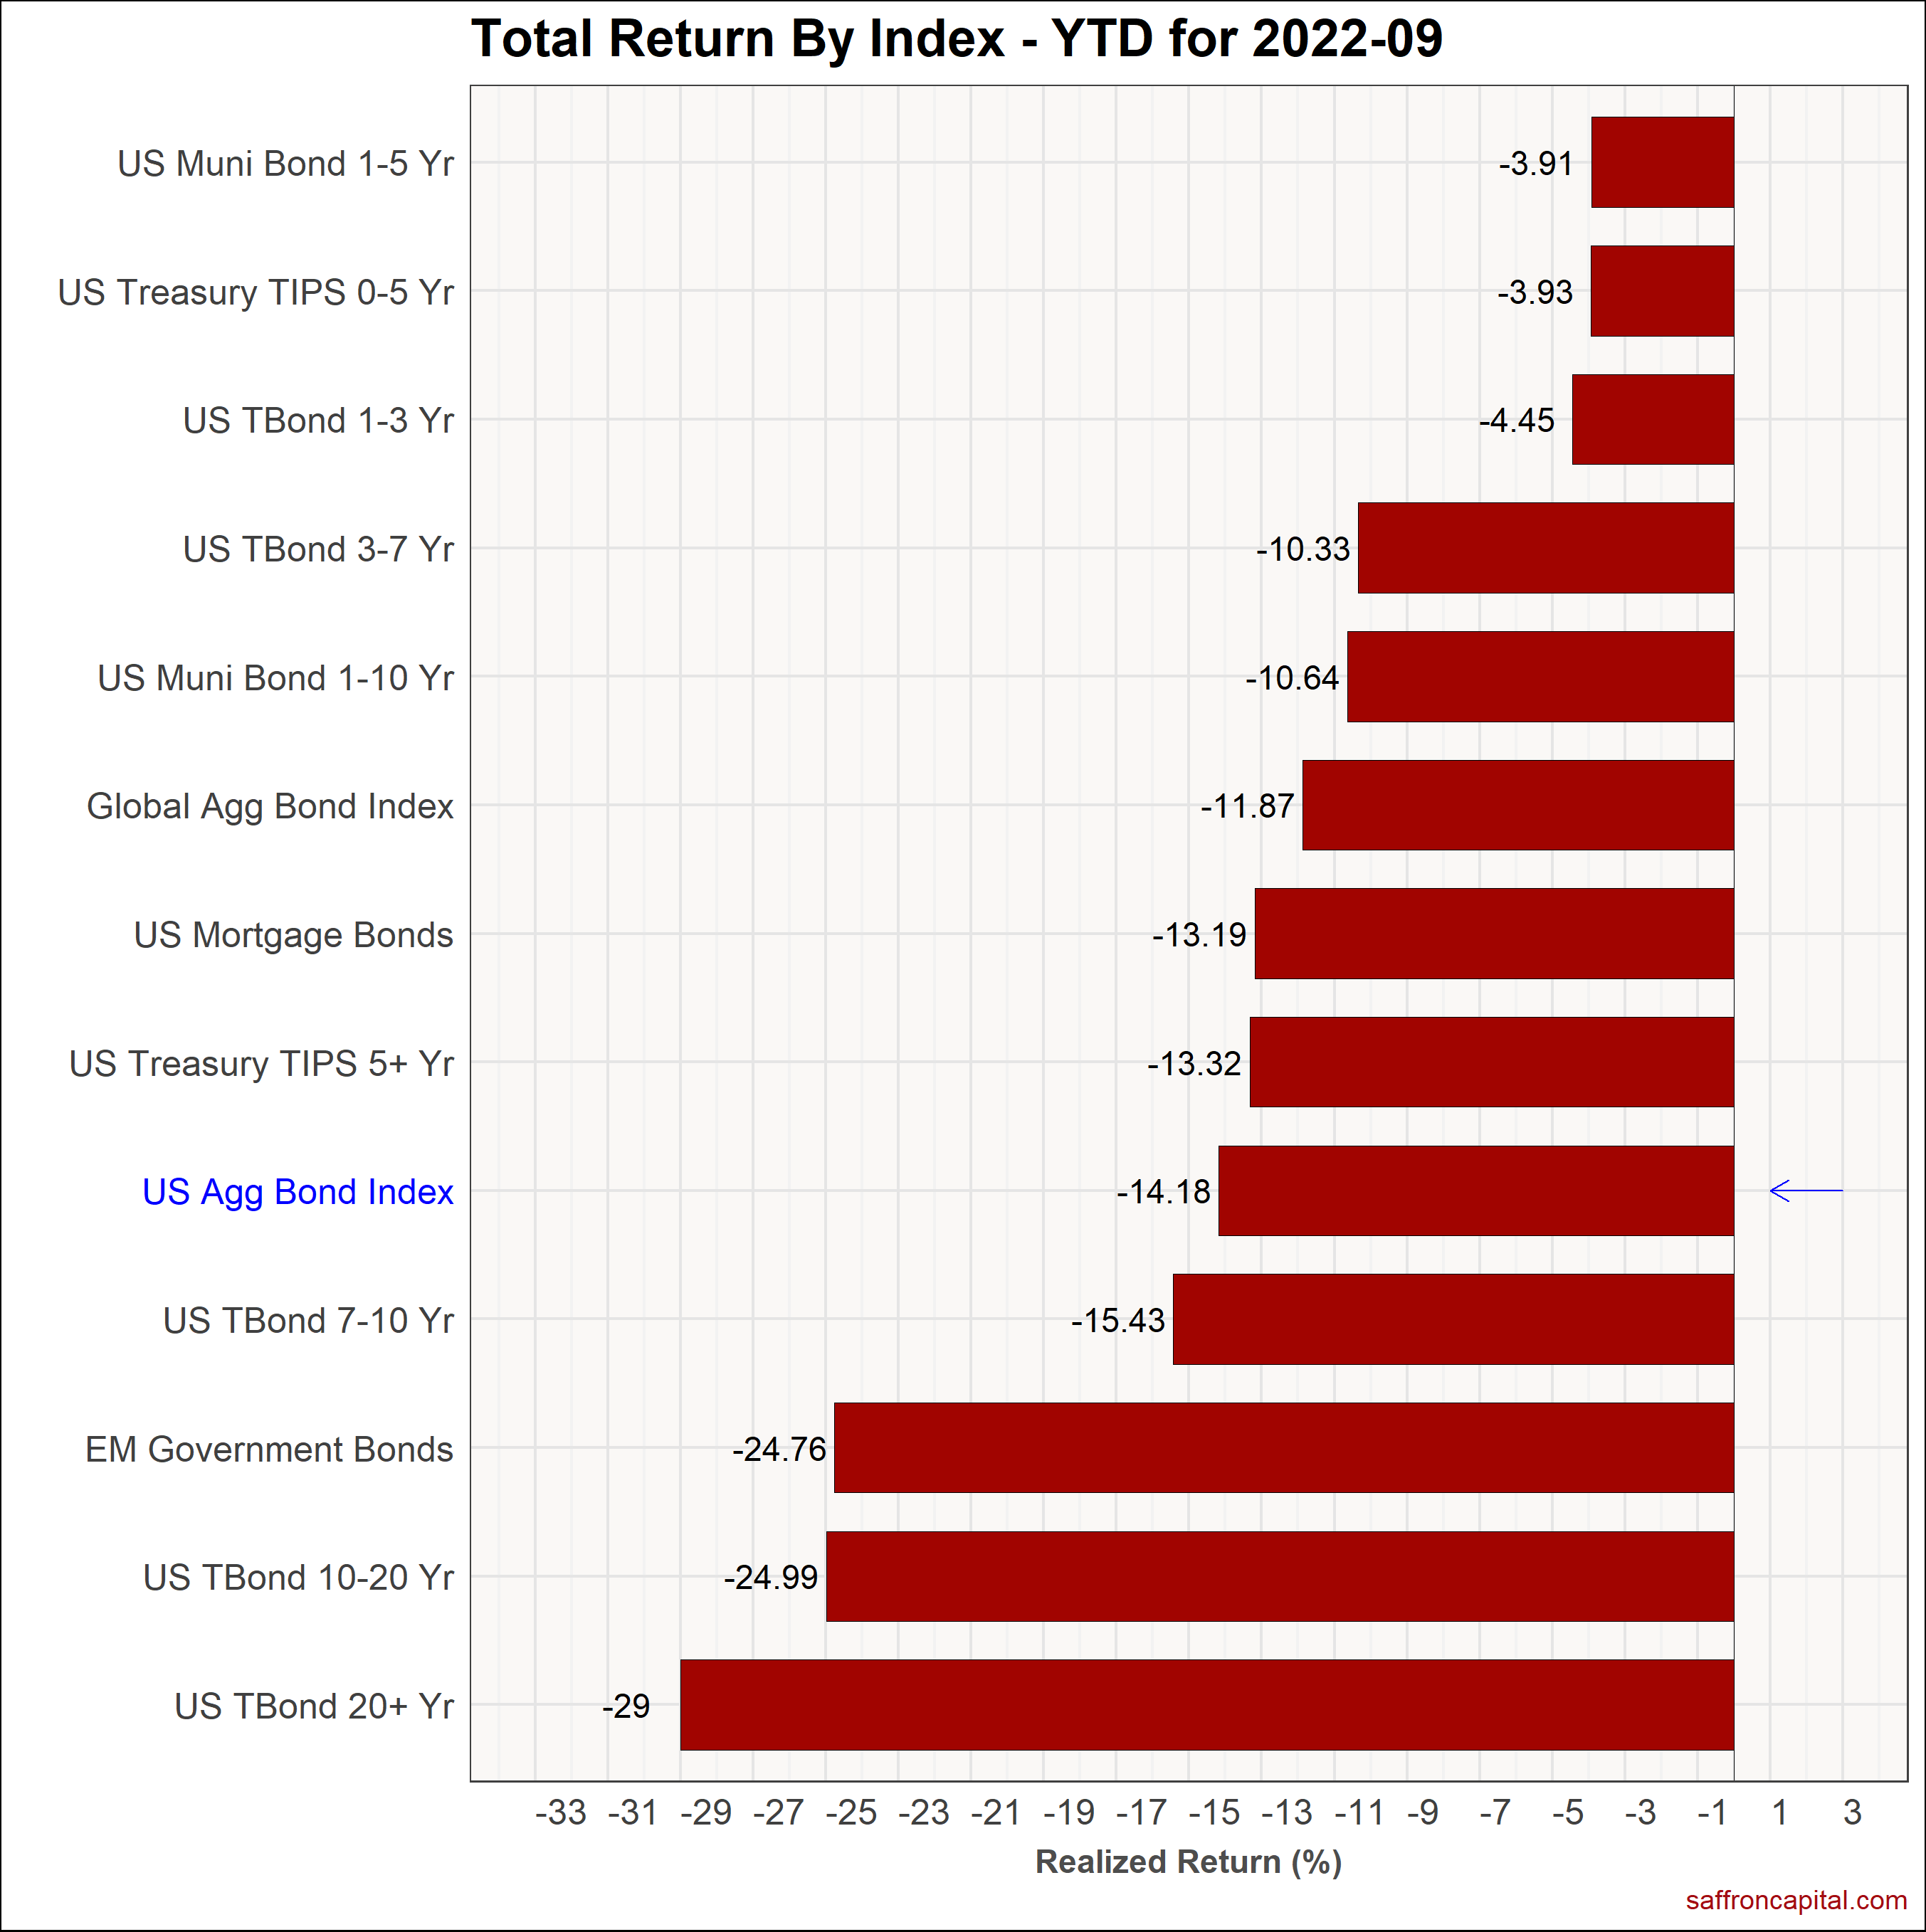
September returns for government bond markets had modest declines as seen in the U.S. Aggregate Bond Index (-3.92%). At the same time, sovereign bonds for developed economies had modest losses with the Global Aggregate Bond Index (-3.32%) beating US Treasuries and Emerging Market Government Bonds (-6.36%). Surprisingly, inflation protected bonds (-6.09%) proved to be more vulnerable than standard Treasuries in September. On a year-to-date basis, the US aggregate Bond index (-14.18%) is having one of its worse years ever and is being pulled down by long duration 20year plus treasuries (-29.0%) and Treasuries maturing 10 to 20 years (-24.99%).
Corporate & Infrastructure Bonds
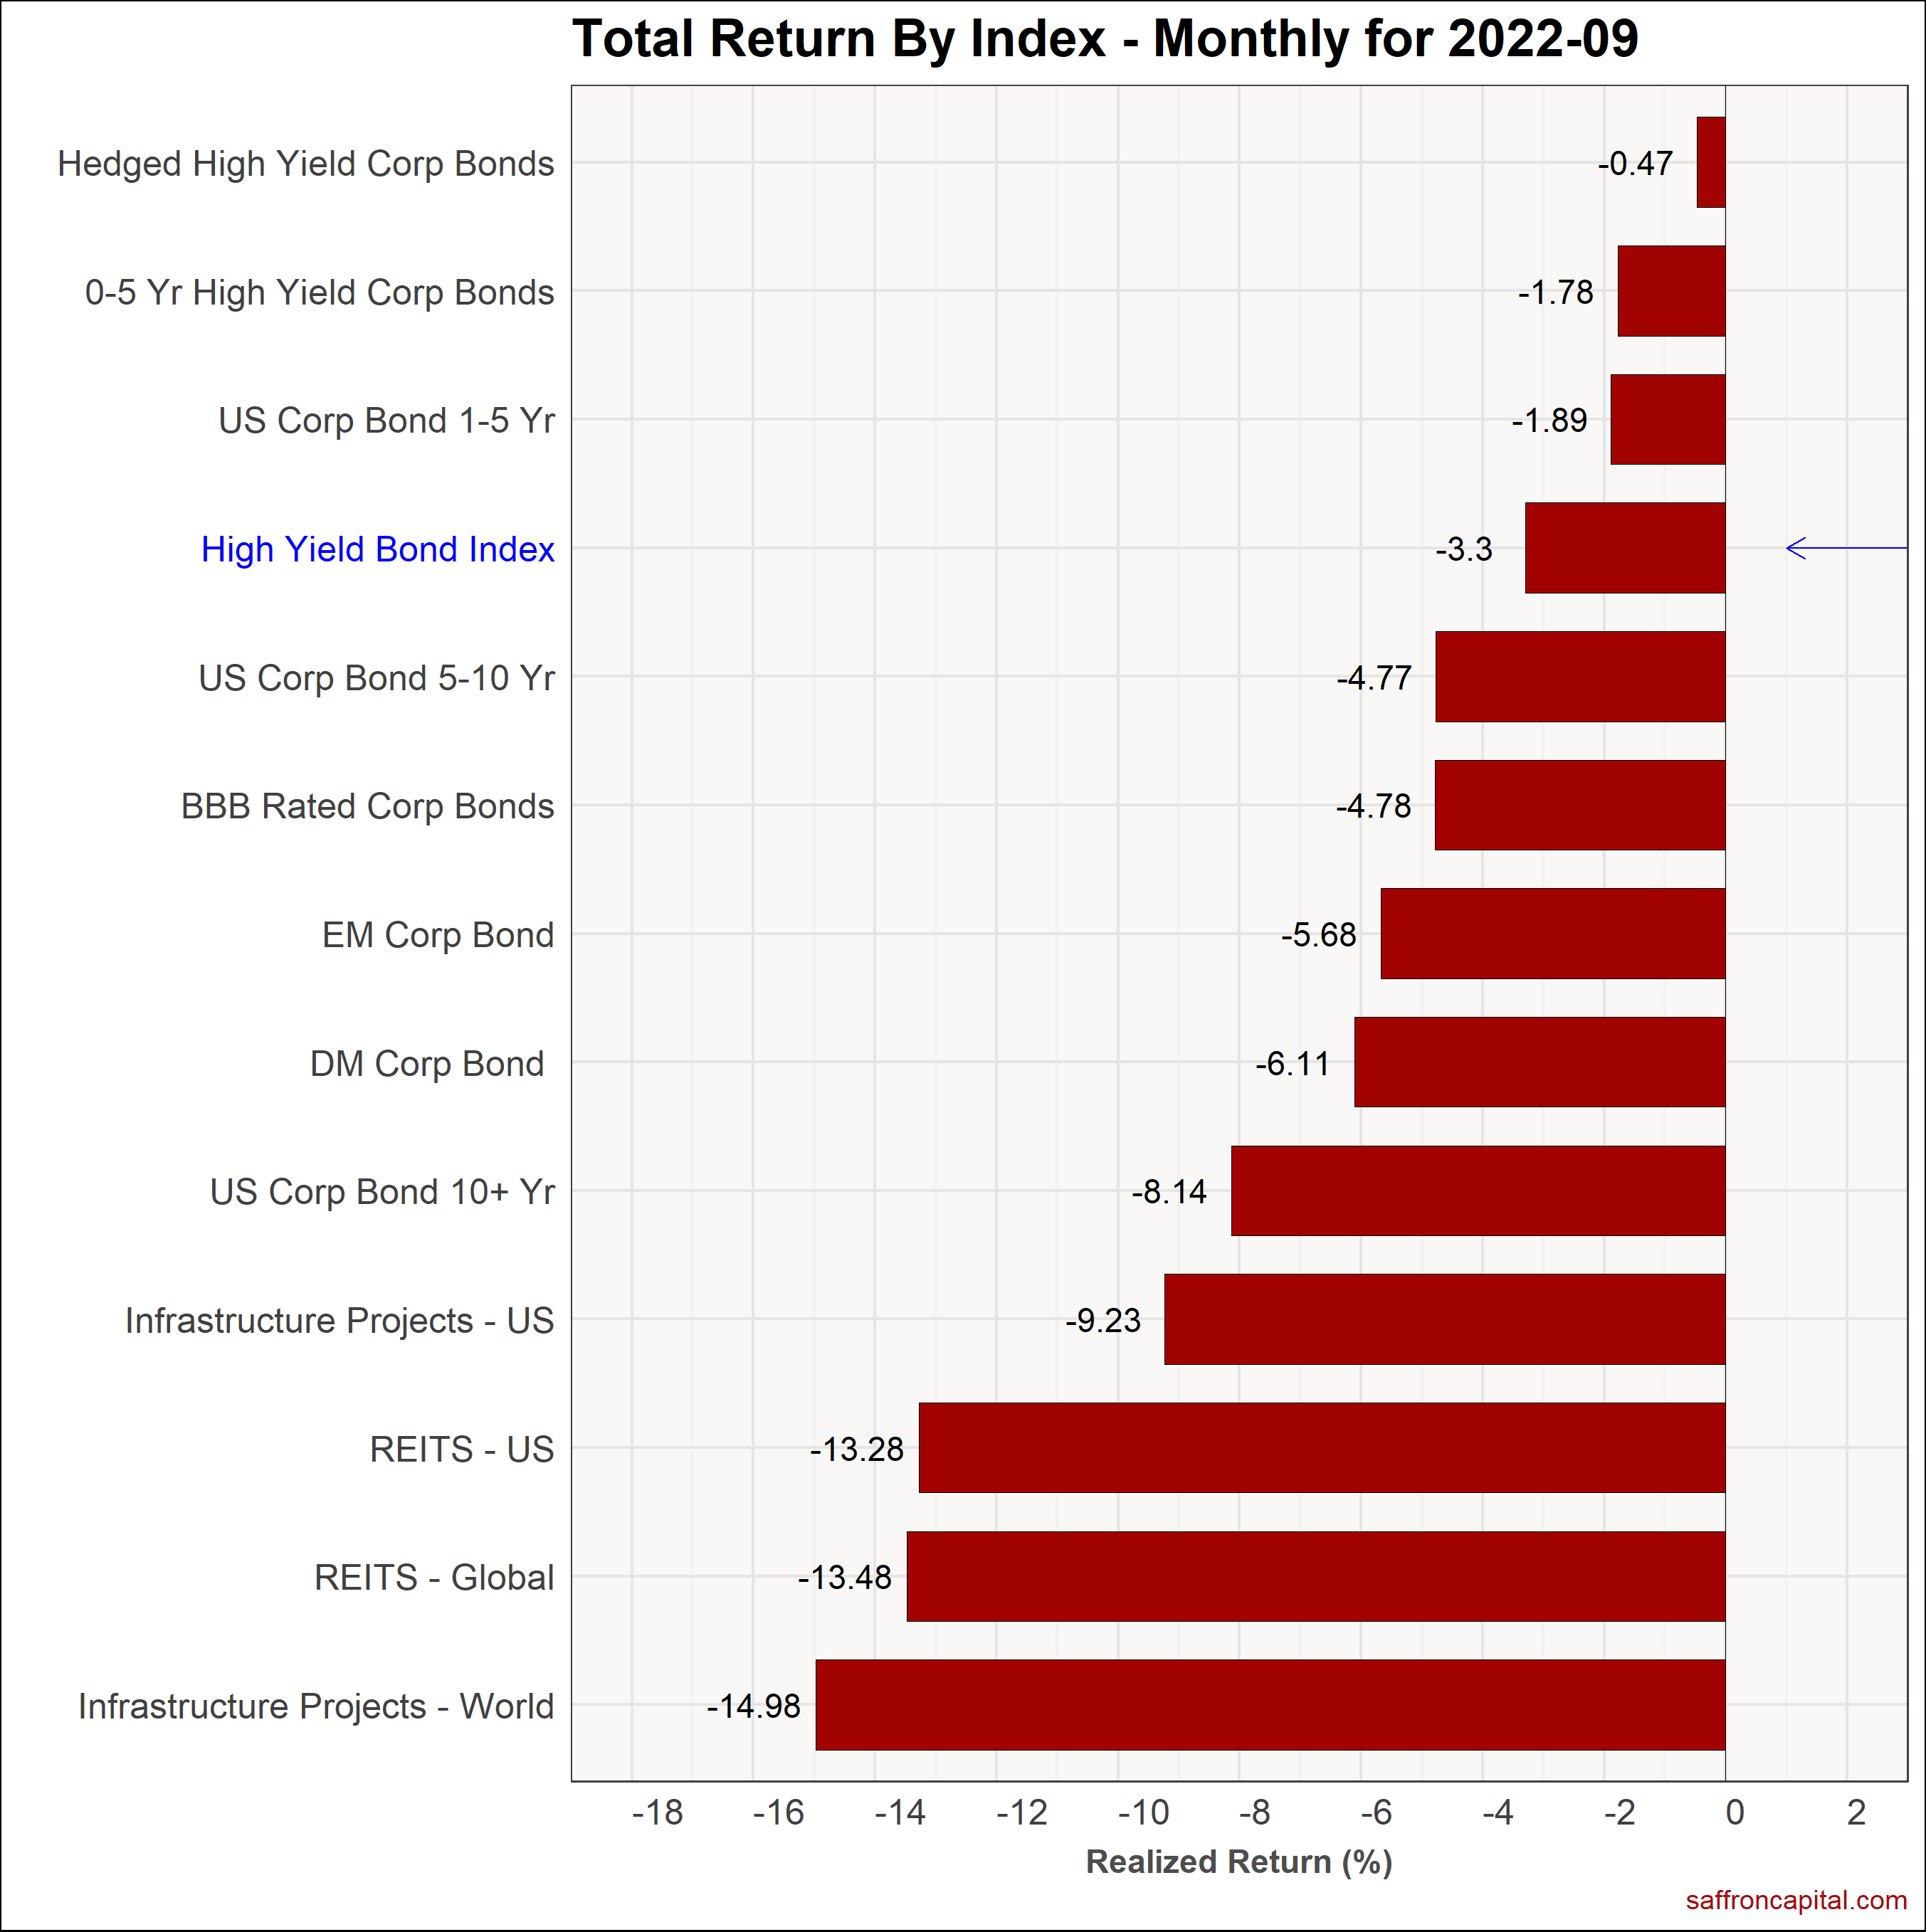
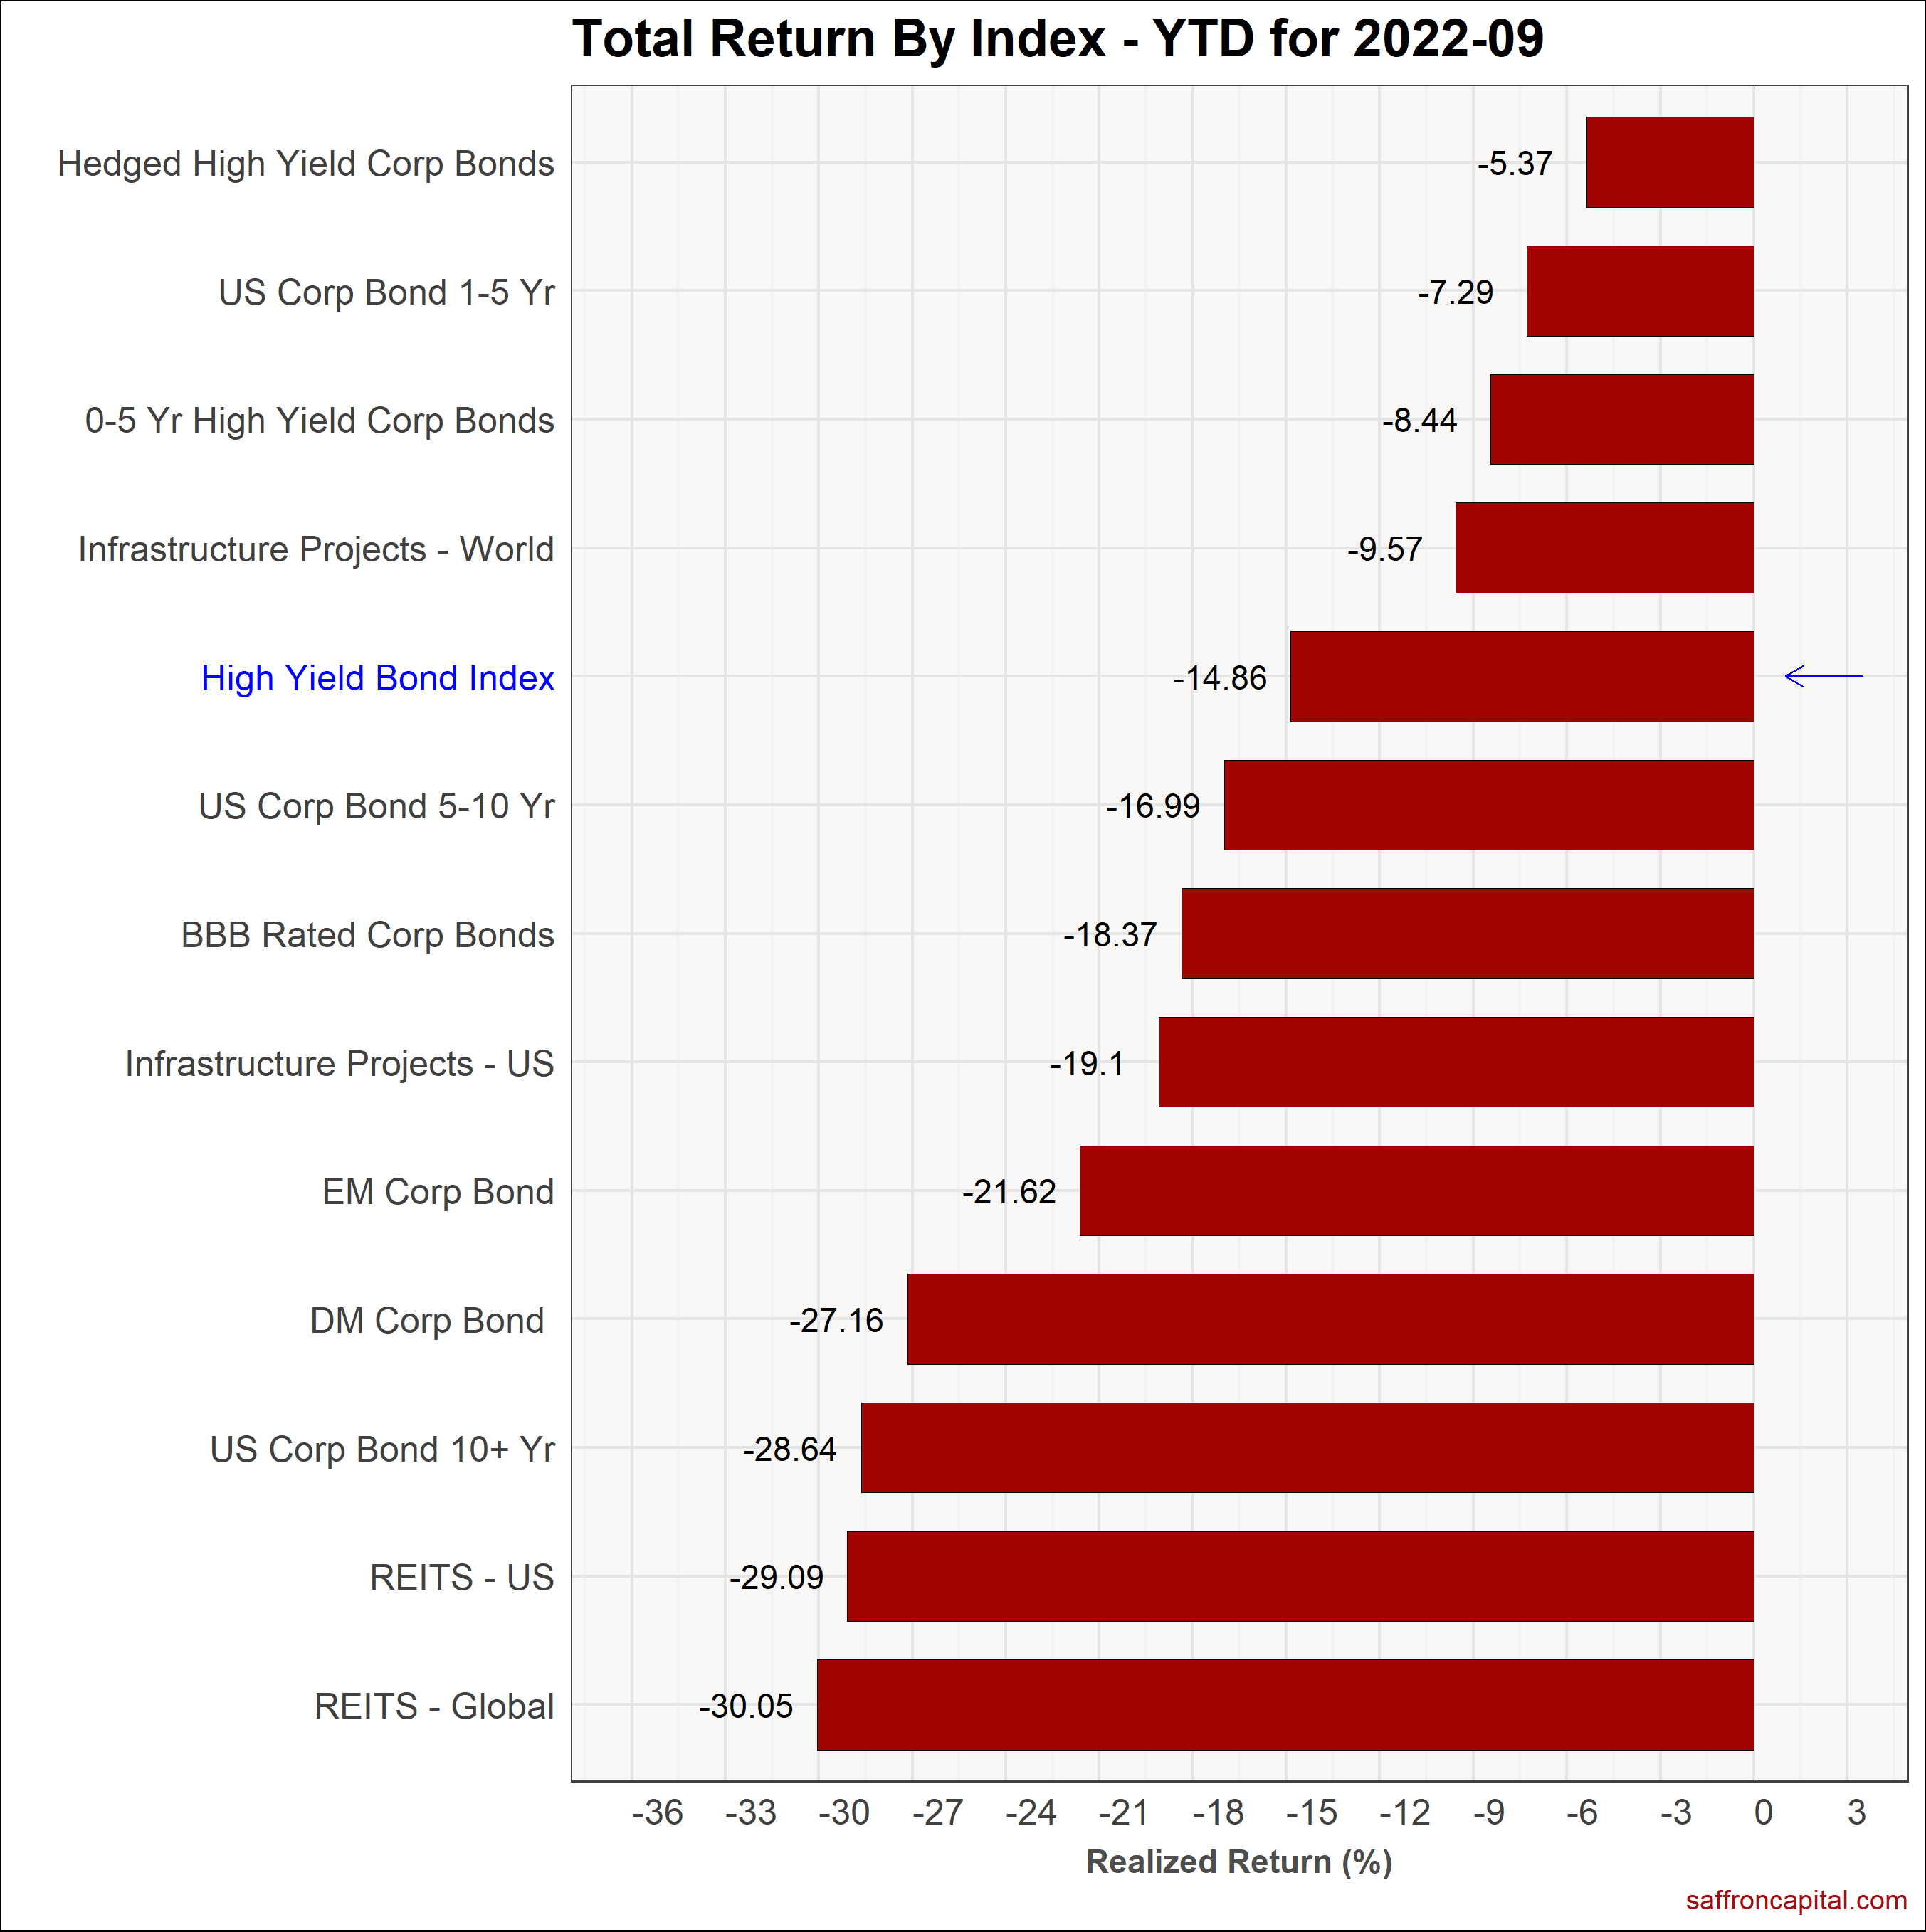
The High Yield Bond Index (-3.3%%) had negative returns in September, but proved to be a safe haven outperforming the S&P 500 index by 470 basis points. Specifically, the best performing corporate bonds were hedged high yield securities (-0.47%), 0-5 year high yield bonds (-1.78%) and high quality corporate bonds maturing in 1 to 5 years (-1.89%). In contrast, the worse performing assets in the class were International infrastructure project bonds (-14.98%), global REITS (-13.48%) and US REITS (-13.28%). These securities have been heavily sold and may offer buying opportunities as recession concerns gain pace. Finally, on a year-to-date basis, the benchmark high yield index (-14.86) is still proving to be more durable than US equities.
Commodities
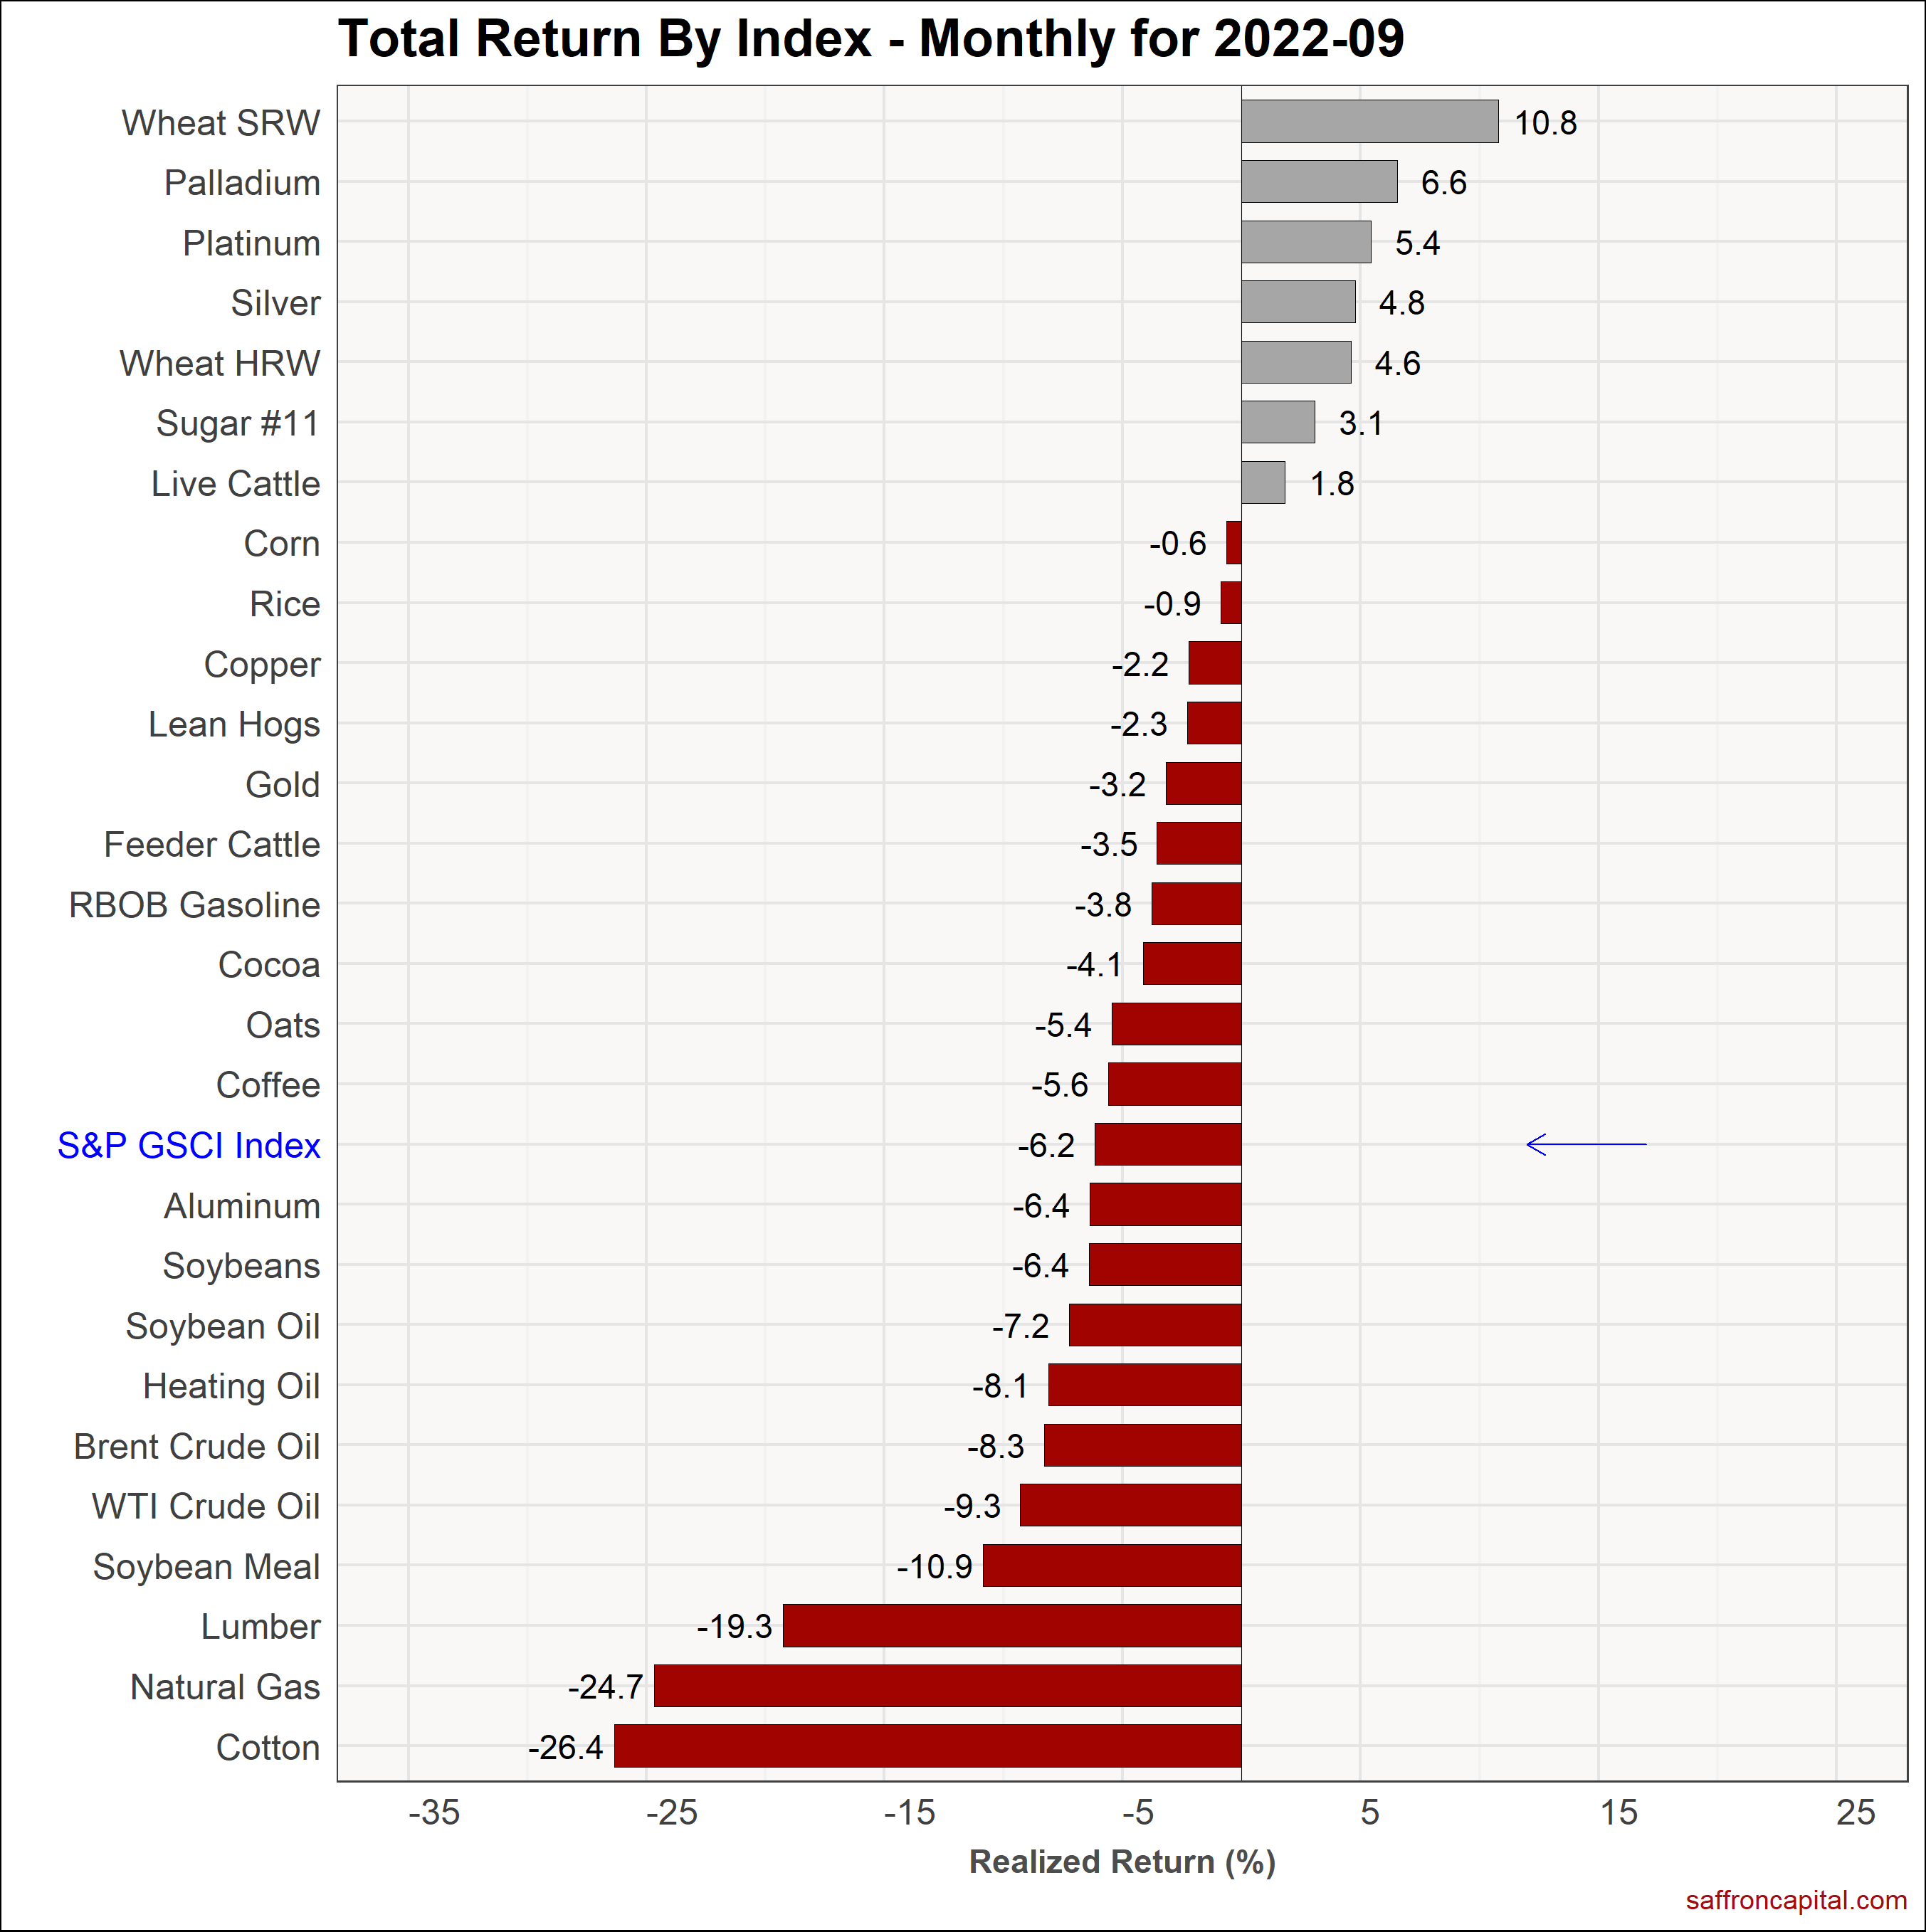
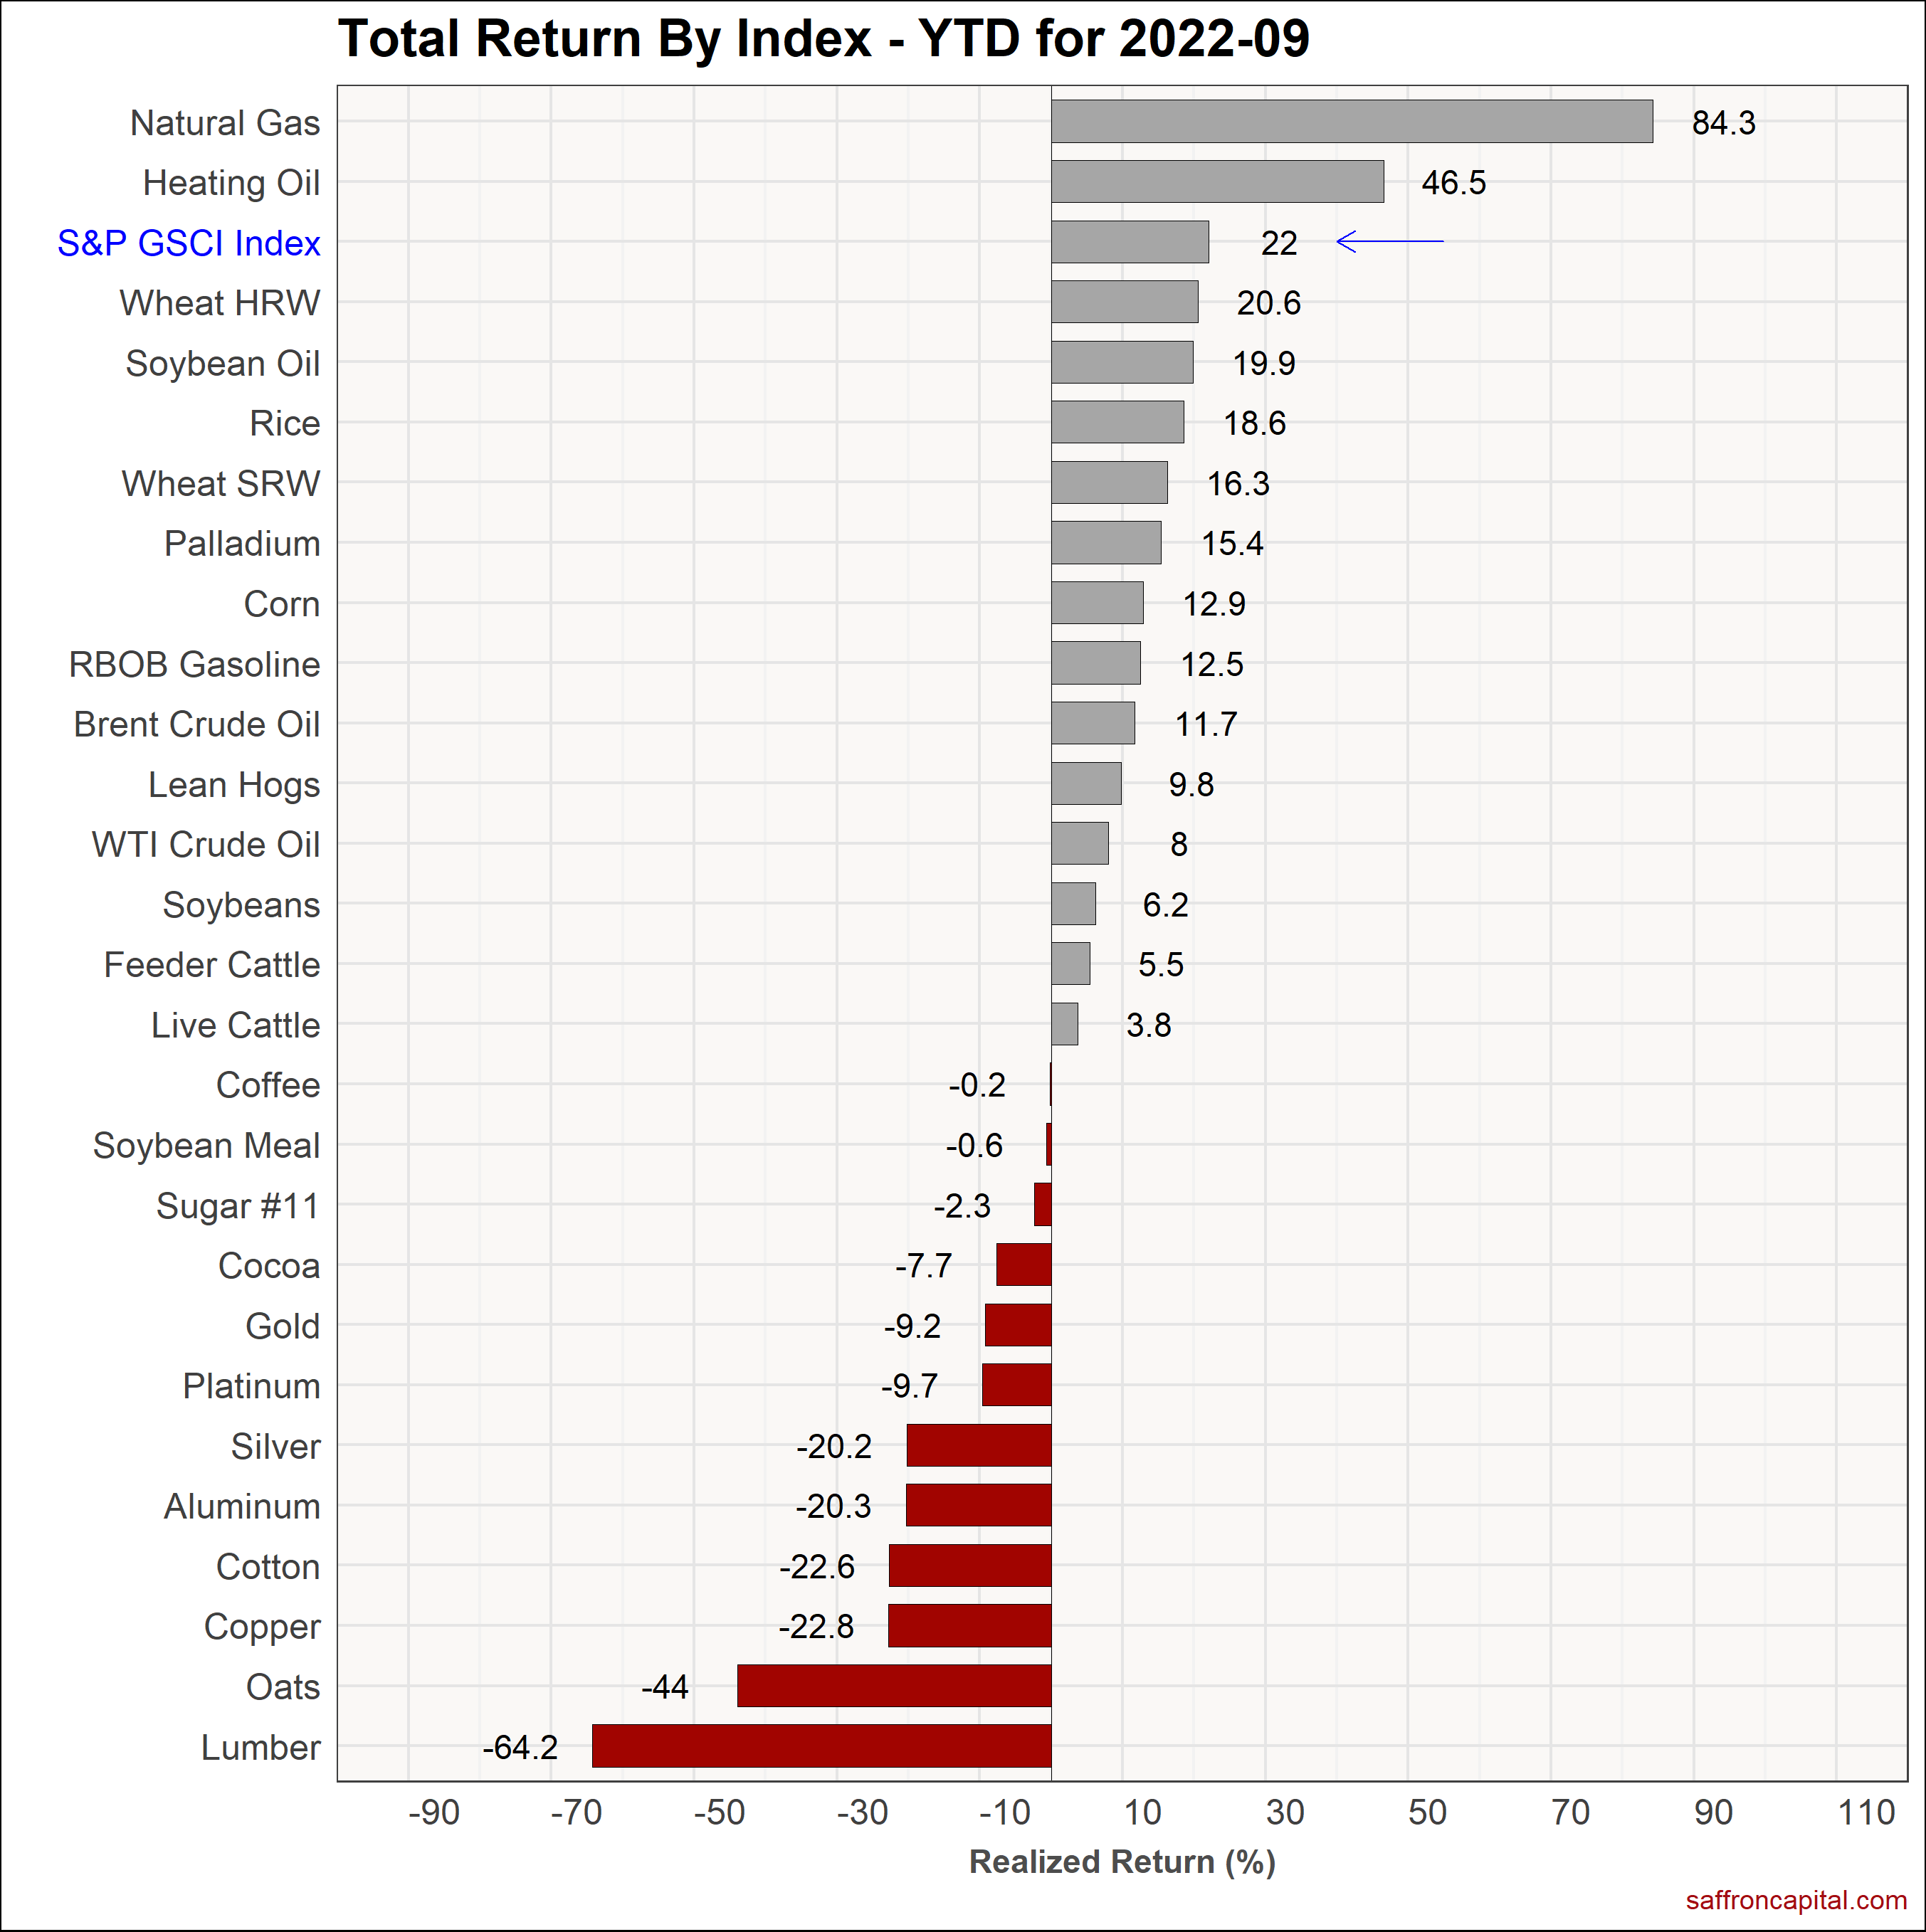
September returns for commodities were also negative. The S&P GSCI index (-6.2%) confirmed that Fed rate increases are impacting commodity prices. Strong performers this month included spring red wheat (+10.8%), palladium (+6.6%) and platinum (5.4%). Moreover, the high dollar has raised demand concerns for a number of commodities, including US cotton (-26.4%), natural gas (-24.7%), and lumber (-19.3). Meanwhile, WTI crude oil (-9.3%) also proved to be weak. Since January, The strongest performing commodities include natural gas (+84.3%), heating oil (+46.35), and hard red winter wheat (+20.6%).
Currencies
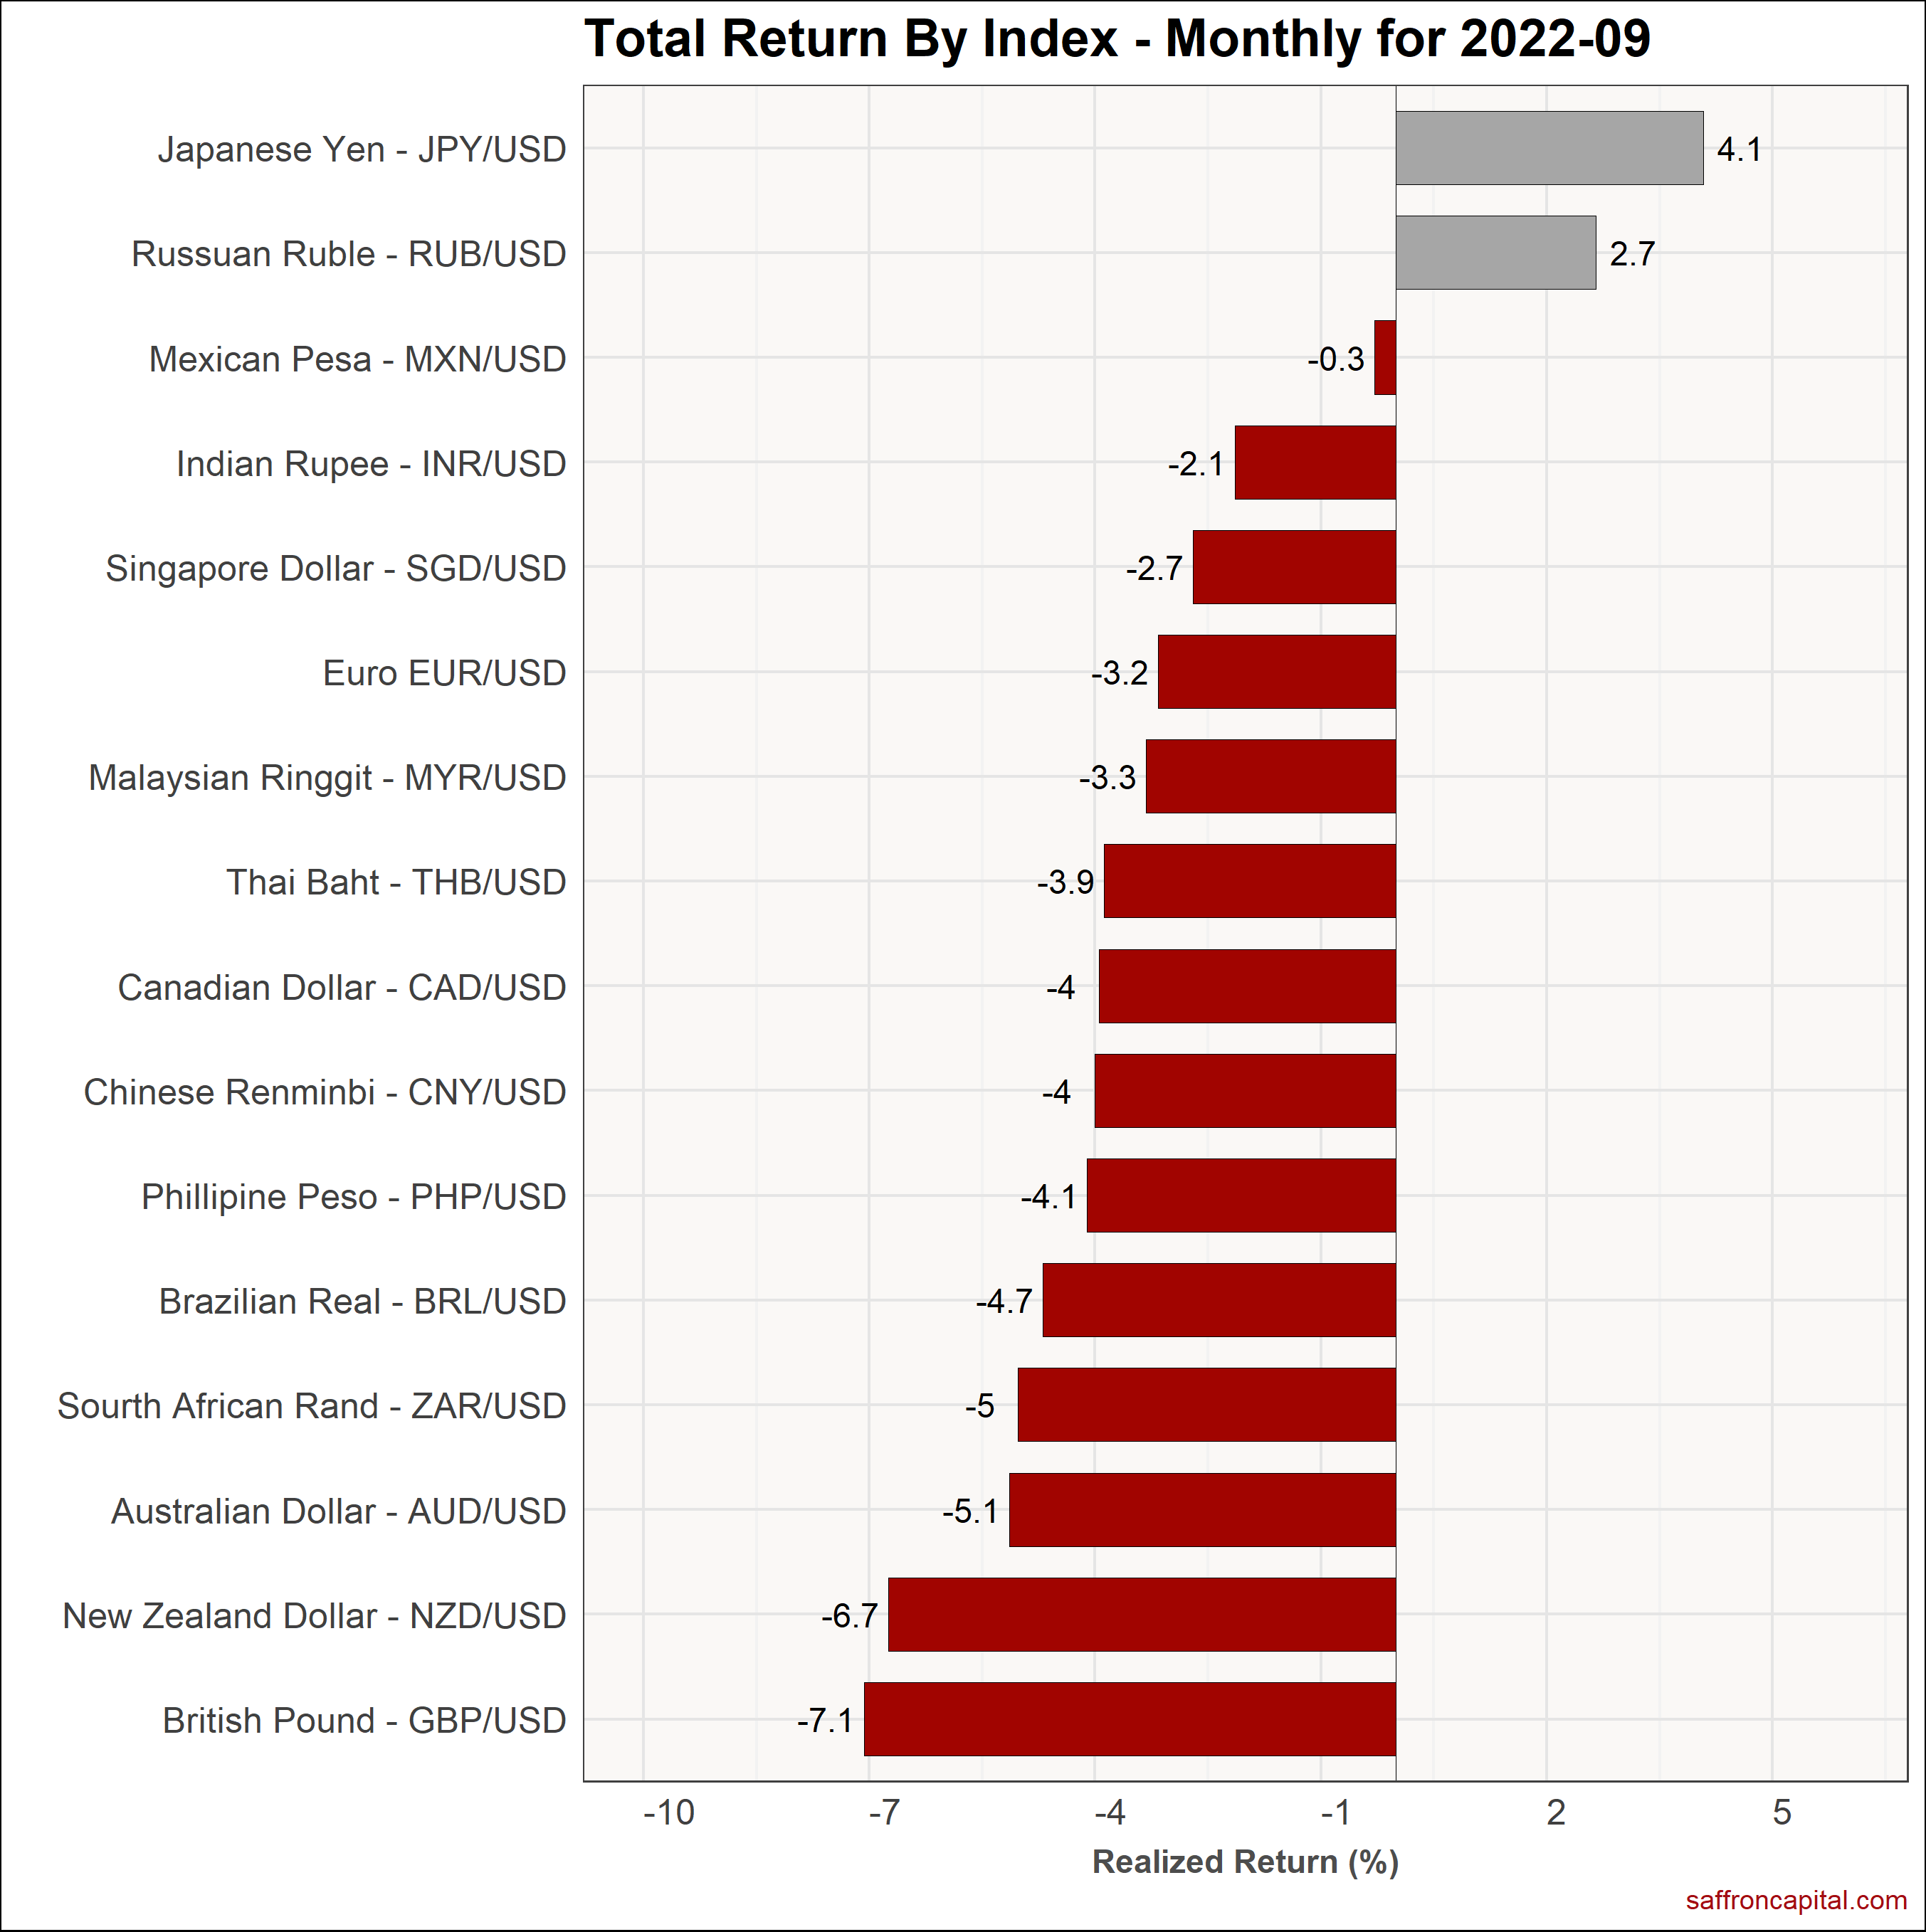
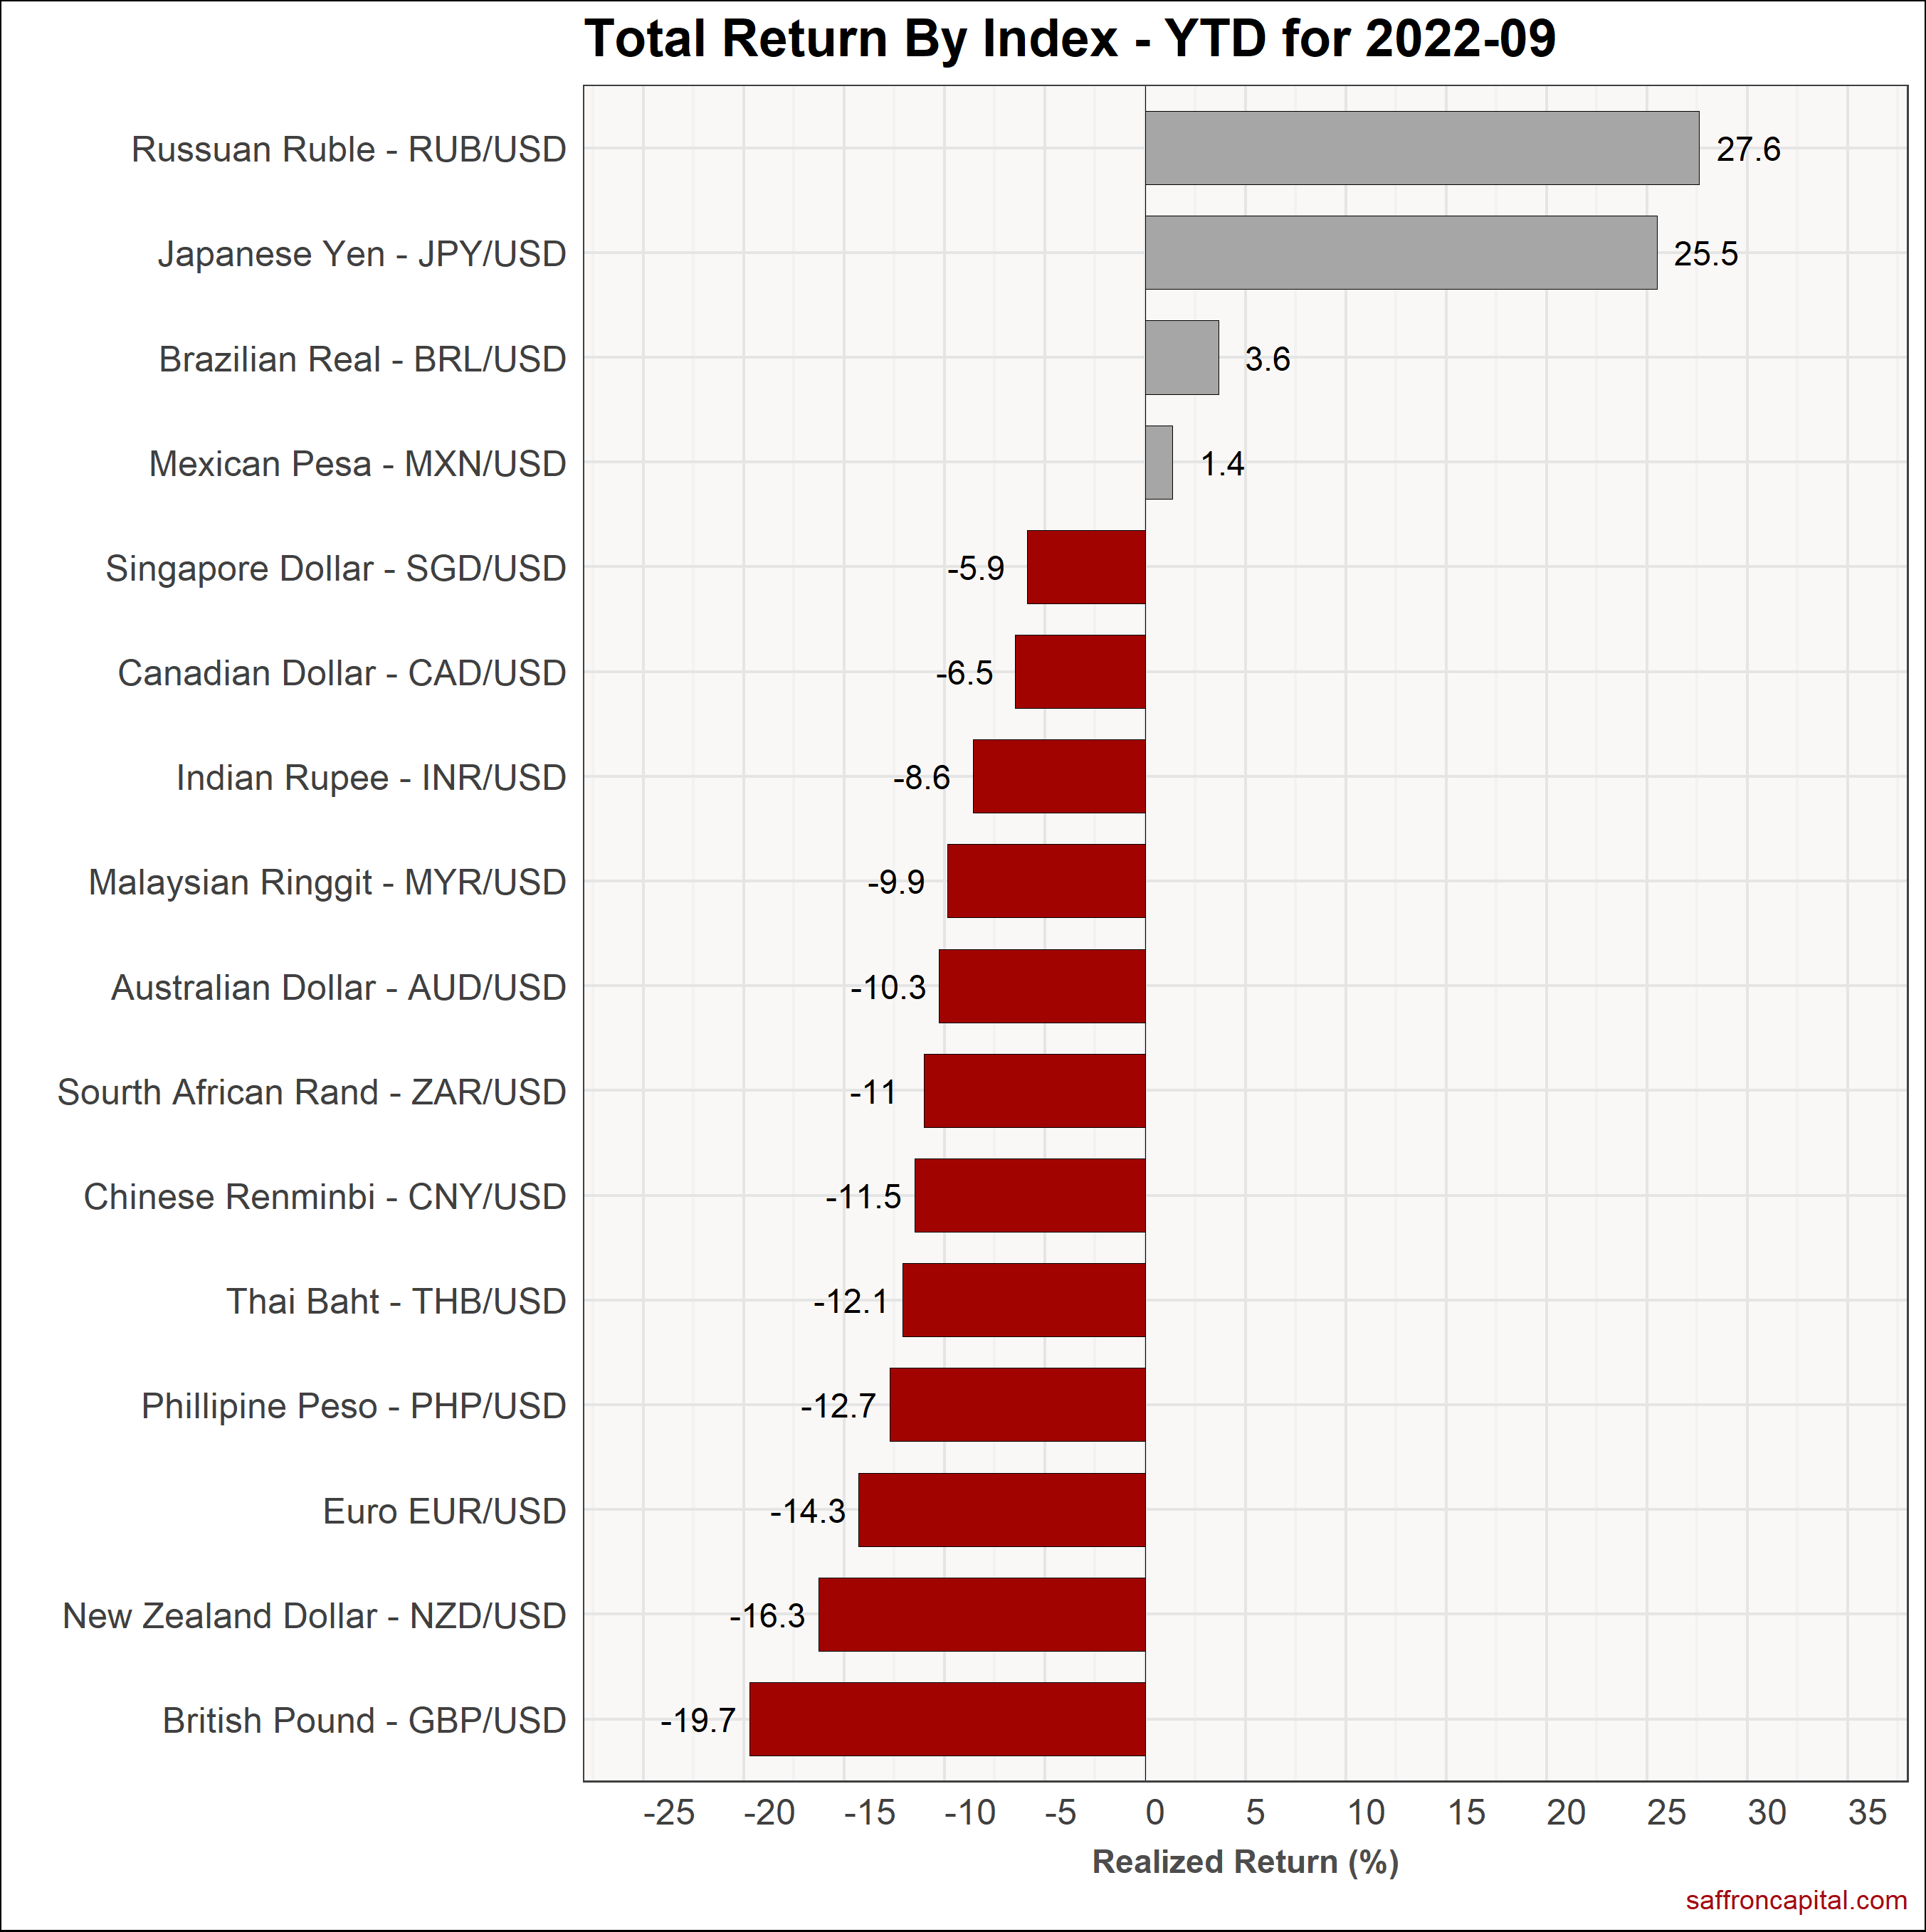
The US Dollar (+2.3%) rose in September and was led only by gains in the Japanese Yen (+4.1%). The Russian Ruble (+2.7%) also rose, while laggards included the British Pound (-7.1%), the NZ Dollar (-6.7%) and the Australian Dollar (-5.1%). Since January, the strongest currencies have been the Russian Ruble (+27.6%), the Japanese Yen (+25.5%) and the Brazilian Real (+3.6%).
Click to enlarge
Have questions about the performance and investment plan for your portfolio? Schedule a meeting with us here.


