Point Iroquois Lighthouse on the shores of Lake Superior is a public landmark located in the Hiawatha National Forest in the Upper Peninsula of Michigan.
Major Asset Classes
October 2022
Performance Comparison
Introduction
October returns benefited from a relief rally and expectations the pace of Fed rate increases might be slowing. For example, the S&P 500 index achieved a new low for the year at 3505, but then went on to post monthly gains close to 9%. Similarly, returns in developed and emerging markets were positive. Meanwhile, bond returns were also mixed. The short-end of the yield curve was up, while the back-end was down. At the same time, corporate issues did significantly better than Treasuries with high yield bonds, REITs, and project infrastructure bonds all posting solid returns. Finally, the US Dollar trended down into the end of the month, supporting positive returns across most commodities.
The following analysis provides a visual record of October returns across and within the major asset classes.
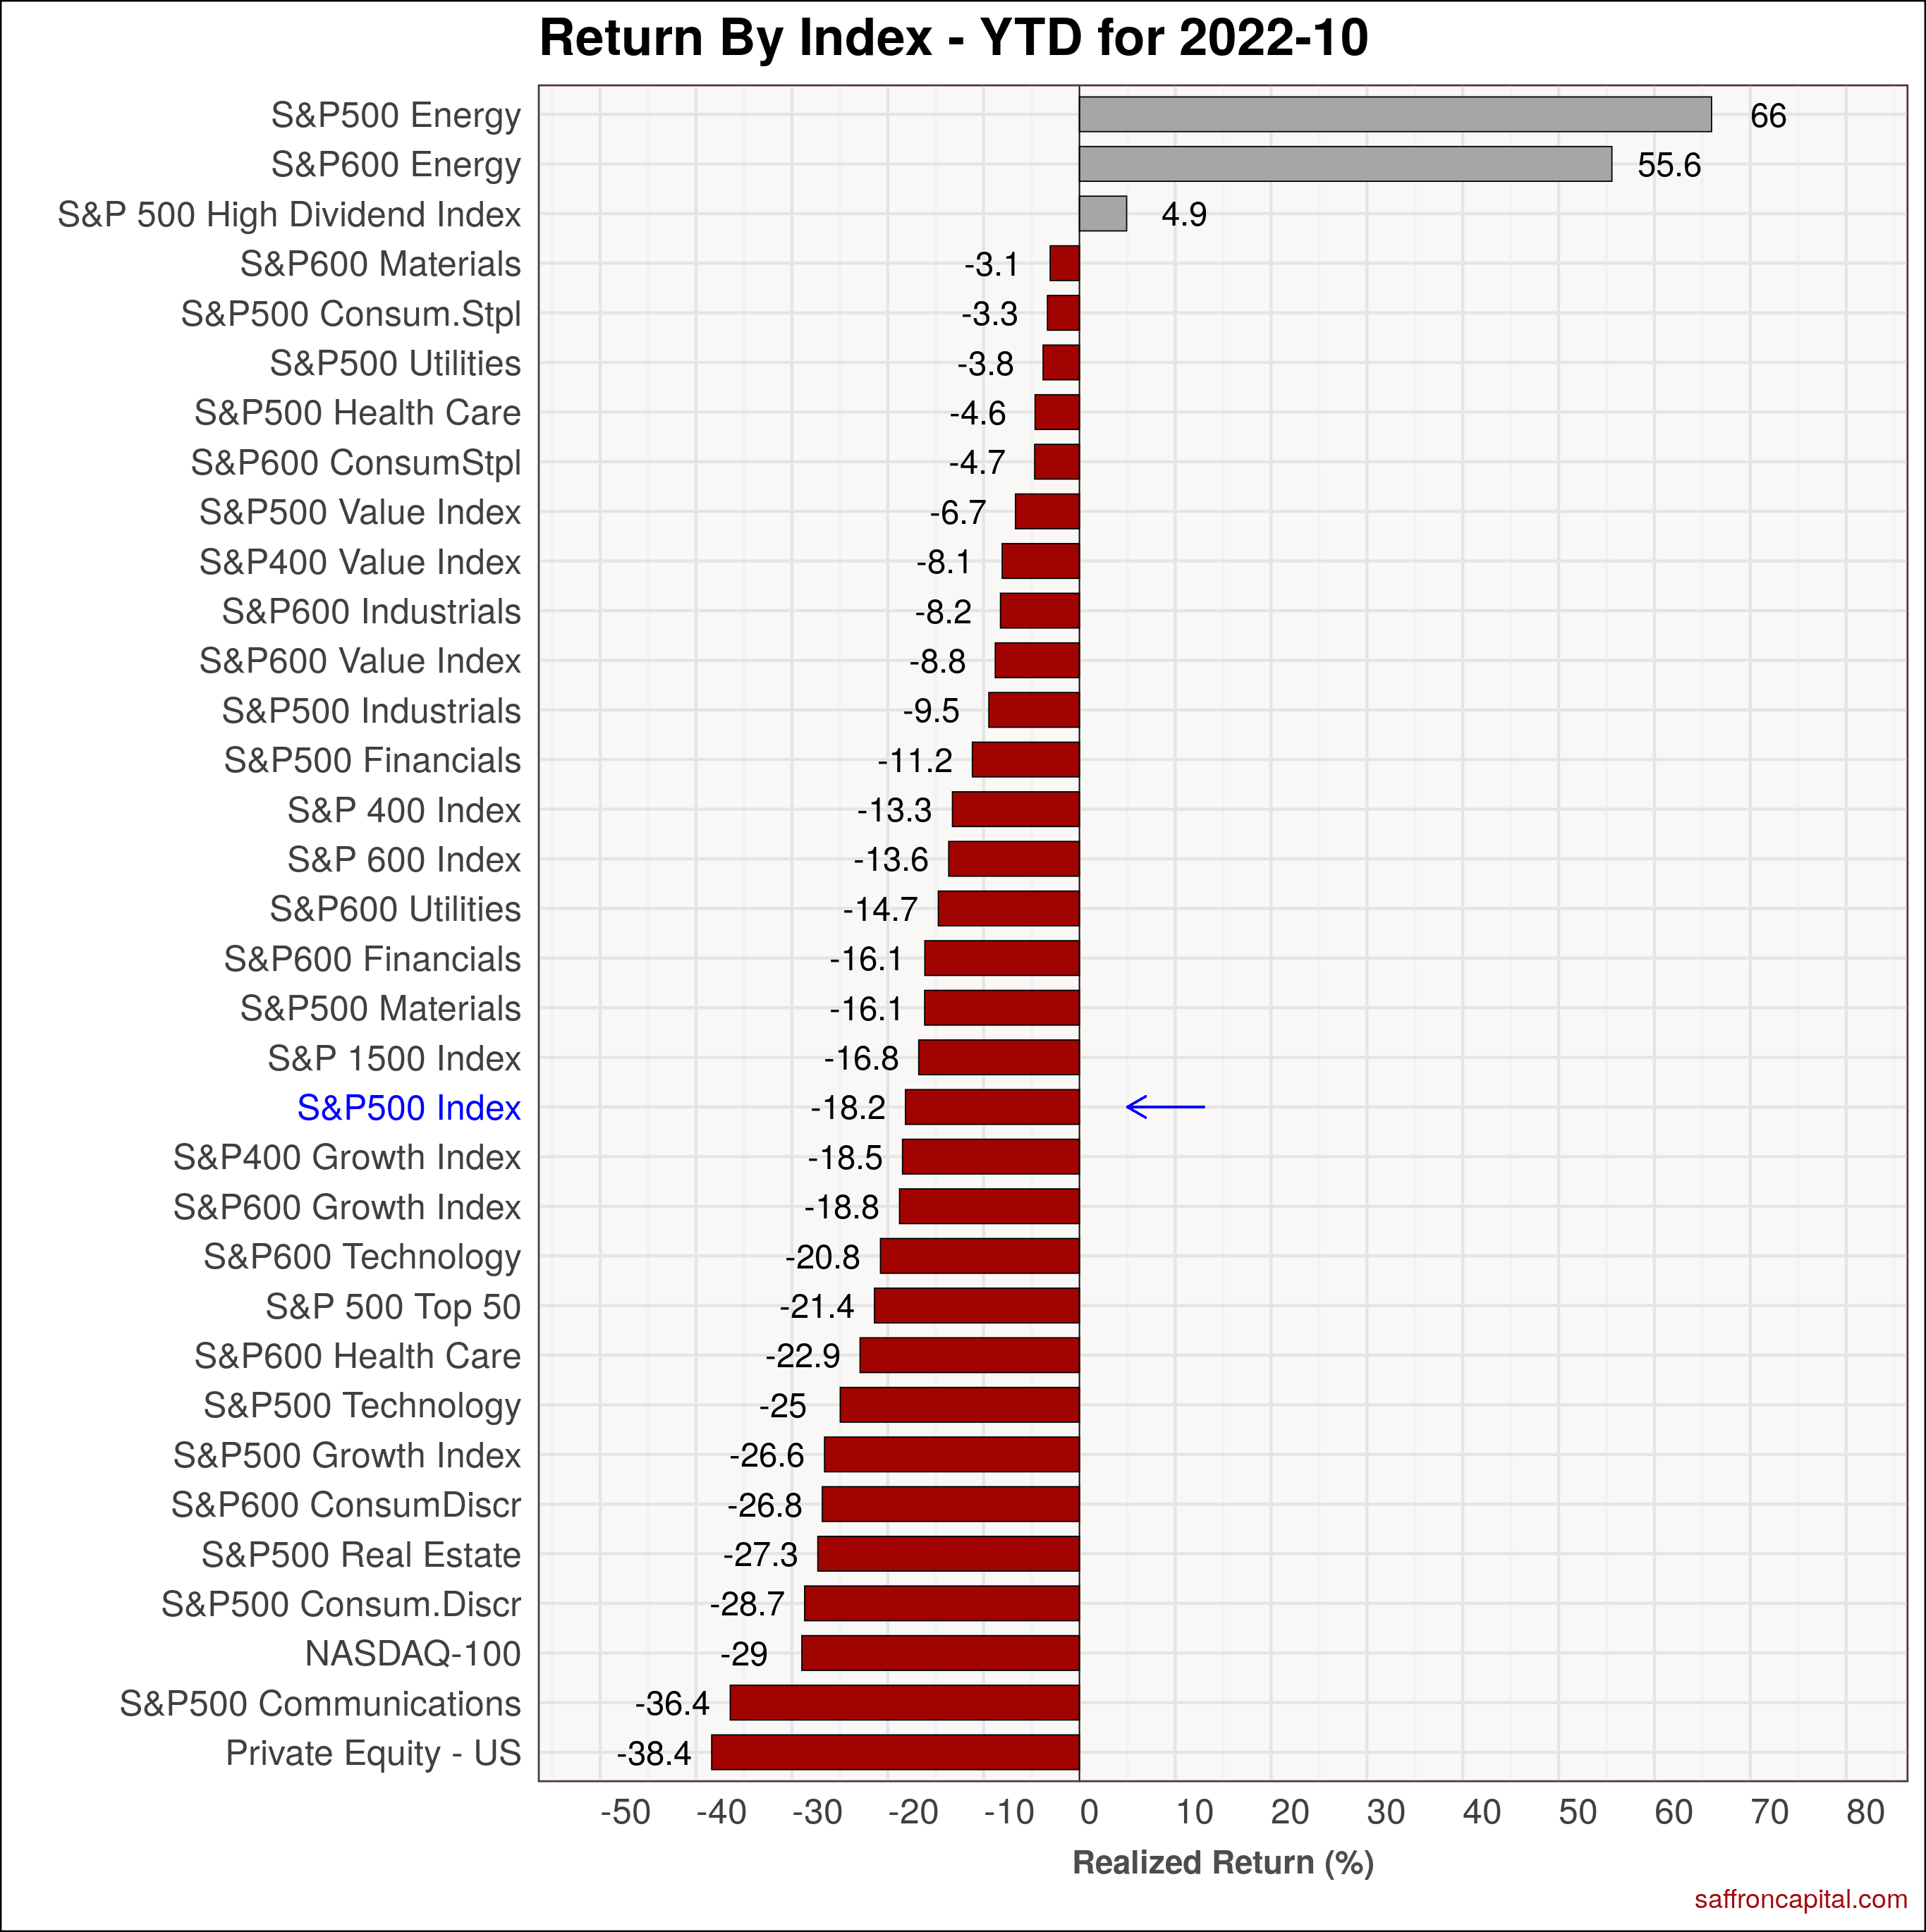
US Equities
September returns for the large cap S&P 500 index (+8.8%) more than offset losses from the prior month. Equities benefited from strong returns in large cap Energy (+26.2%), small cap Energy (+23.9%), and small cap Industrials (+15.5%). Strong performance was also evident in the S&P 500 High Dividend Index (+13.1%) and in Value stocks (+12%). Notably, every sector had positive returns in October. On a year-to-date (YTD) basis, the benchmark S&P 500 index (-18.2%) remains weak. Losses are most evident in private equity (-38.4%), communications (-36.4%), technology (-27.6%), and real estate (-29.6%) sectors. The top performers since January are large cap energy (+66.0%), small cap Energy (+55.6%), and high dividend stocks (+4.9%).
Click to enlarge
Developed Market Equities
Elsewhere, developed market equities were also positive. Specifically, the S&P Developed Markets index (+6.9%) lagged the S&P 500 index by 190 bps. Markets in Ireland (+13.9%), Italy (+12.9%) and France (+12.6%) topped the leaders list and outperformed US equities. In contrast. Hong Kong (-10.3%), Singapore (+0.3%), and Japan (+2.9%) had the weakest returns. On a year to date basis, the S&P Developed Markets index (-22.0%) trails US equities by 380 basis points. Like US equities, every developed market is in the red since January.
Click to enlarge
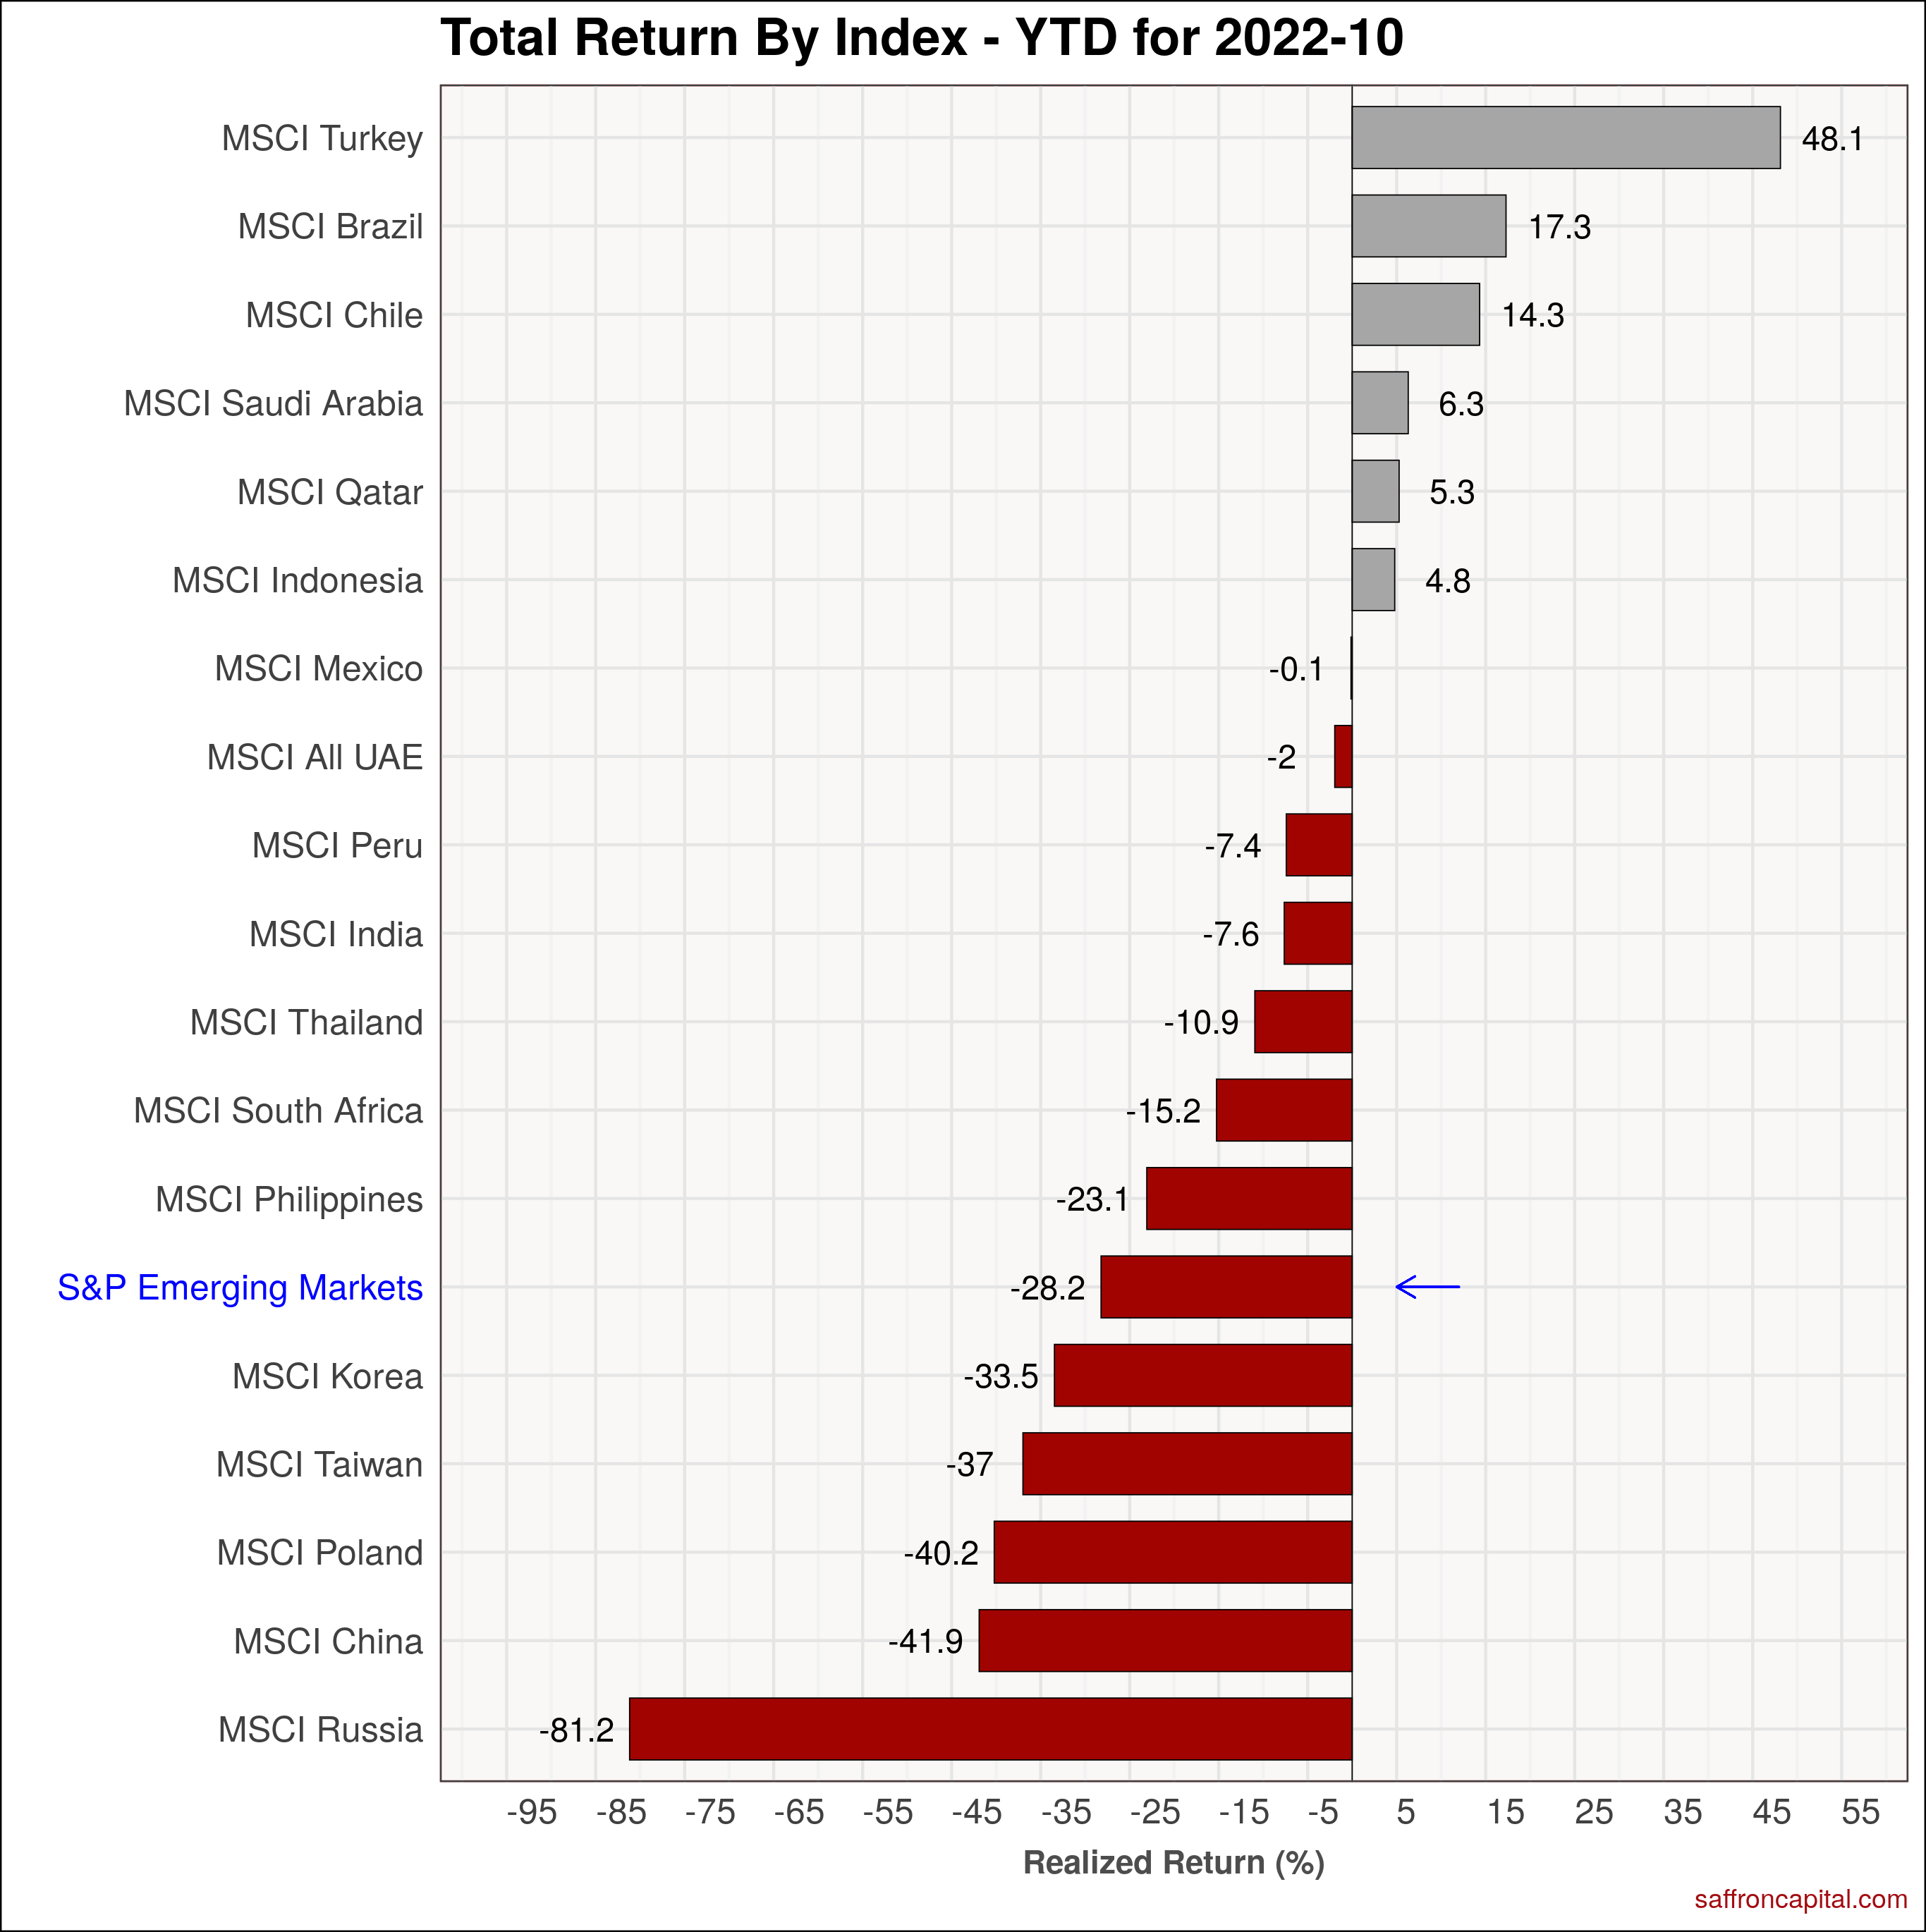
Emerging Market Equities
The S&P Emerging Markets Index (-1.2%) trailed the developed and US markets in September. The strongest stock markets were in Turkey (+21.2%), Poland (+15.9%) and Mexico (+12.5%). Meanwhile, India (+3.8%) continued to beat the emerging market index and trailed U.S. equities in October. China (-14.8%). Taiwan (-2.6%) and Qatar (-1.2%), fell the hardest. On a year to date basis, the S&P Emerging Market index (-28.2%) remains solidly down and is now lagging developed markets significantly given weakness in Asia.
Click to enlarge
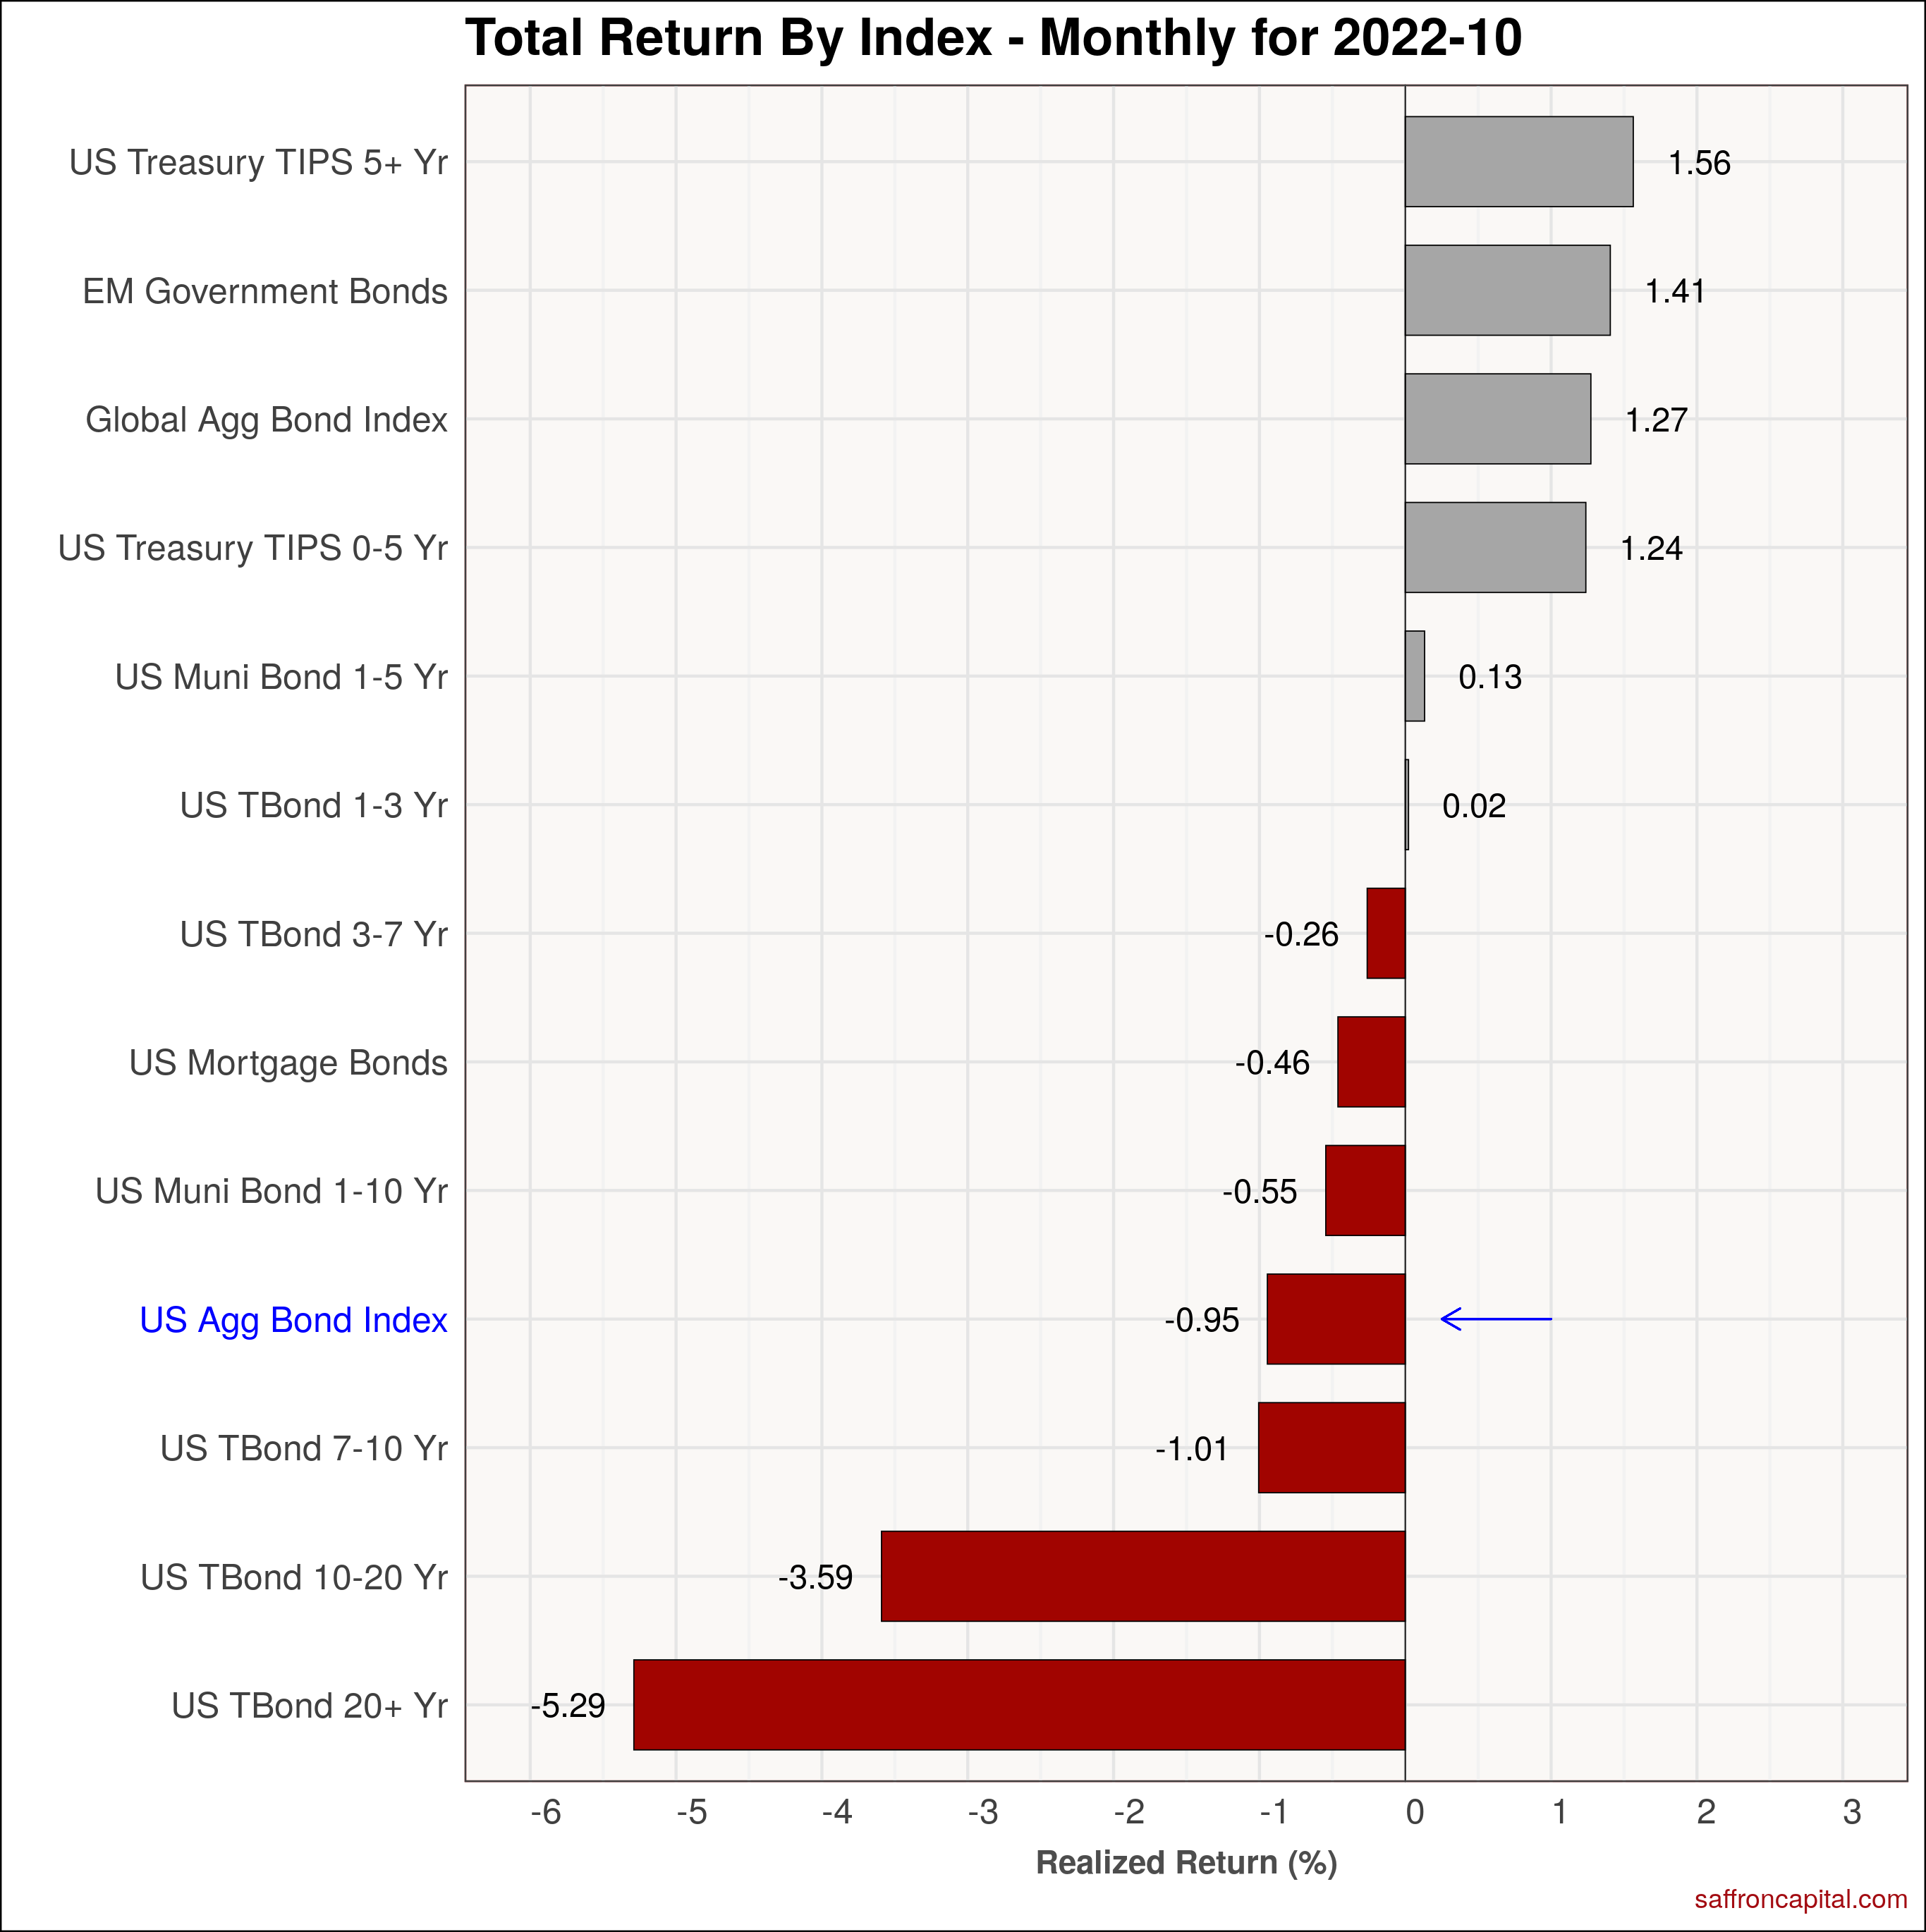
Government Bonds
October returns for government bond markets had modest declines as seen in the U.S. Aggregate Bond Index (-0.95%). At the same time, sovereign bonds for emerging (+1.41%) and developed (+1.27%) economies had modest gains. US Treasuries expiring in 1-3 years were flat, while the belly of the curve expiring 7 years forward (-0.95%) had modest losses. Long dated Treasuries (-5.29%) were clobbered. On a year-to-date basis, the US aggregate Bond index (-1519%) is subject to ongoing pressure and is being pulled down by long duration 20 year plus treasuries (-33.62%) and Treasuries maturing 10 to 20 years (-28.21%).
Click to enlarge
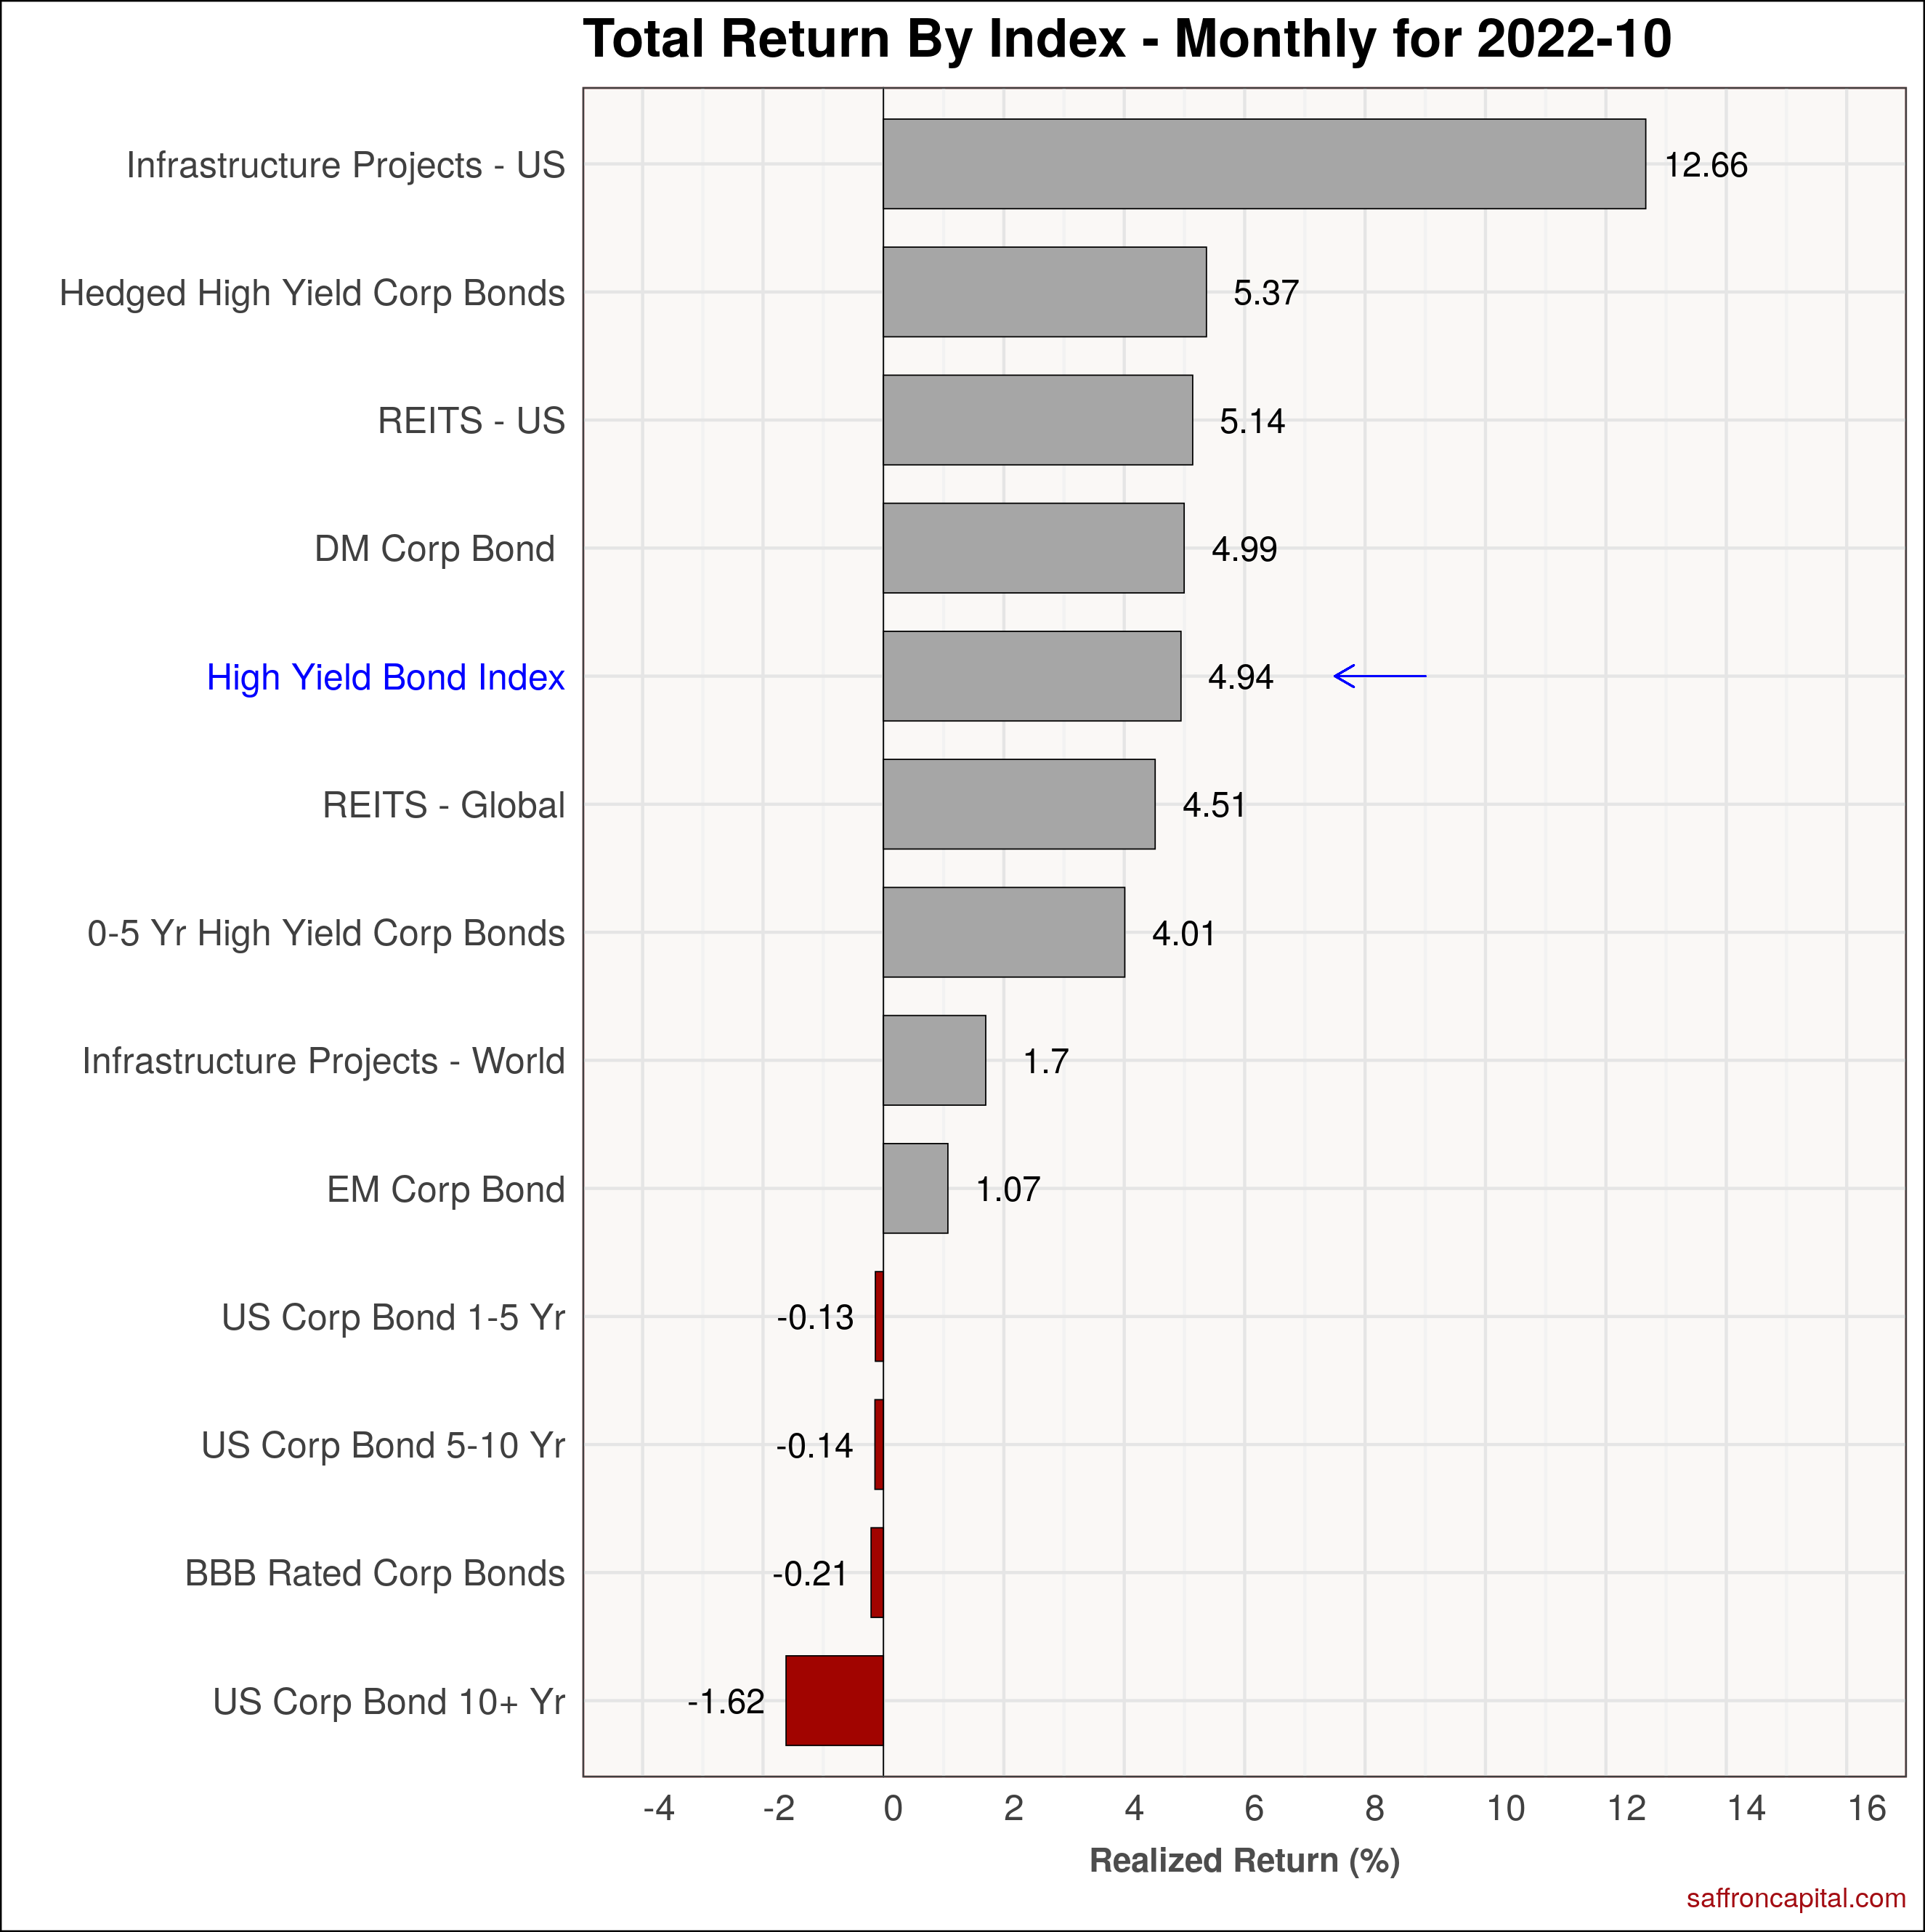
Corporate & Infrastructure Bonds
US infrastructure bonds (+12.66%) had another strong month after being subject to heavy selling early in the month. Similarly, High Yield Corp Bonds (+5.37%) also had solid gains. Finally, US REITS (5.14%) benfited from end of the month buying given the prospect for a slower pace of interest rates increases going in the future. Long-dated corporate bonds (-1.62%) was the weakest portfolio. On a year-to-date basis, the benchmark high yield index (-11.86%) is weak, but still proving to be more durable than US equities.
Click to enlarge
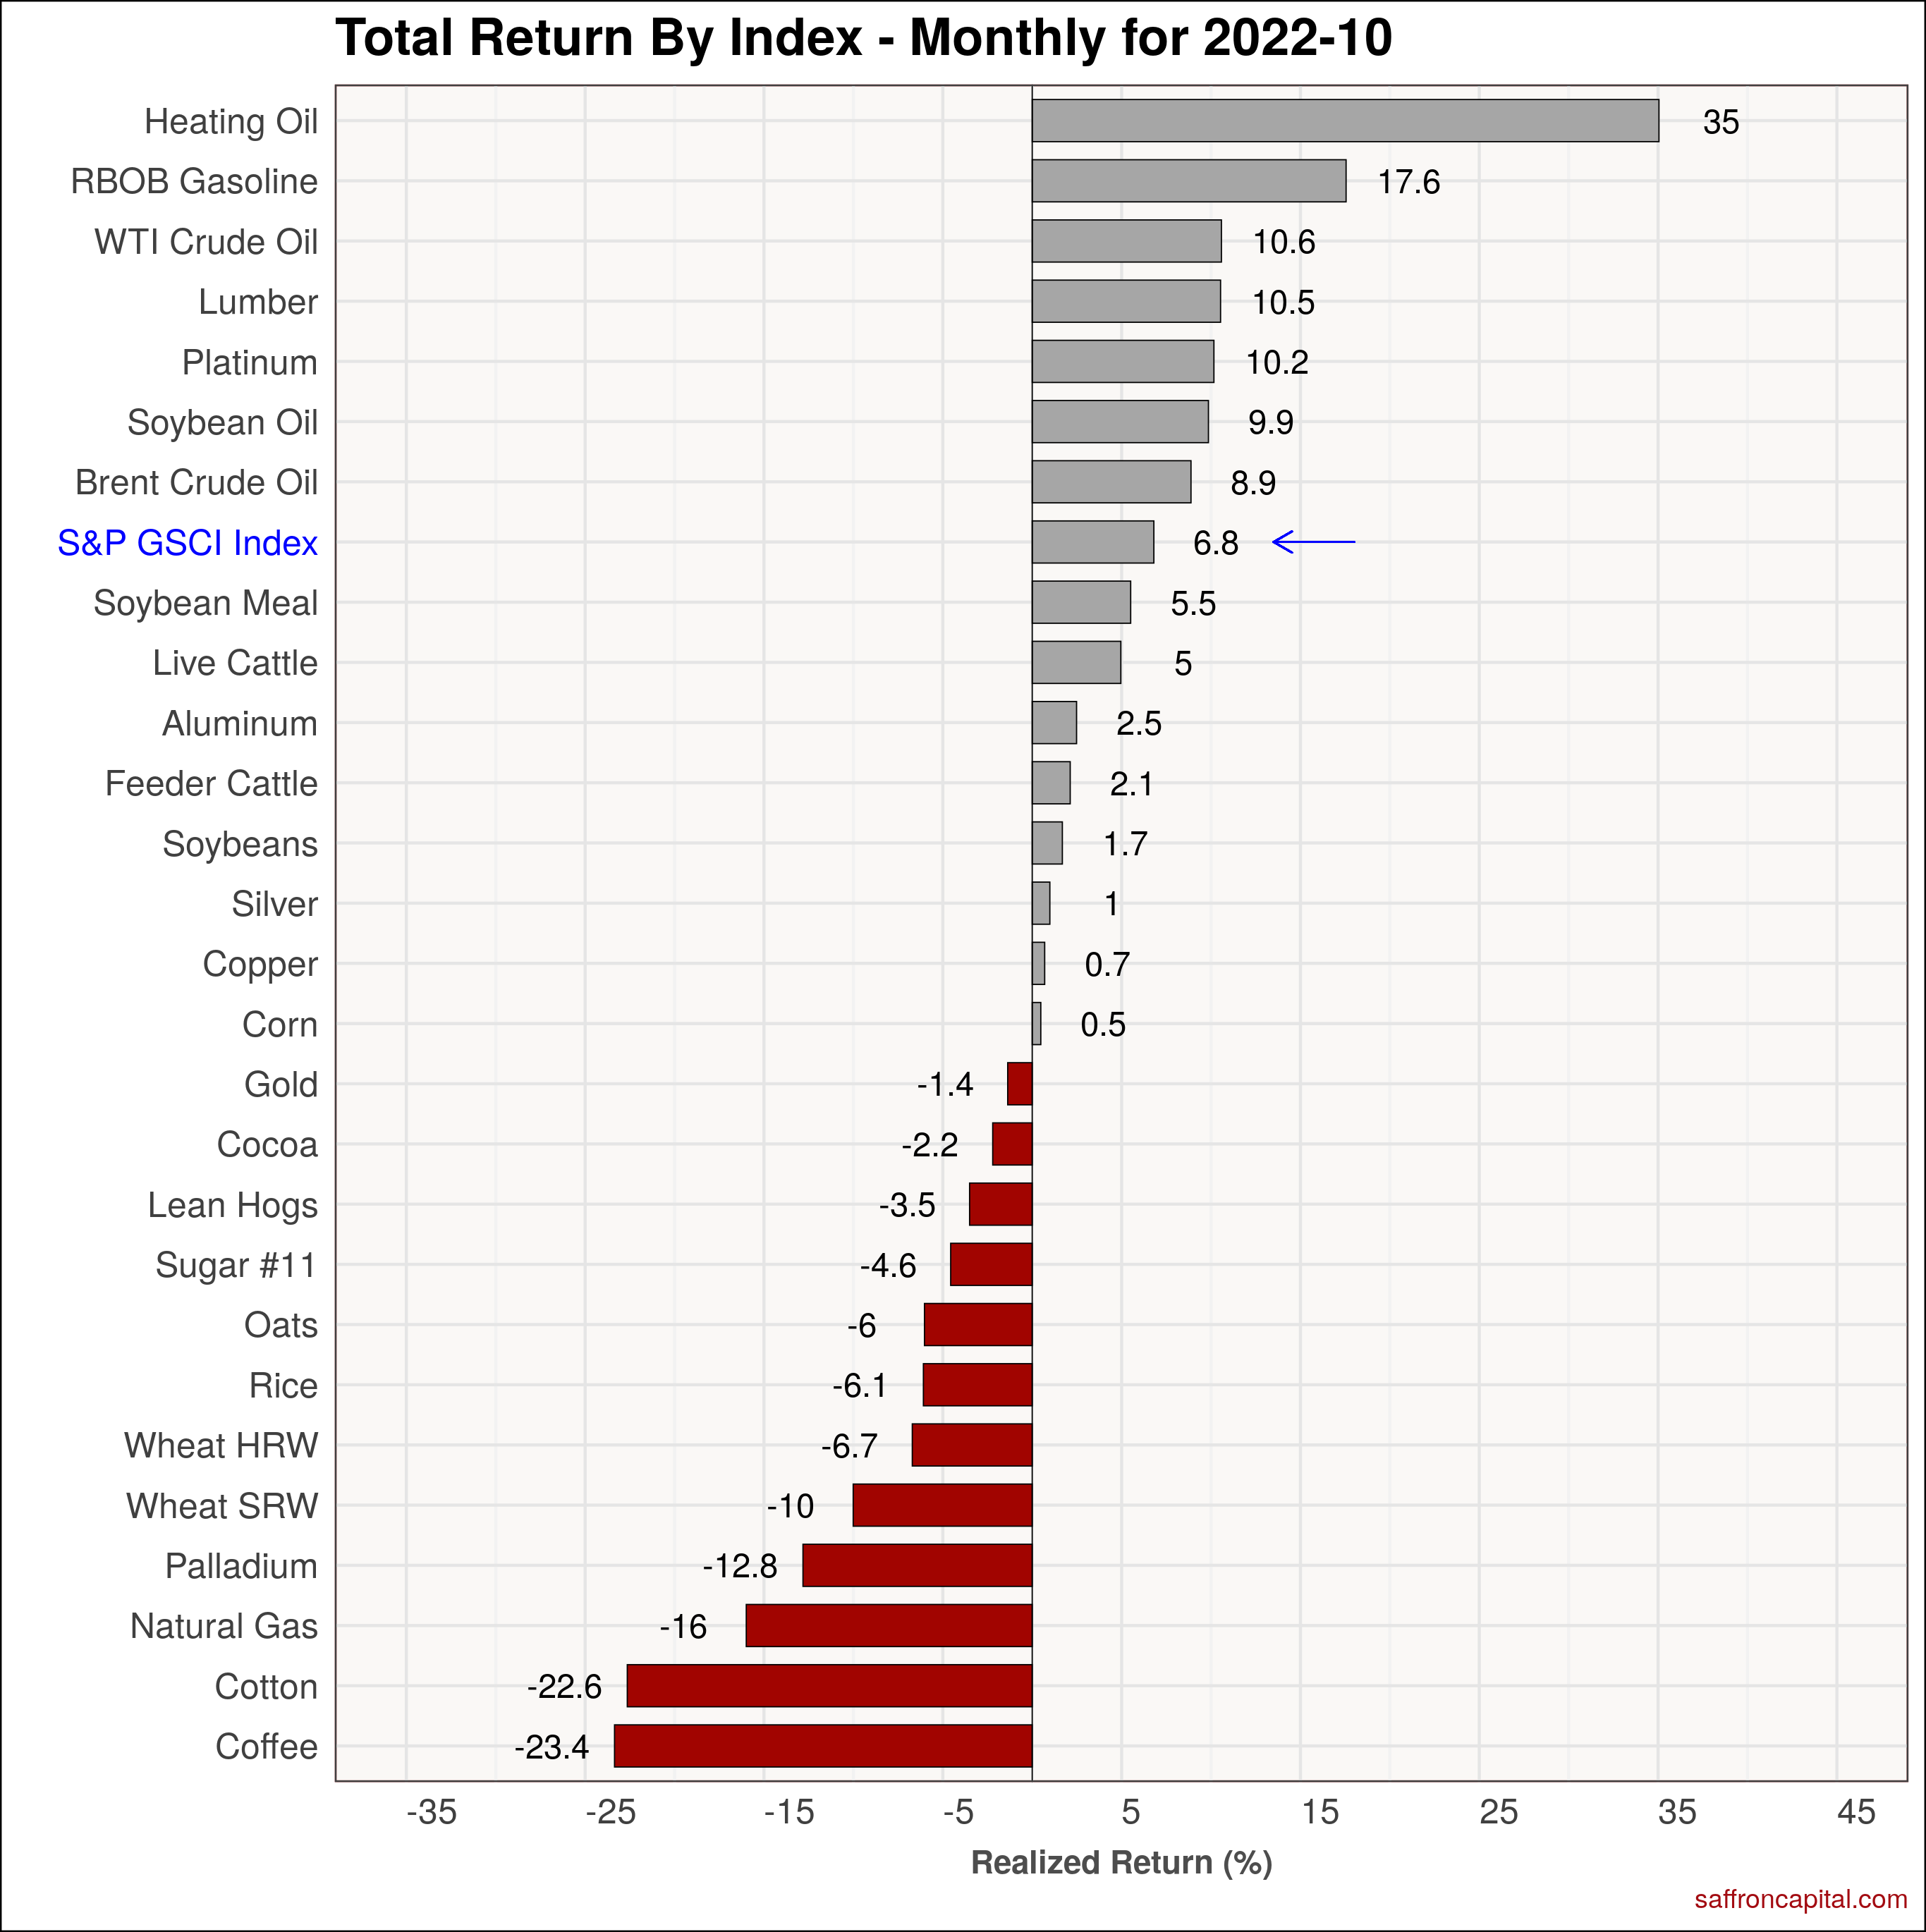
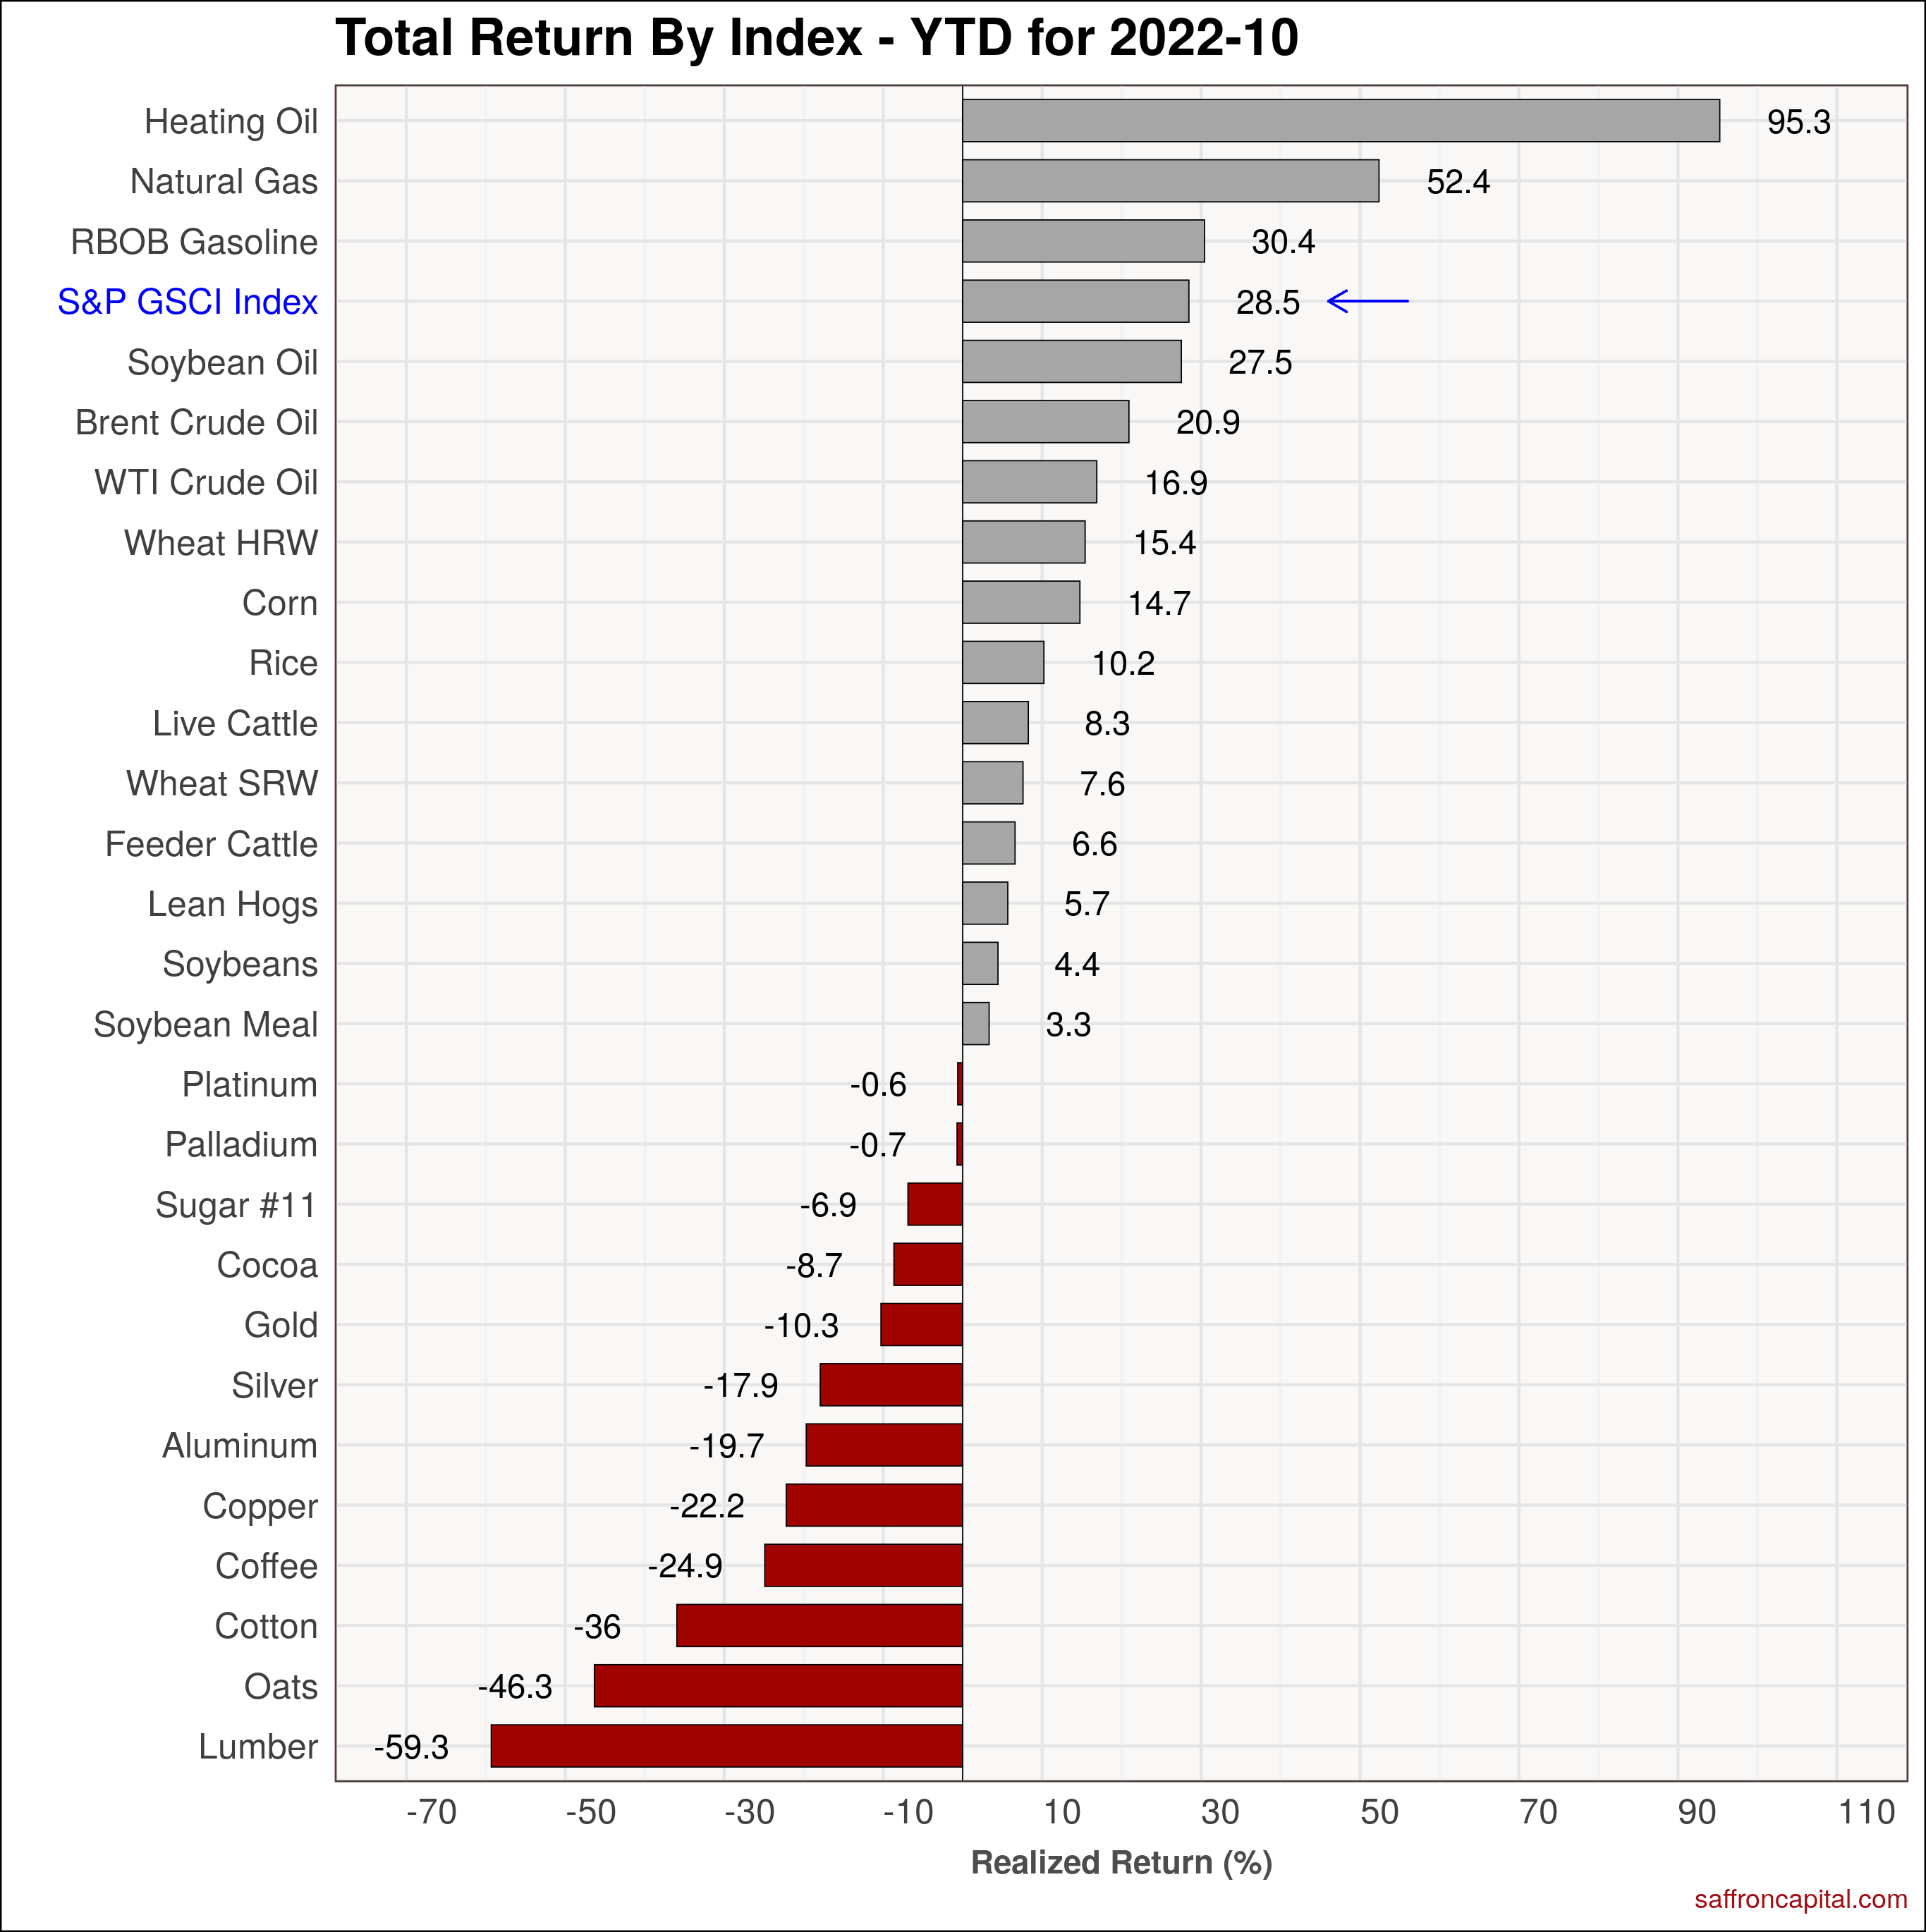
Commodities
October returns for commodities were positive for the most part. The S&P GSCI index (+6.8%) benefited from string gains in heating oil (+35.0%), Gasoline (+17.6%) and WTI crude oil (+10.6%). Moreover, the high dollar has raised demand concerns for a number of commodities, including coffee (-23.4%), cotton (-22.6%), and natural gas (-16.0%). Since January, The strongest performing commodities include heating oil (+95.3%), natural gas(+52.4%), and gasoline (+30.4%).
Click to enlarge
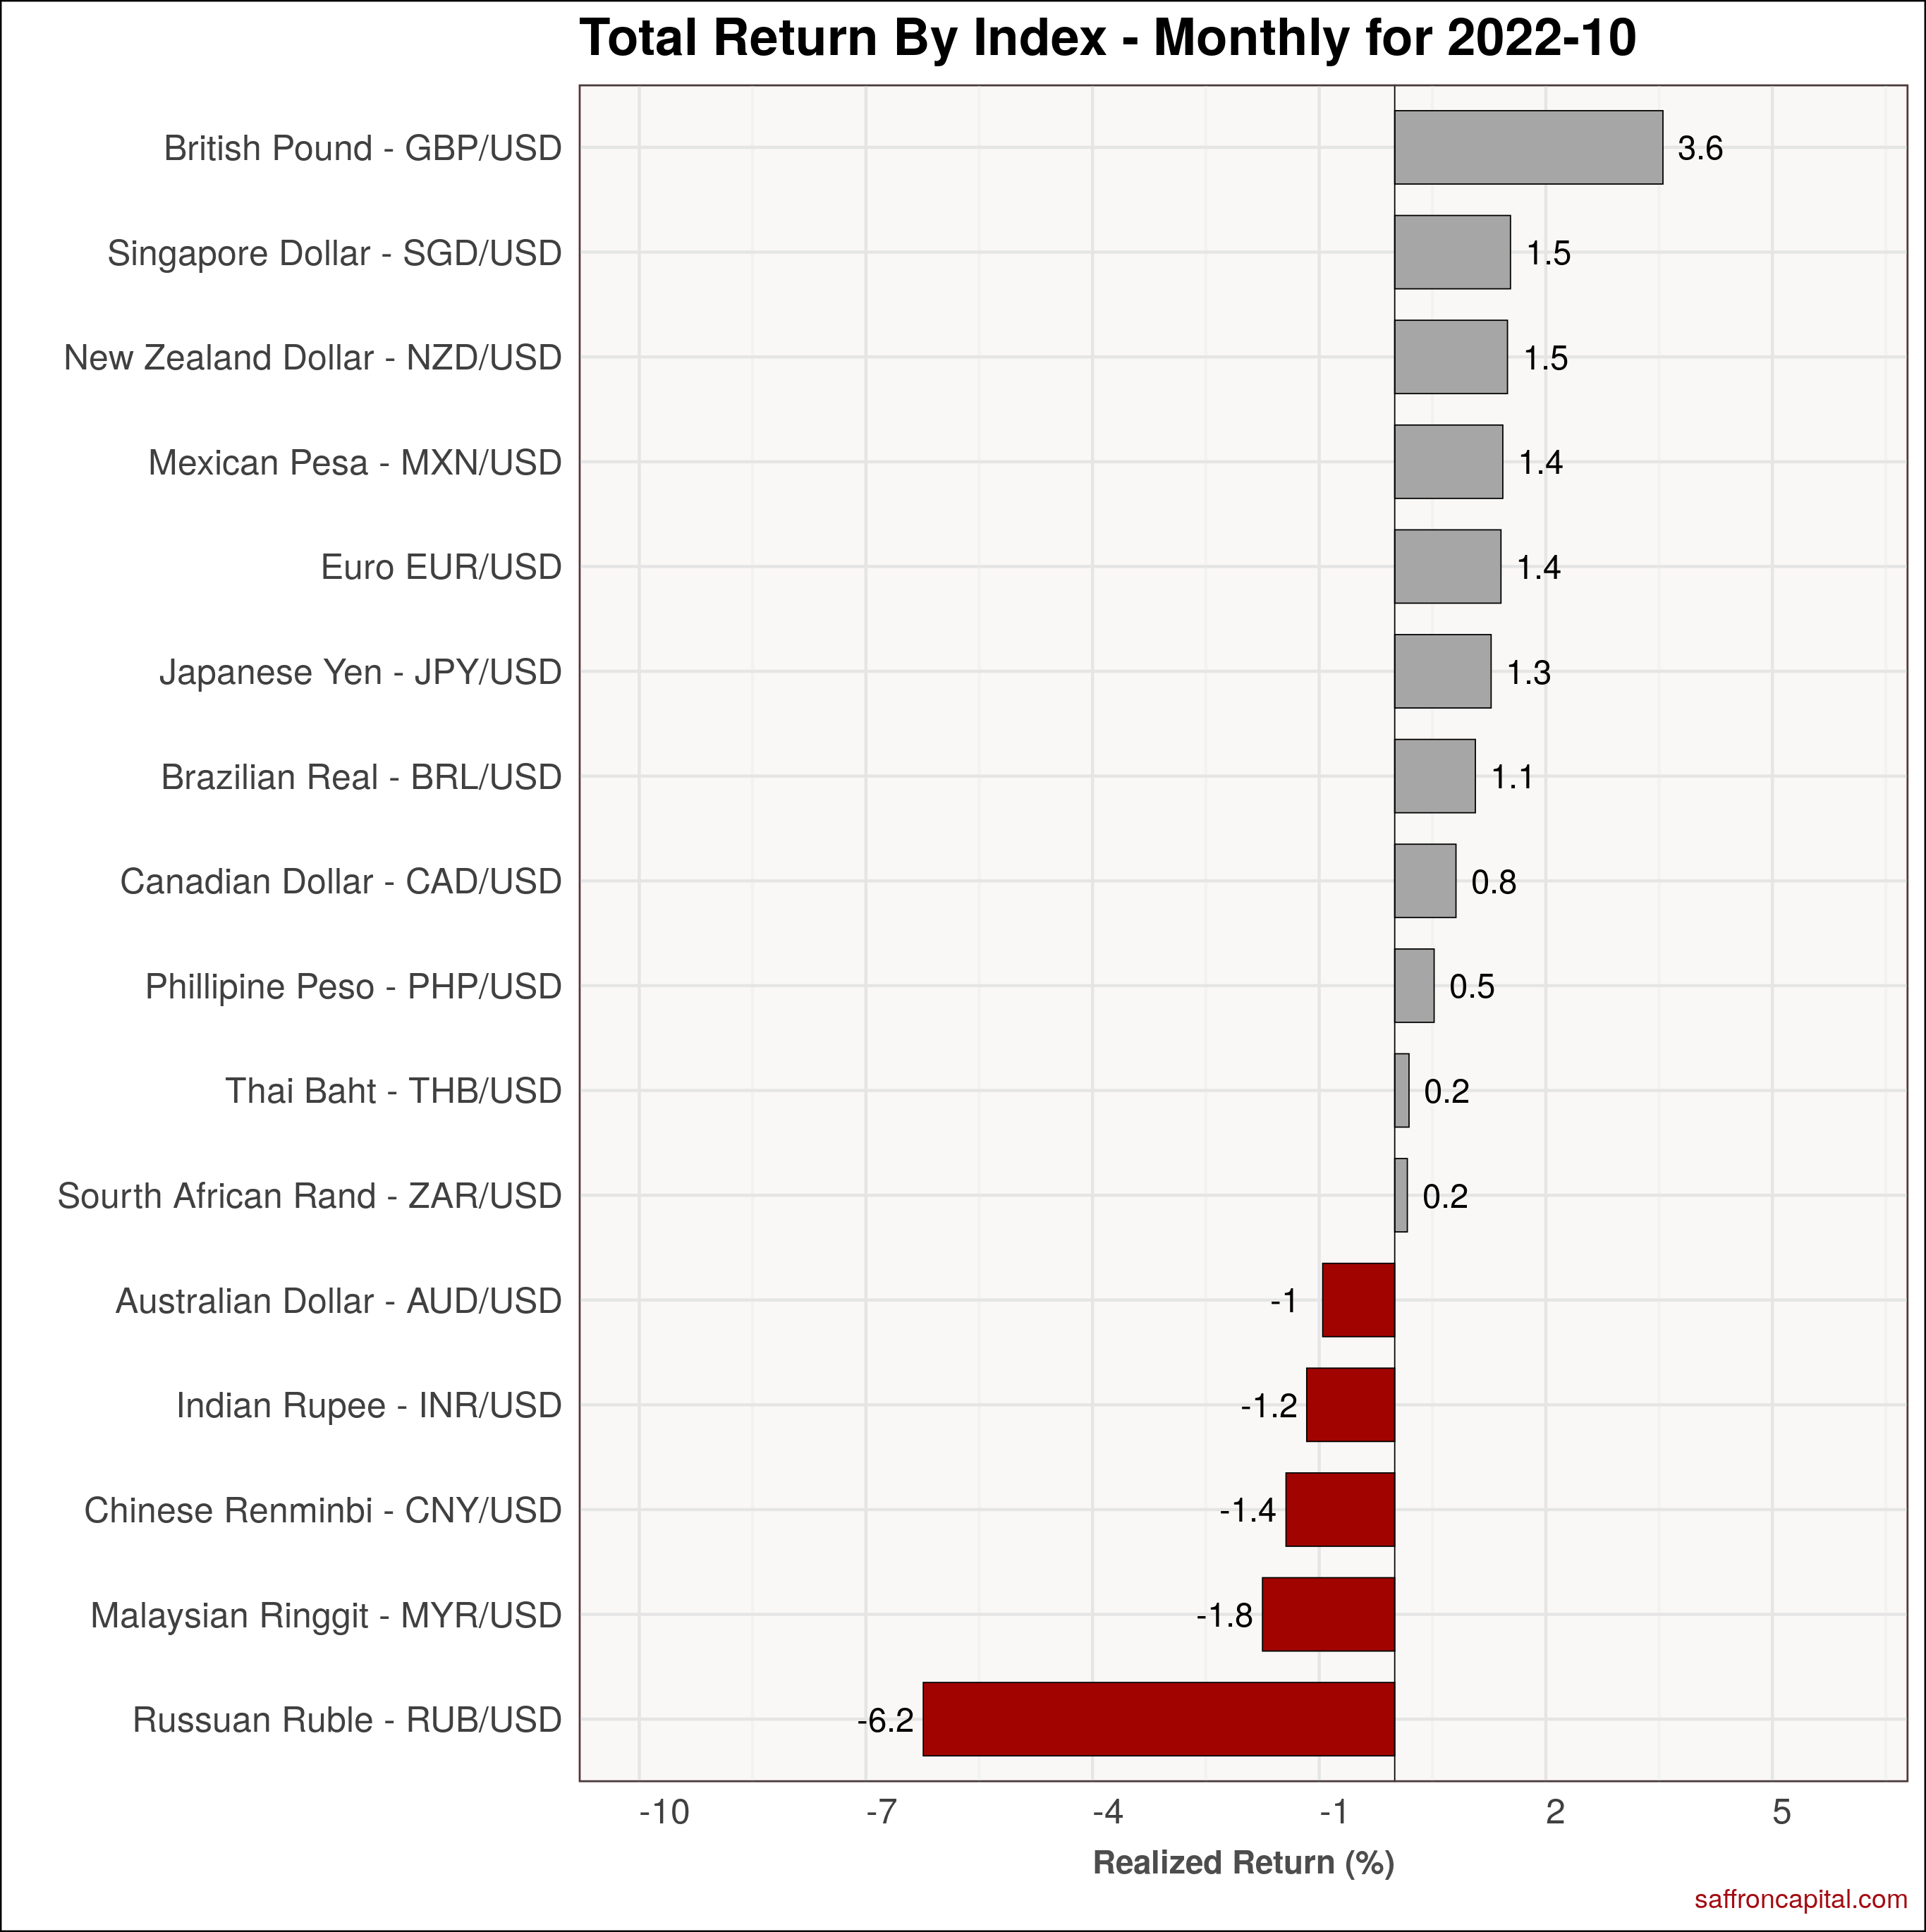
Currencies
The US Dollar (+0.57%%) rose slightly in October, after strong losses initially in October. Gains were lead by the British Pound (+3.6%) and the Singapore Dollar (+1.5%). The Russian Ruble (-6.2% was the hardest hit currency, followed by the Malasian Ringit *-1.8%) and the Chinese Renminbi (-1.4%). Since January, the strongest currencies have been the Japanese Yen (+27.1%) and the Russia Ruble (+21.6%).
Click to enlarge
Have questions about the performance of your portfolio? Schedule a meeting with us here.


