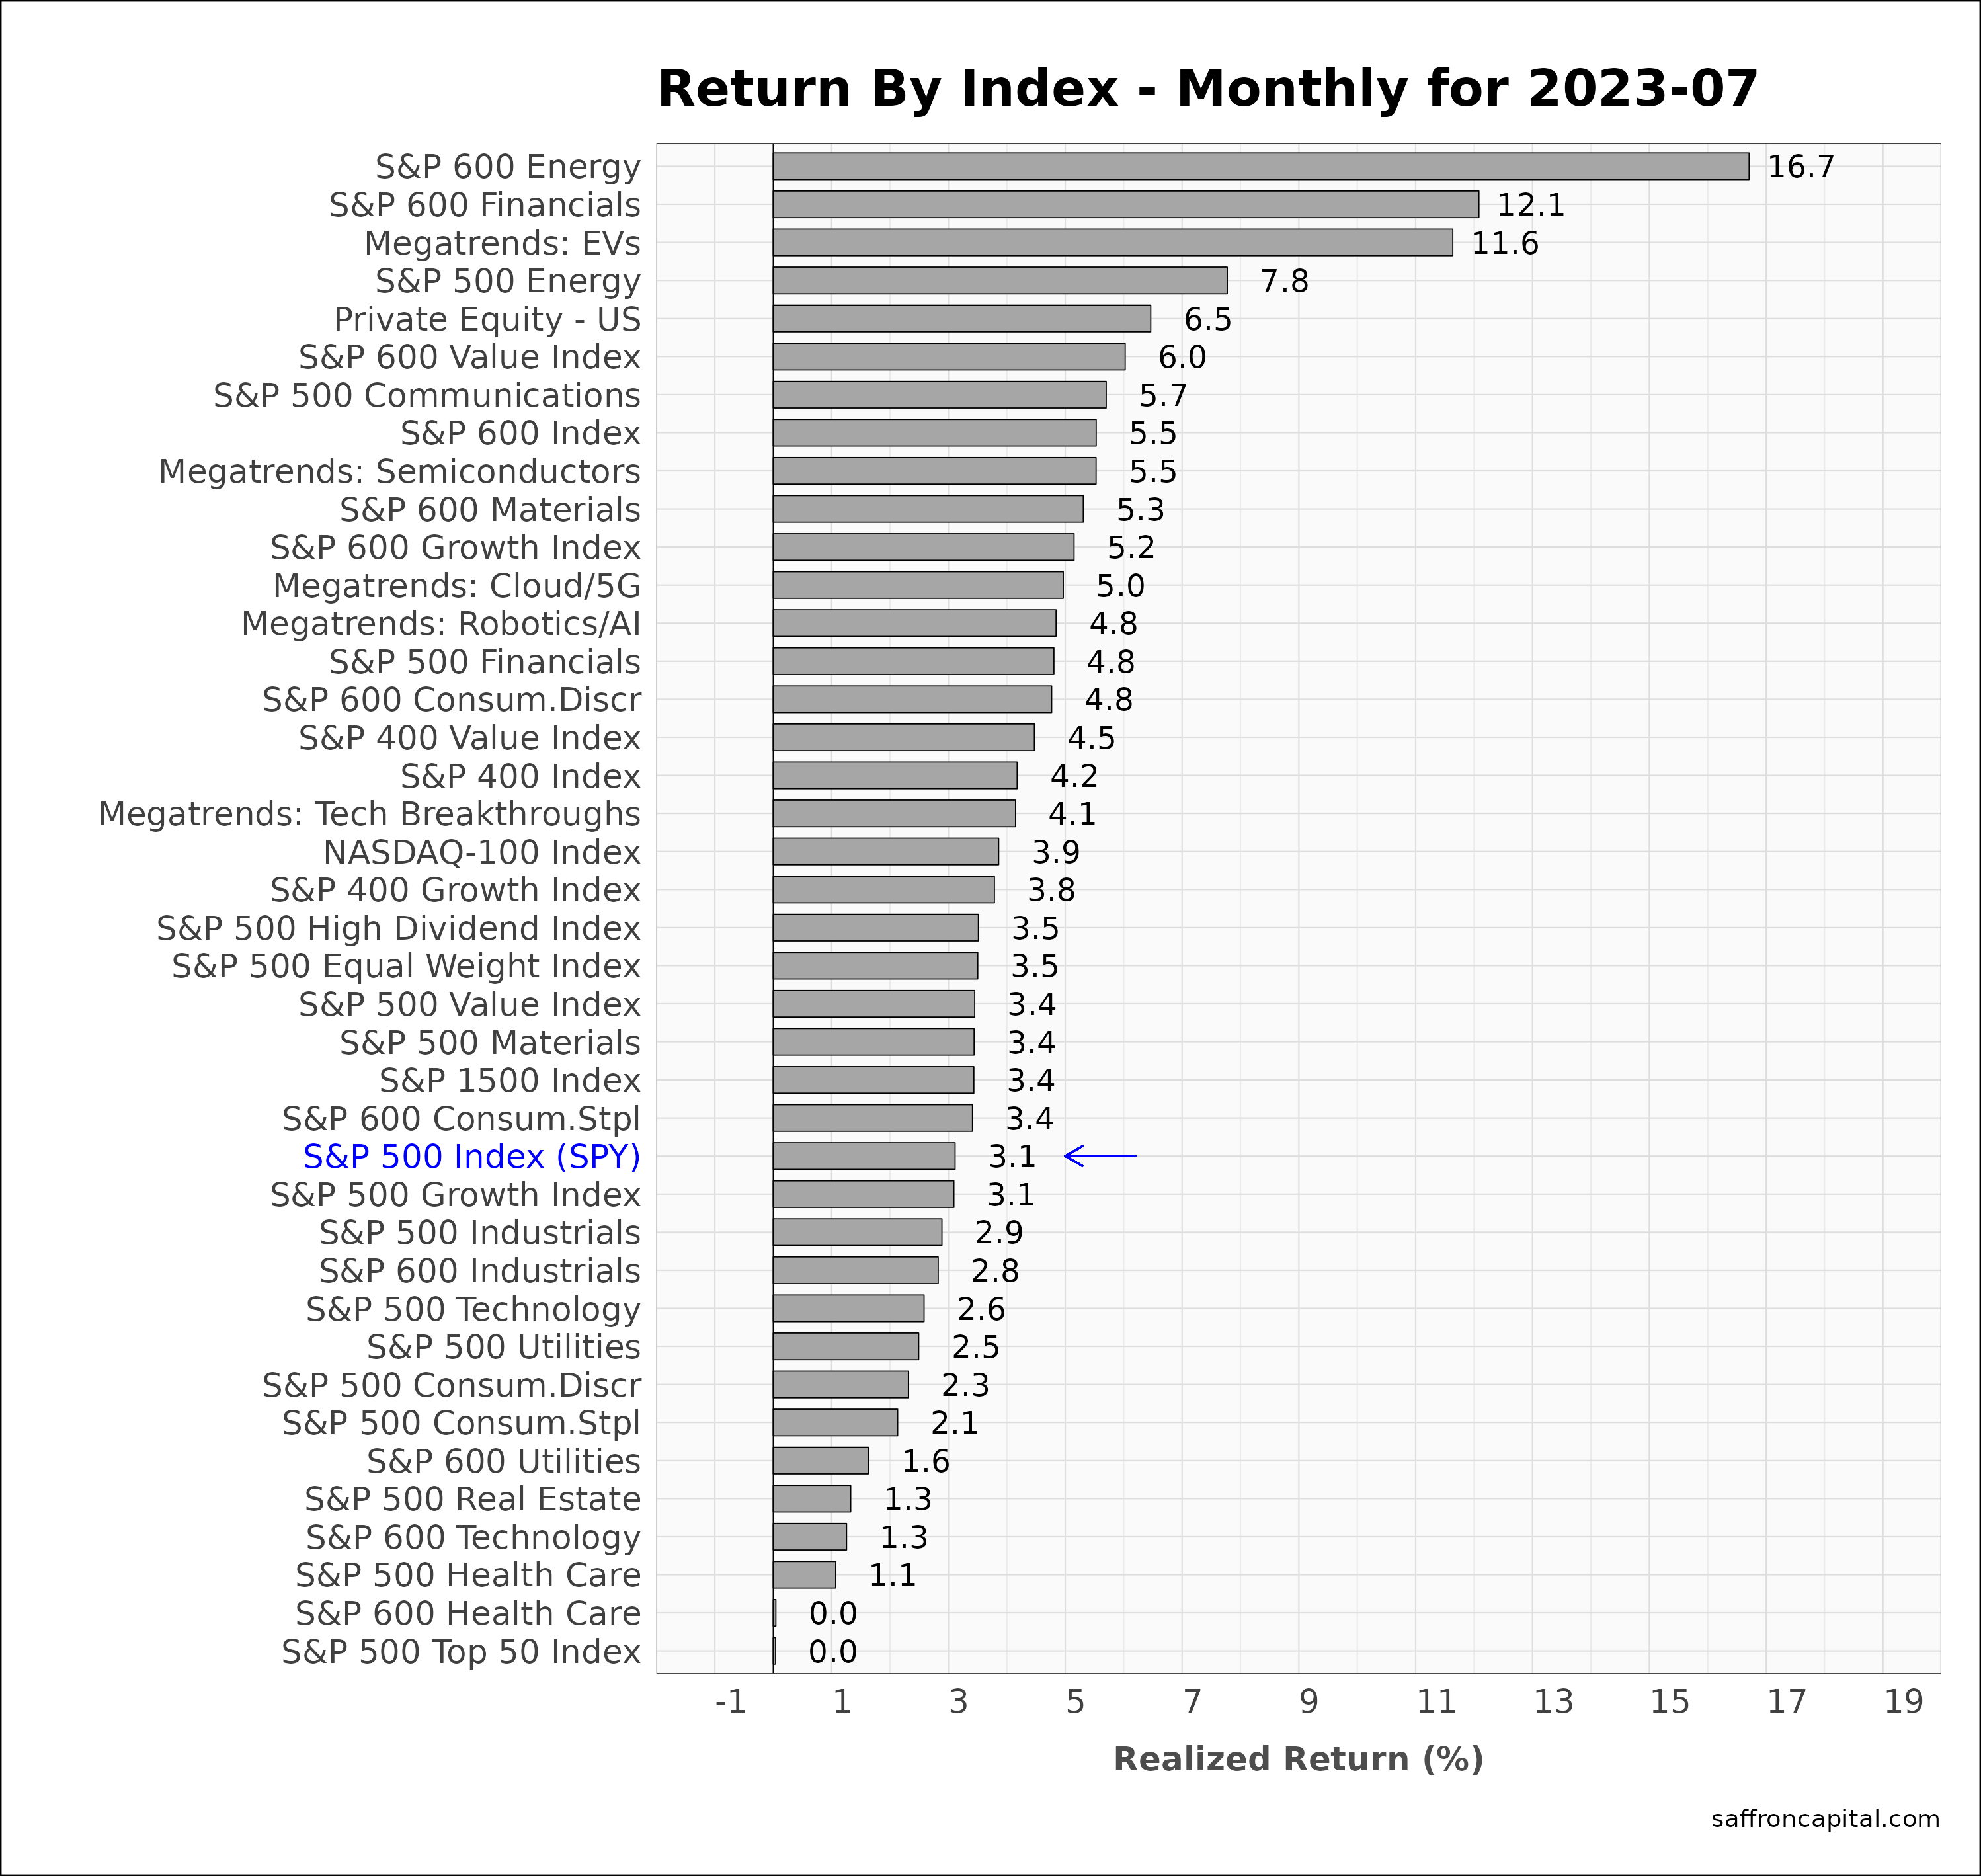
July 2023 returns added to gains seen in June, logging the 5th straight month of gains. The S&P 500 index was up +3.1% in July and the NASDAQ 100 index up +3.9%, buoyed by resilient GDP growth and a drop in developed market inflation. In a sign of strong market internals, the small cap S&P 600 Index (+5.5%) and the mid cap S&P 400 Index (+4.2%) both outperformed large cap shares. Meanwhile, US fixed income markets were under pressure with long duration bonds (-2.54%) down significantly on reduced likelihood for recession. In comparison, the iBOXX corporate bond index (+1.66%), and US infrastructure bonds (+3.35%) fared much better. Finally, commodity prices (+10.8%) were notably higher, though lagging inflation indicators were down. Jet fuel (+22.2%) and gasoline (+11.2%) lead the markets, while grain prices like Corn (-9.1%) were down.
The following analysis provides a visual record of July 2023 returns across and within the major asset classes.
US Equities
The S&P 500 index ends July 19.5% year-to-date (YTD), while the NASDAQ 100 index is up an astounding 44.5% since January. In comparison, the S&P 500 Equal Weight Index is up +10.7%. Top performing sectors in July included small cap Energy (+16.7%), small cap Financials (+12.1%) and Megatrend EVs (+11.6%). At the same time, strength in large cap shares was defined by Energy (+7.8%), Communication Services (5.7%) and Financial (4.8%) sectors. Defensive sectors continues to lag the index in July, including Health Care (+1.1%), Real Estate (+1.3%) and Consumer Staples (+2.1%). Red ink was notably absent across the major indices.
Click to enlarge
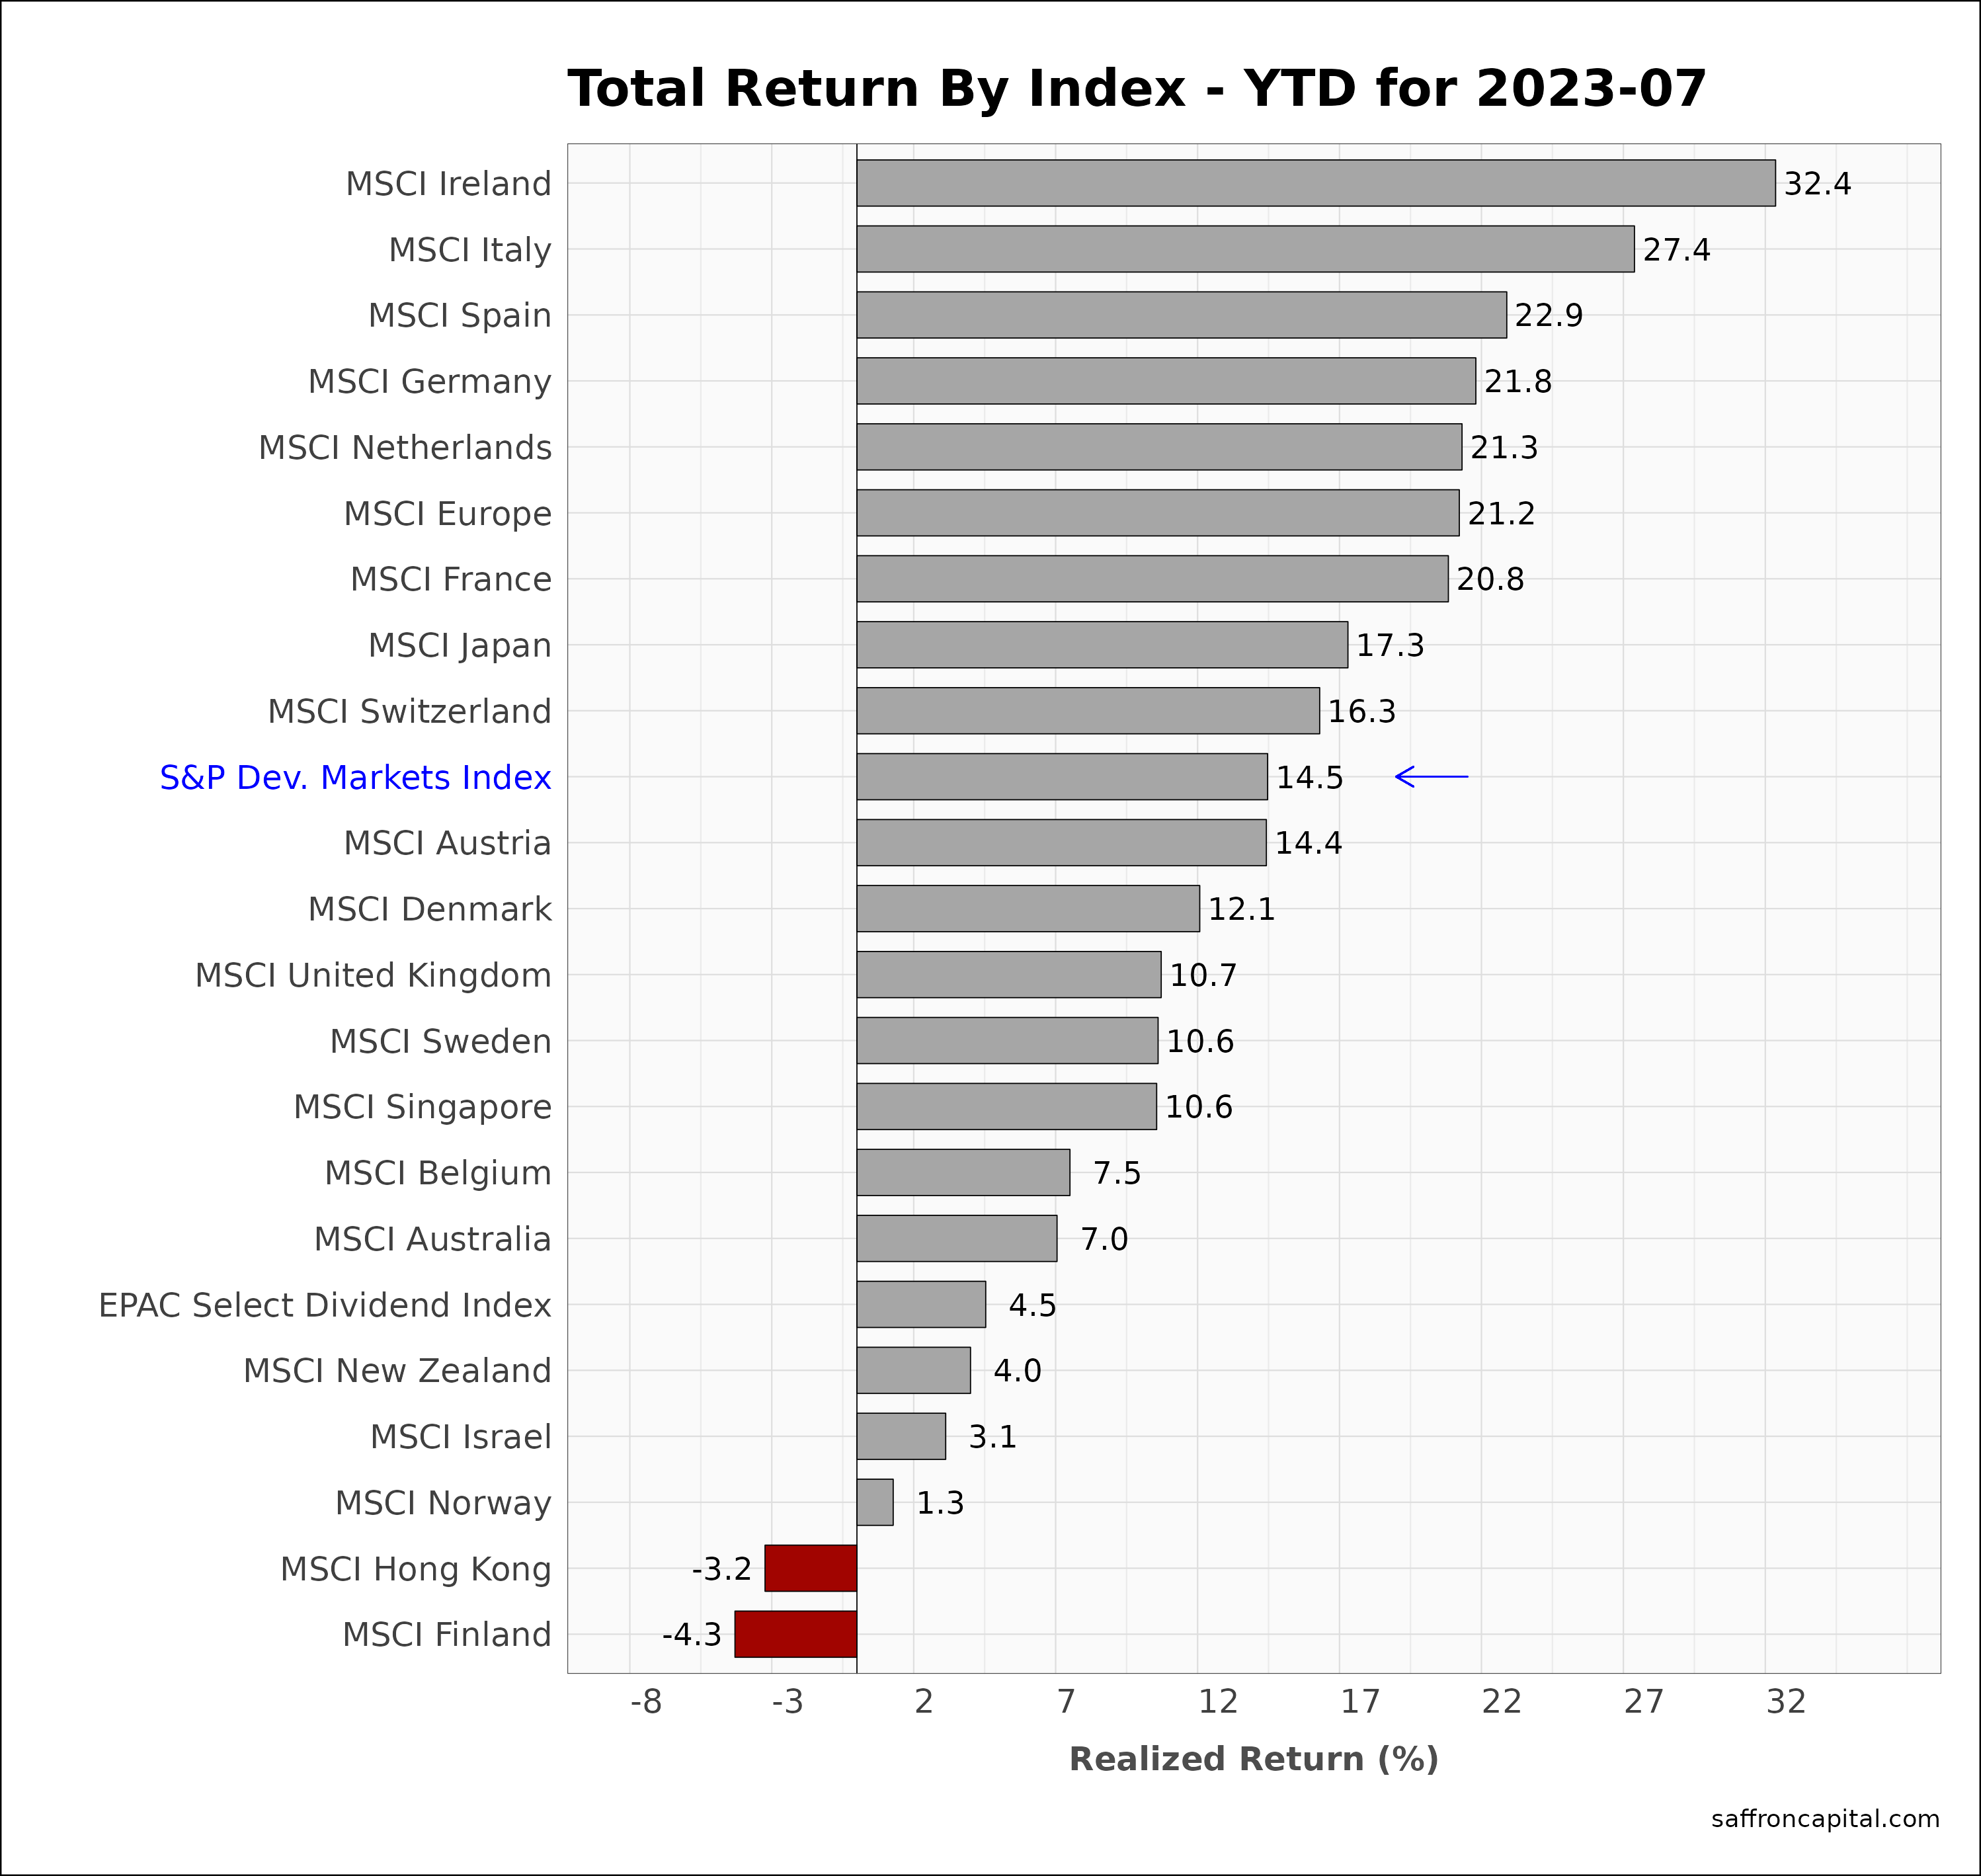
Developed Market Equities
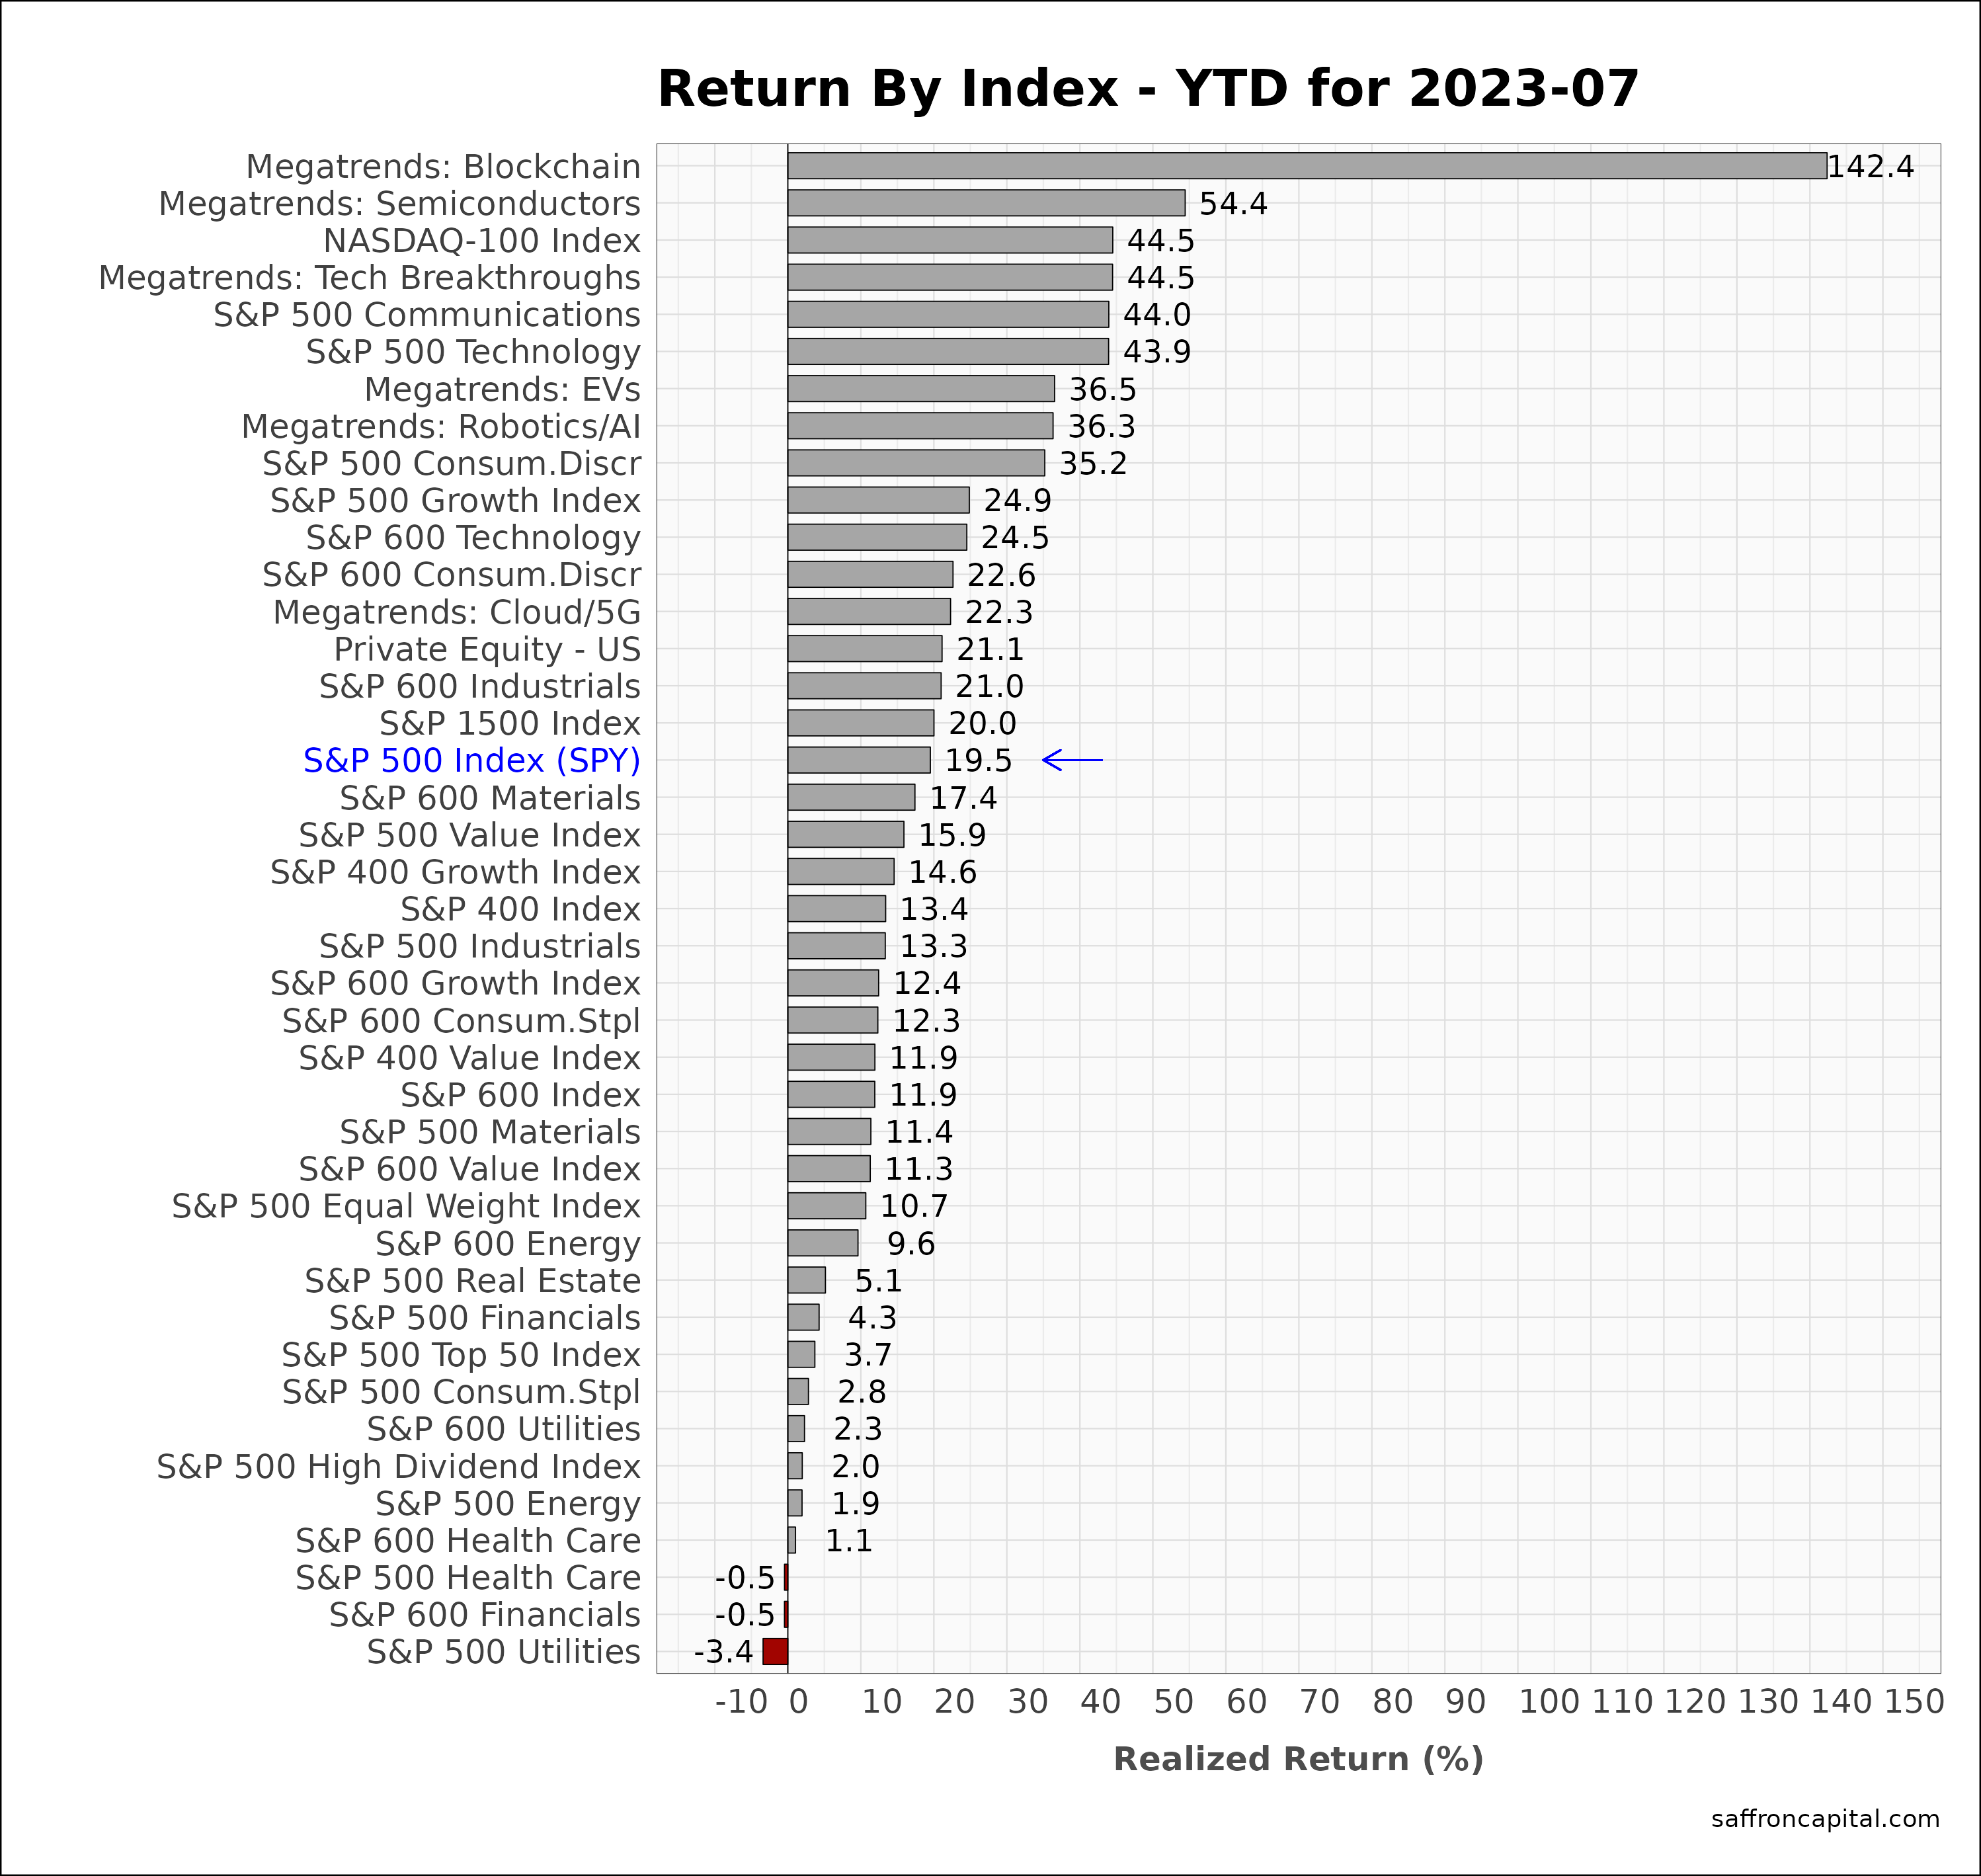
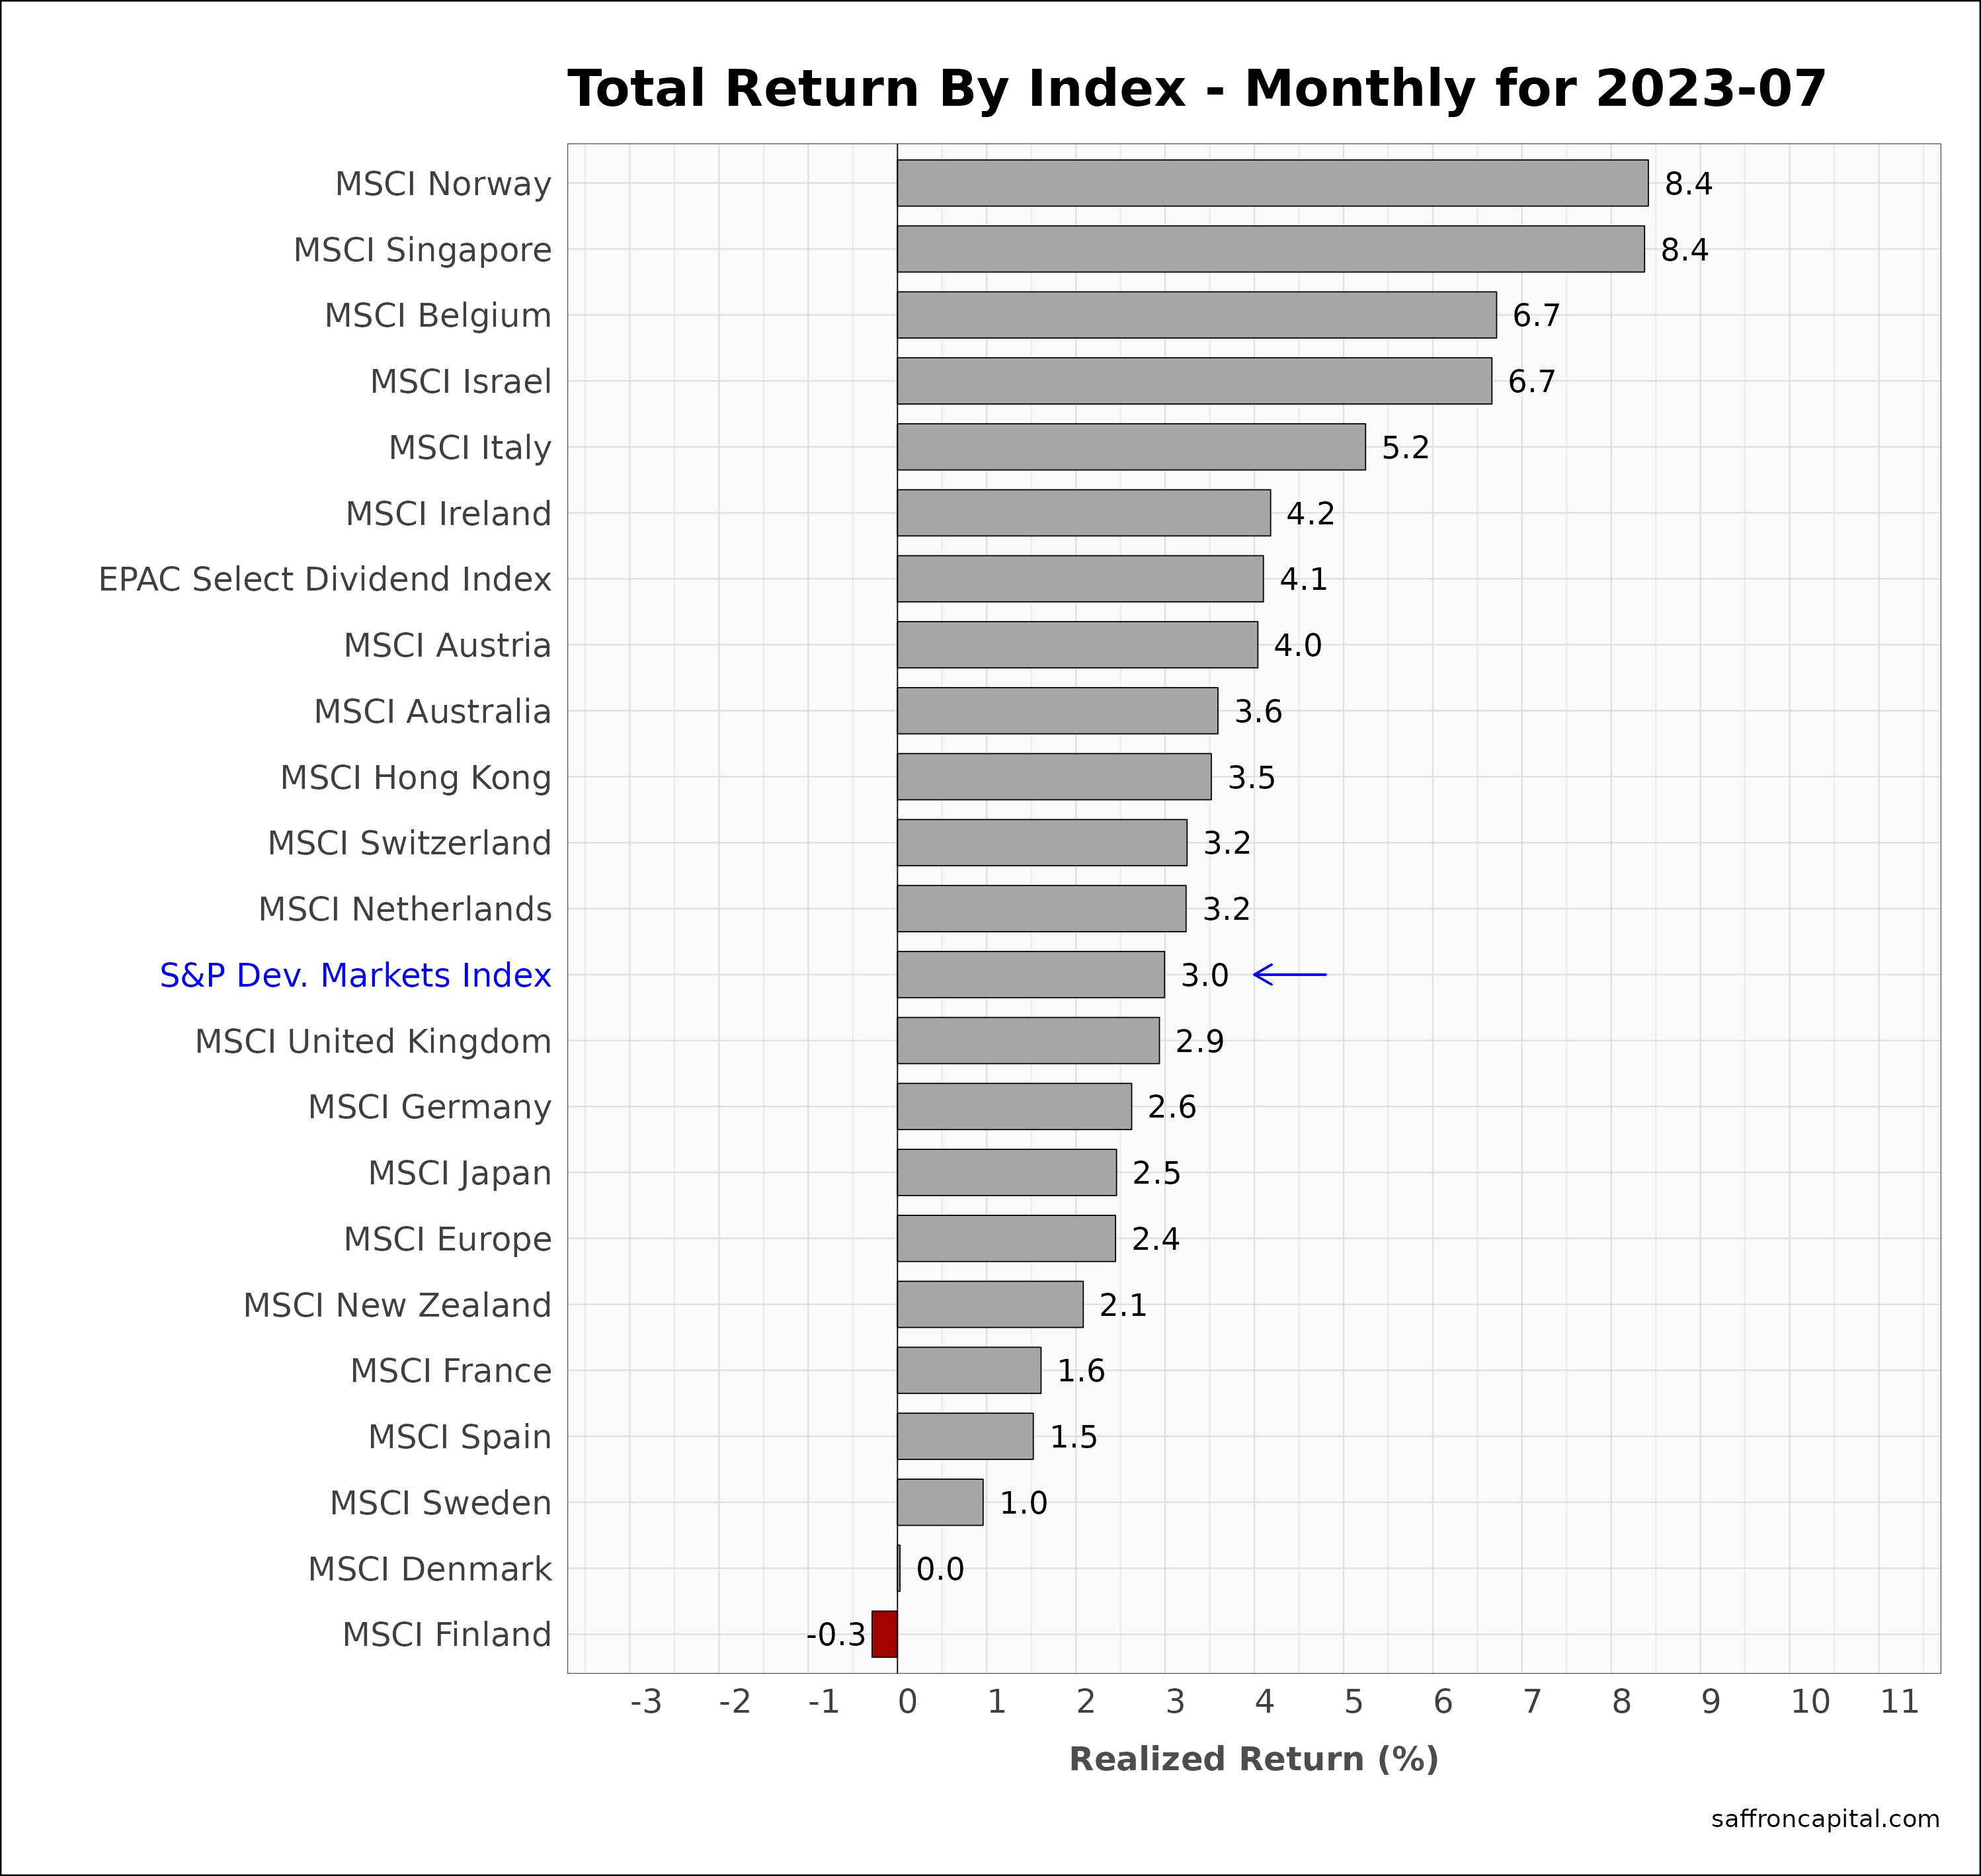
International developed markets (+3.0%) kept pace with US equities in July. For example, notable performers include Norway (+8.4%) and Singapore (+8.4%). Japan (+2.5%) and Europe (+2.4%) which lead performance year-to-date, lagged international benchmarks in July. 2023 performance of note includes Ireland (+32.4%), Italy (+27.4%), and Spain (+22.9%).
Click to enlarge
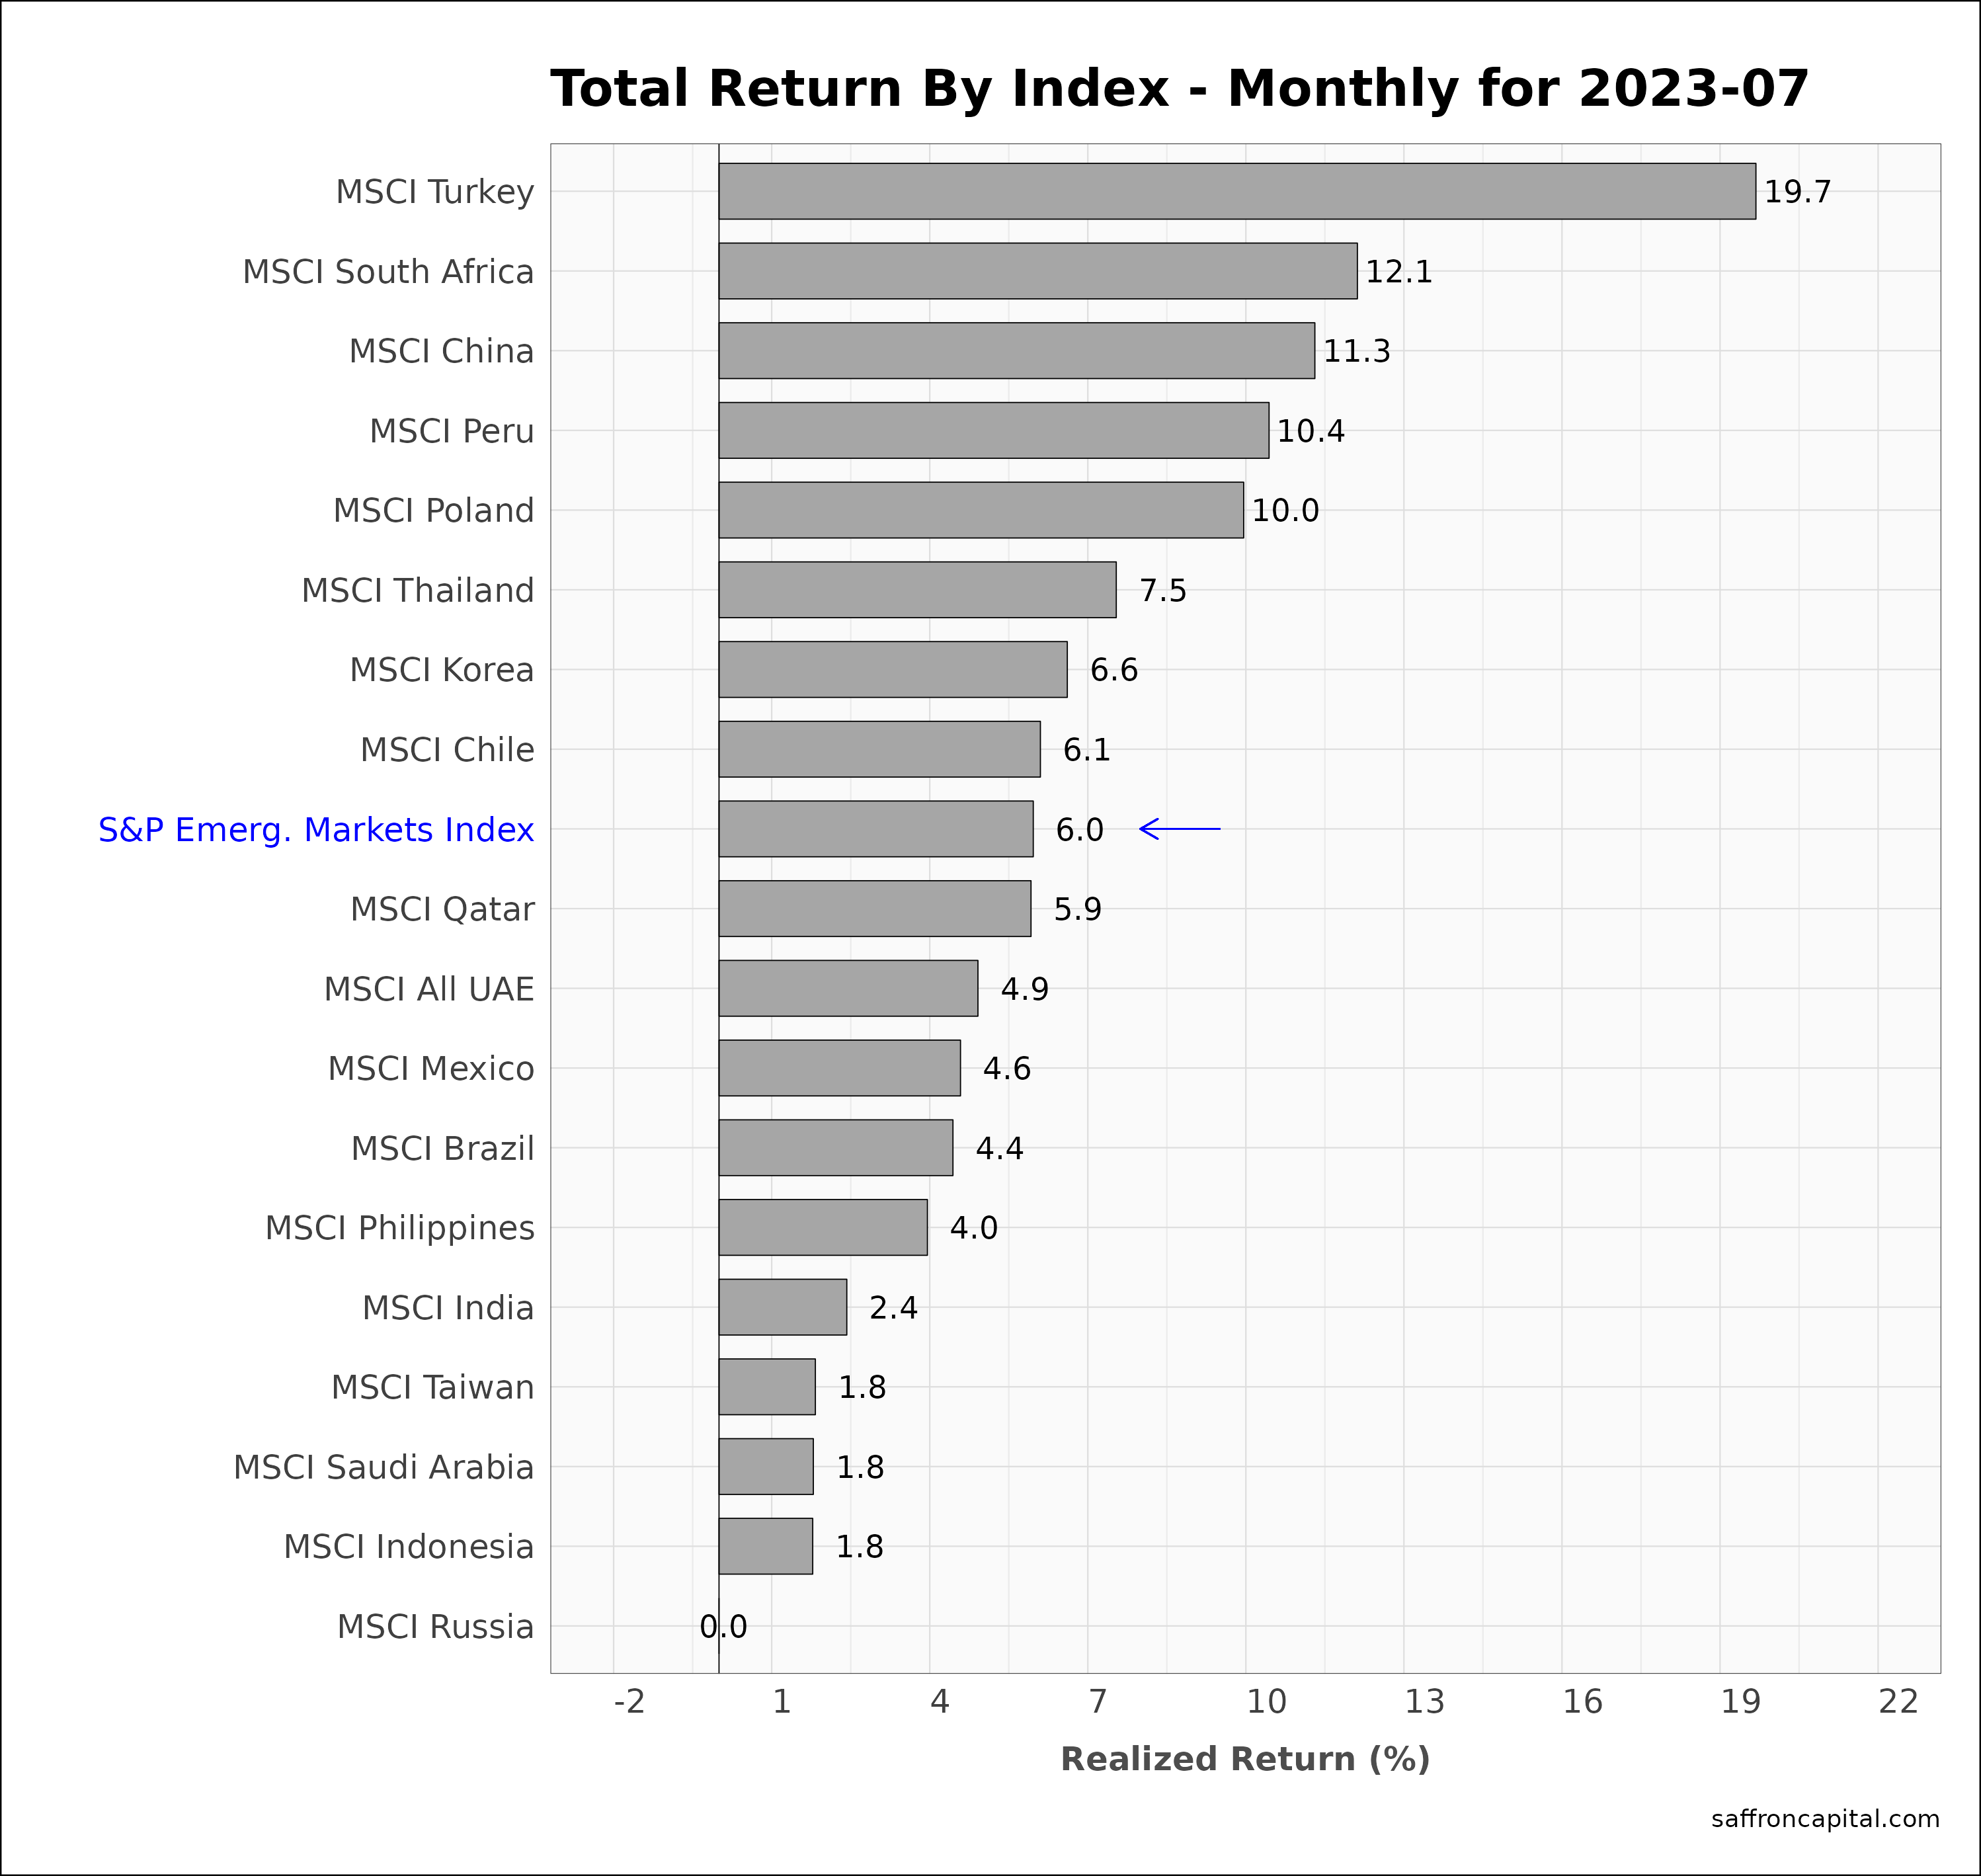
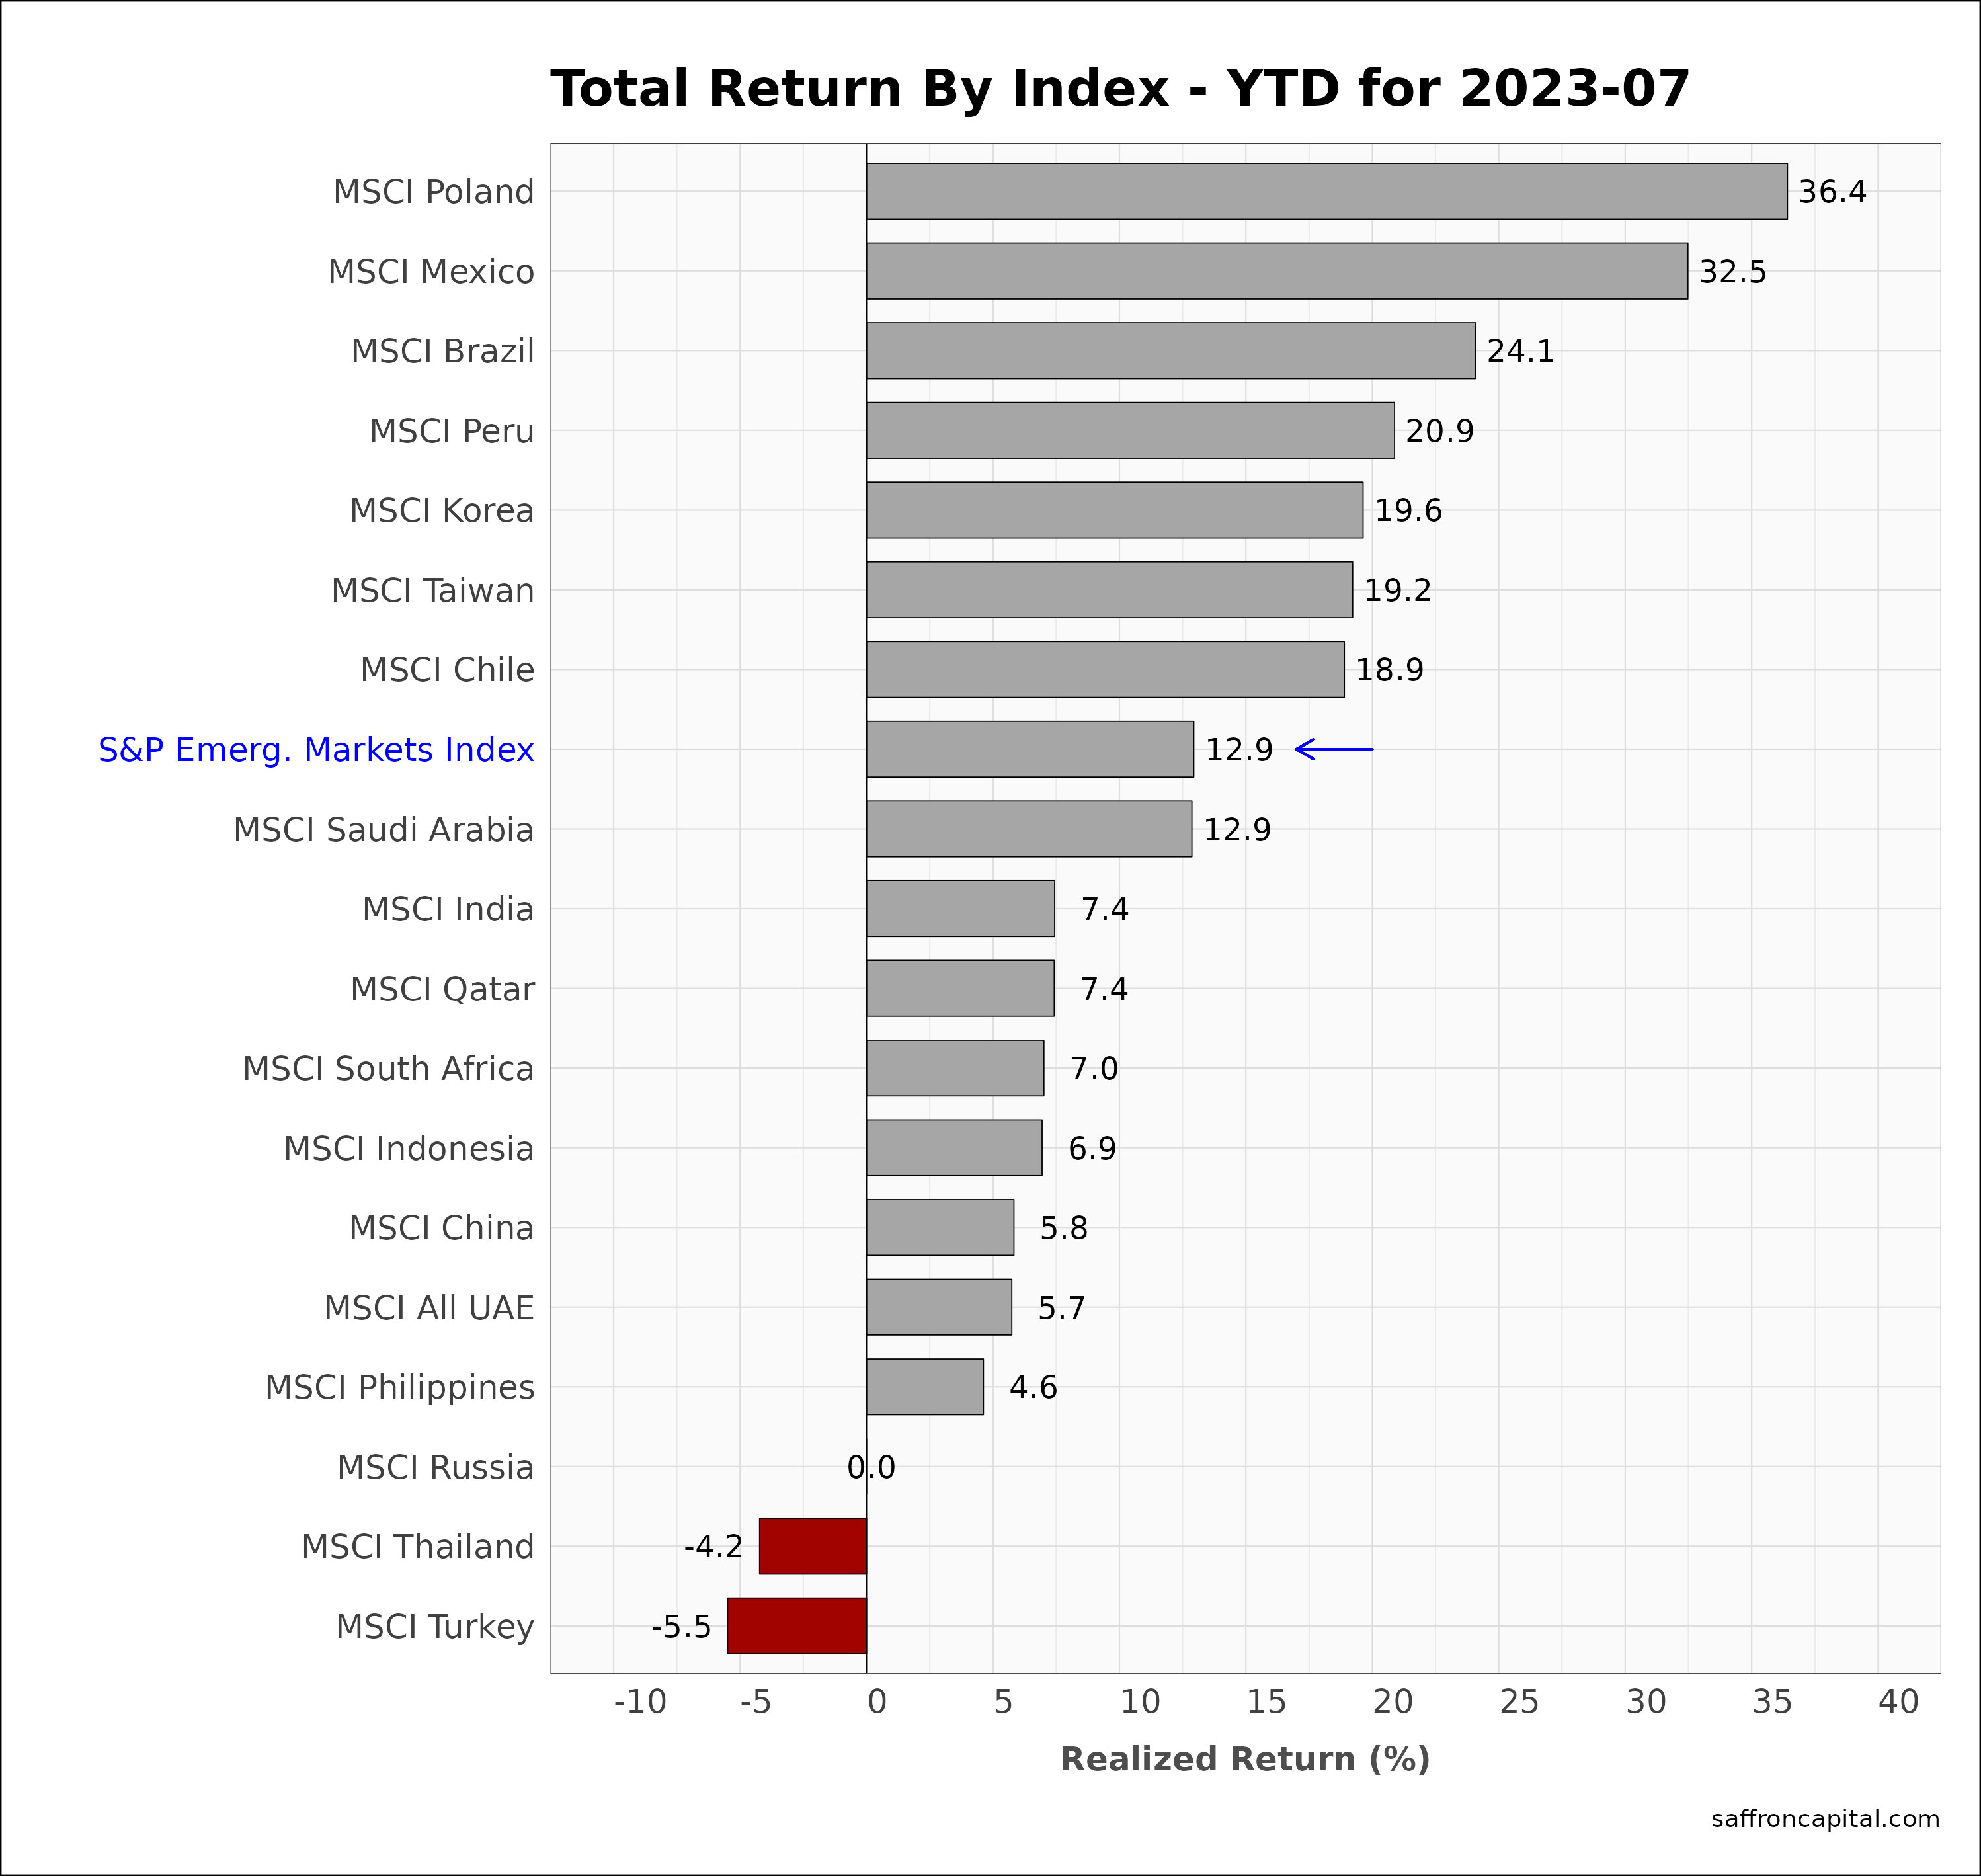
Emerging Market Equities
July 2023 returns for the S&P Emerging Markets Index (6.0%) outperformed the US and the developed markets, helped early in the month by a weak dollar. For instance, strong monthly returns were realized in Turkey (+19.7%), South Africa (+12.1%), and China (+11.3%). In comparison, year-to-date performance for emerging markets (+12.9%) continues to be lead by Poland (+36.4%), Mexico (+32.5%), and Brazil (+24.1%).
Click to enlarge
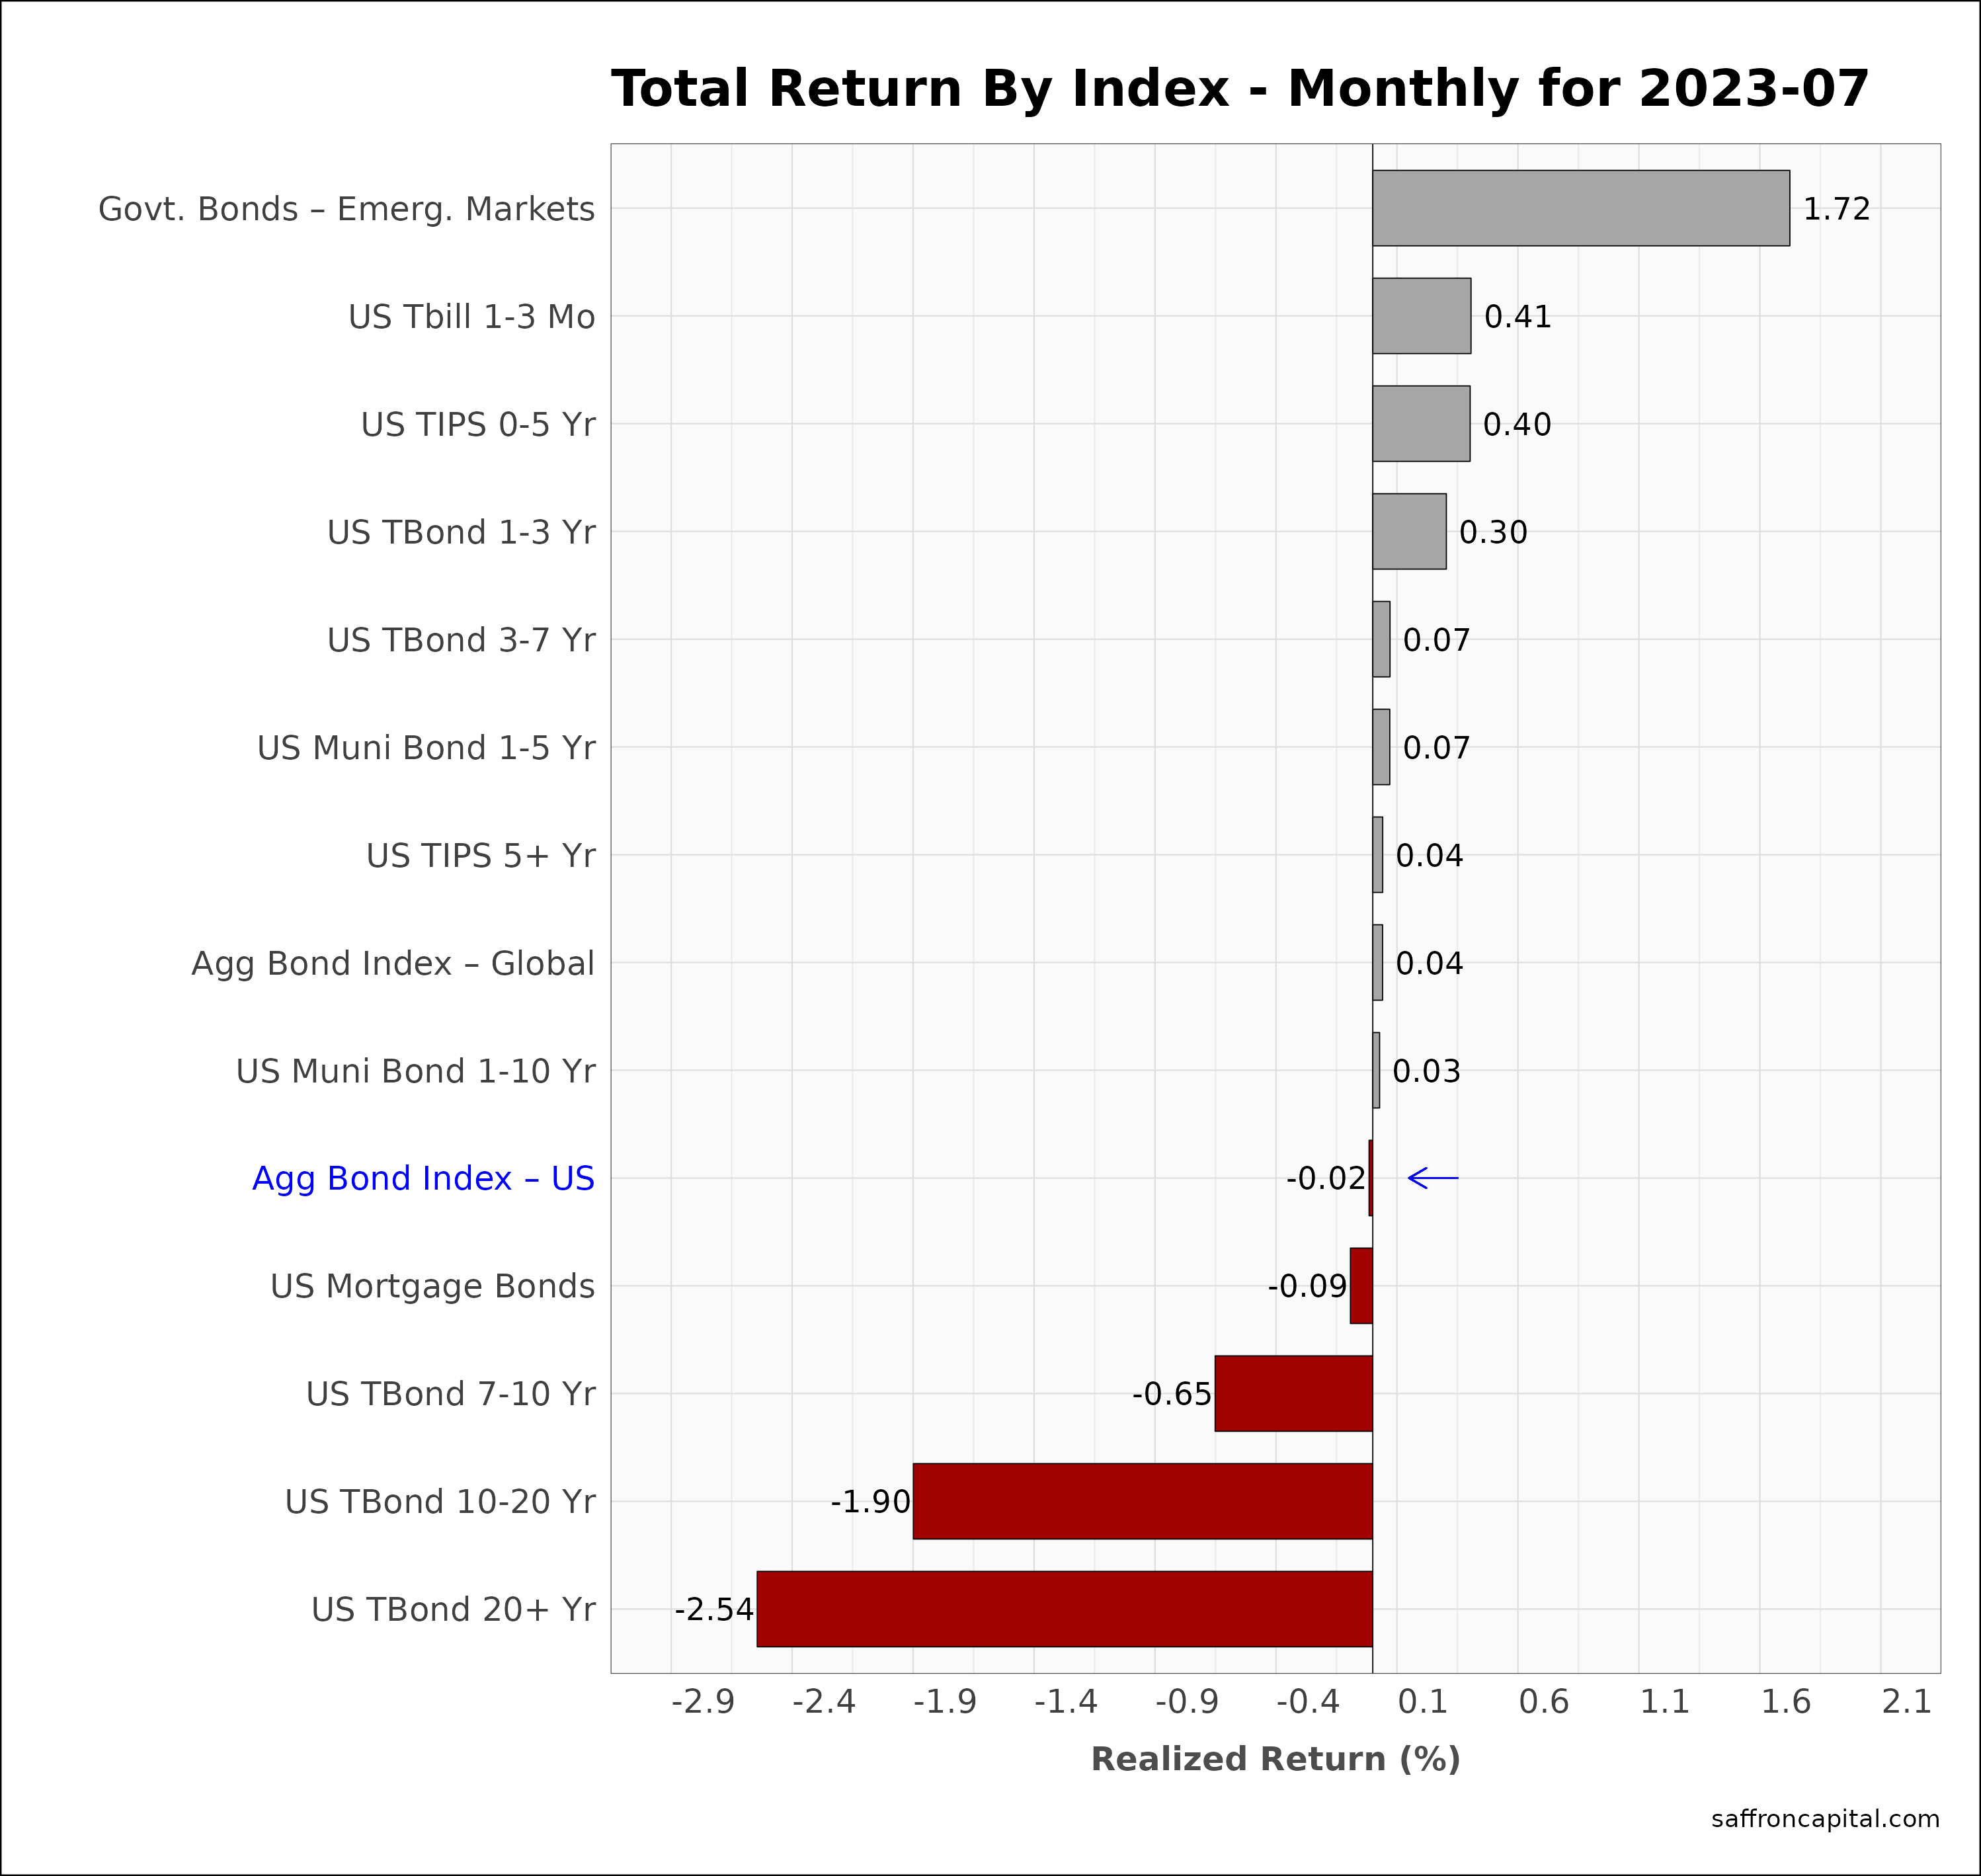
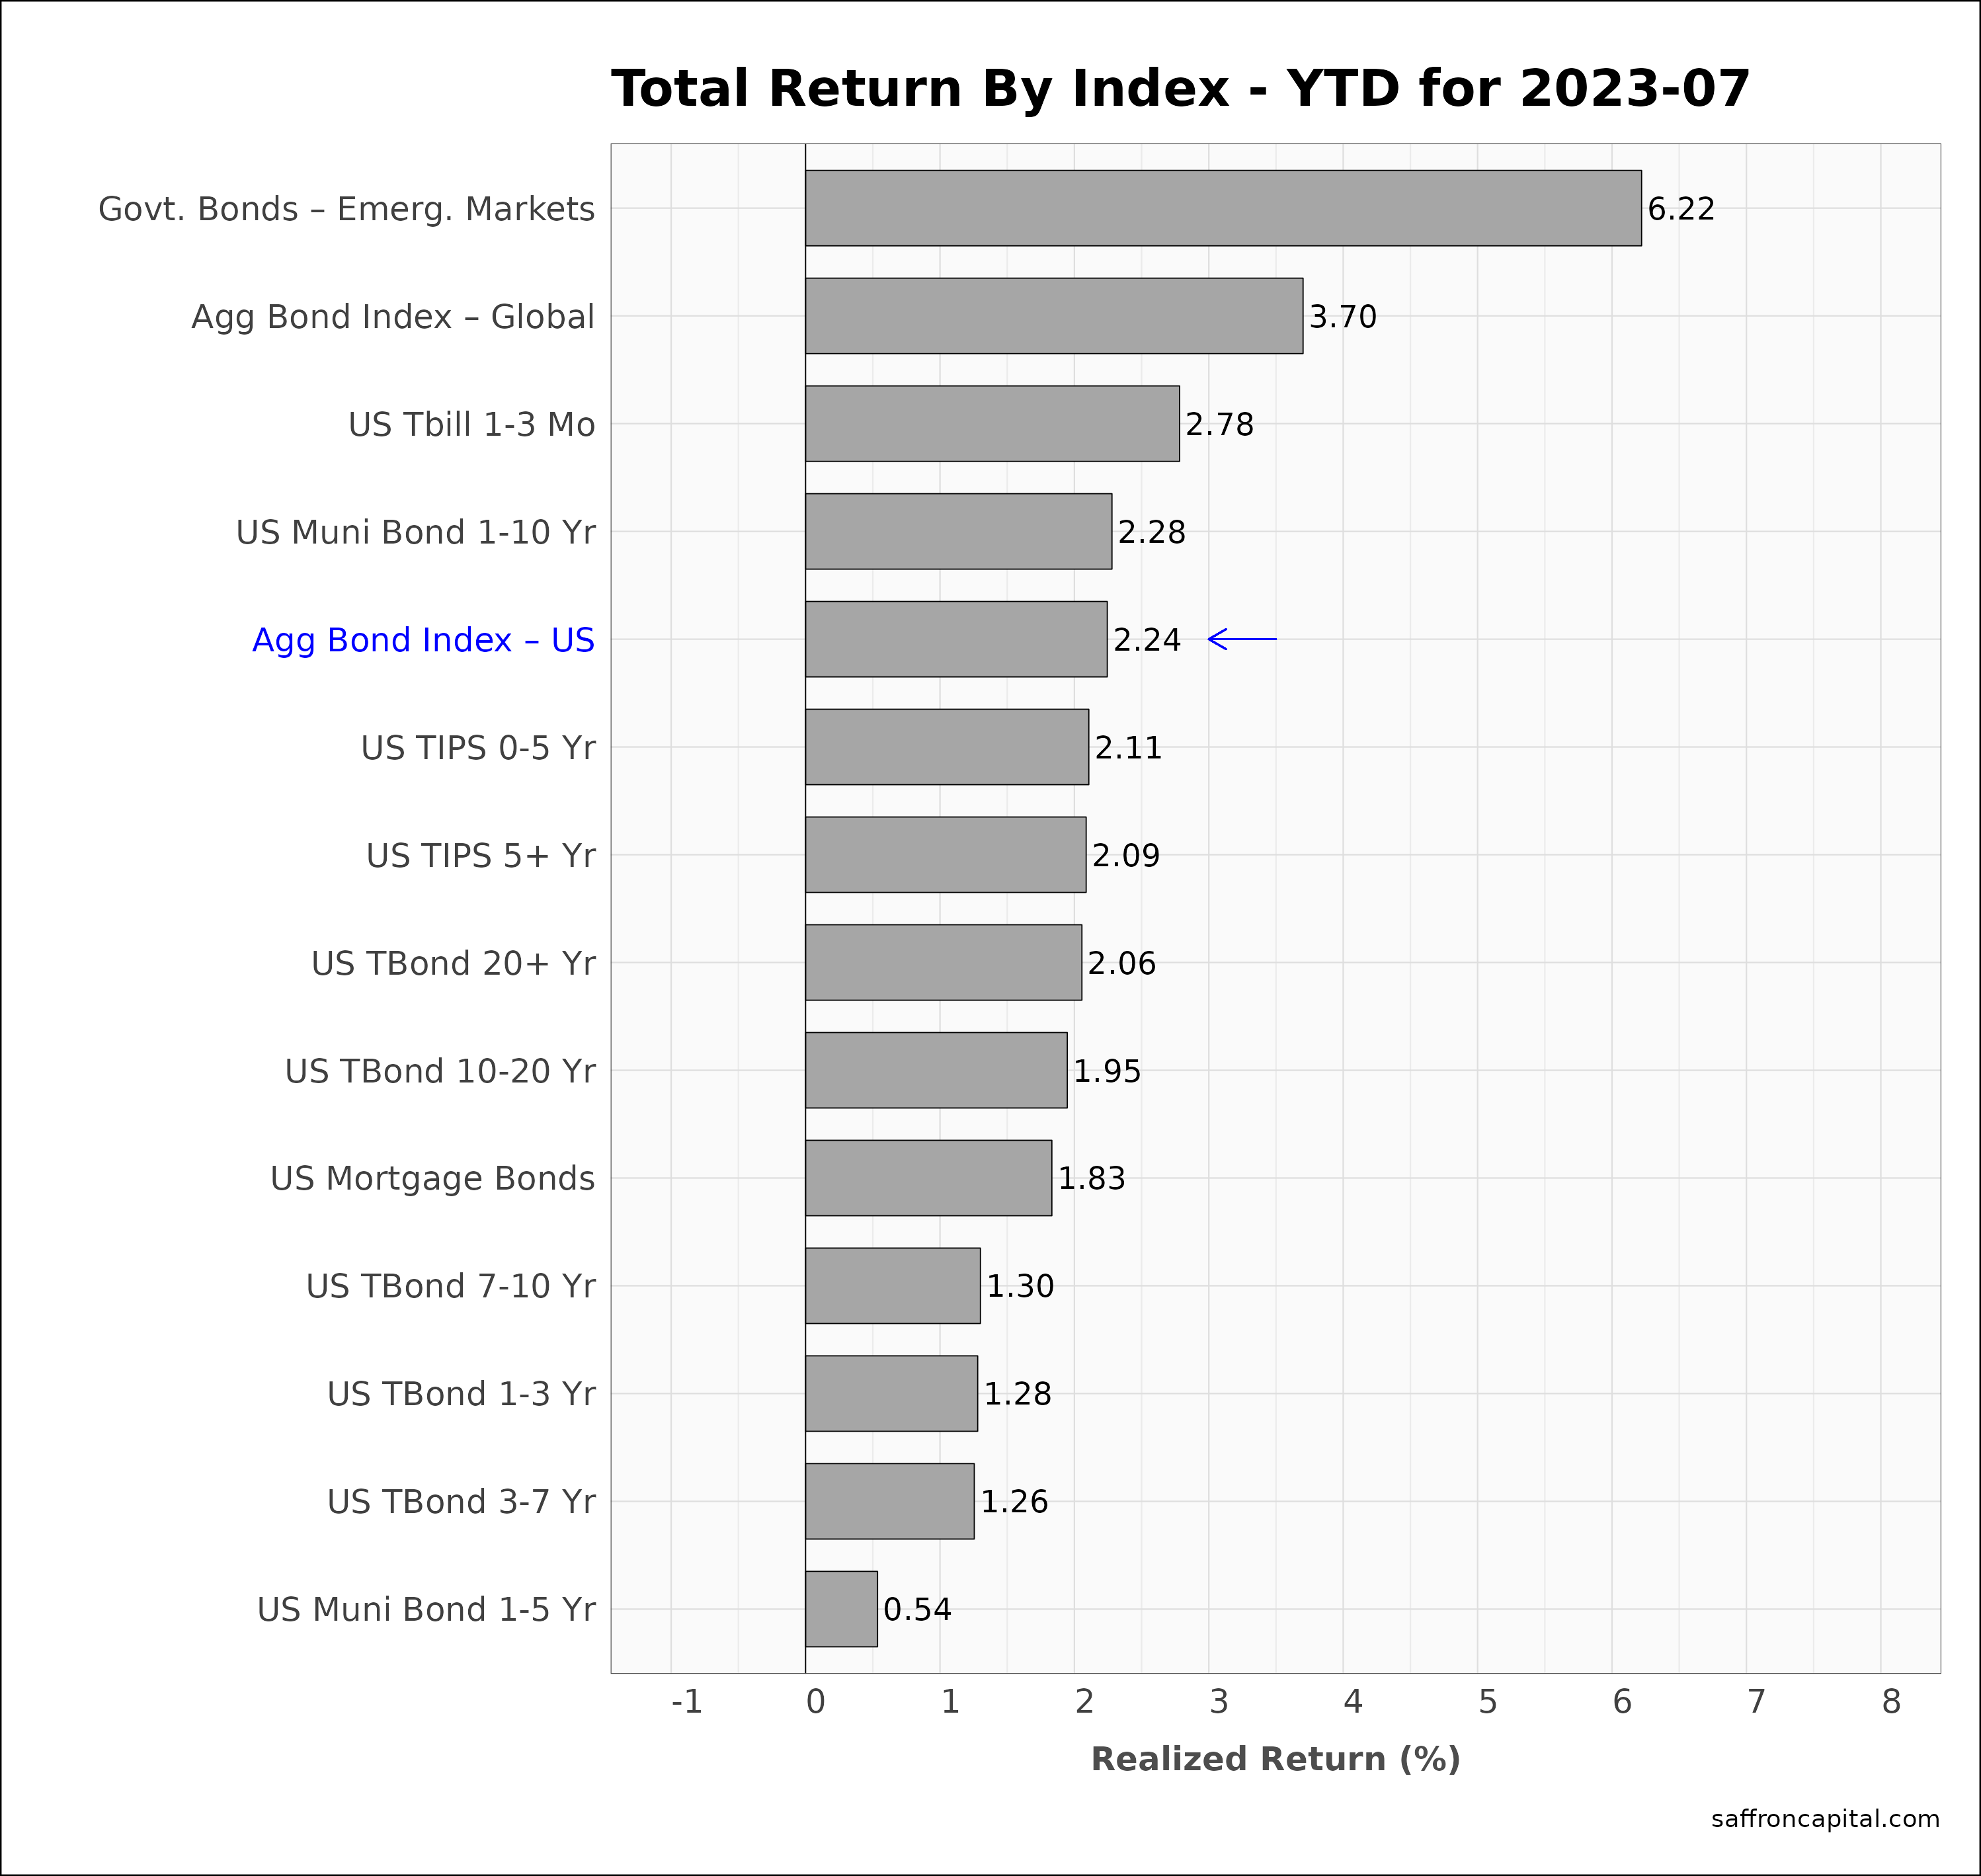
Government Bonds
July returns for the Aggregate US Government Bonds Index (-0.02%) was modest and masked he returns observed across the yield curve. As evidence, short-term yields were down, allowing the US TBills prices (+0.4%) to rise. Meanwhile, long duration yields were up and 20+ years bonds (-2.54%) had strong declines. Returns since January for the Aggregate US Bond index (+2.24%) are yet to match realized inflation in 2023.
Click to enlarge
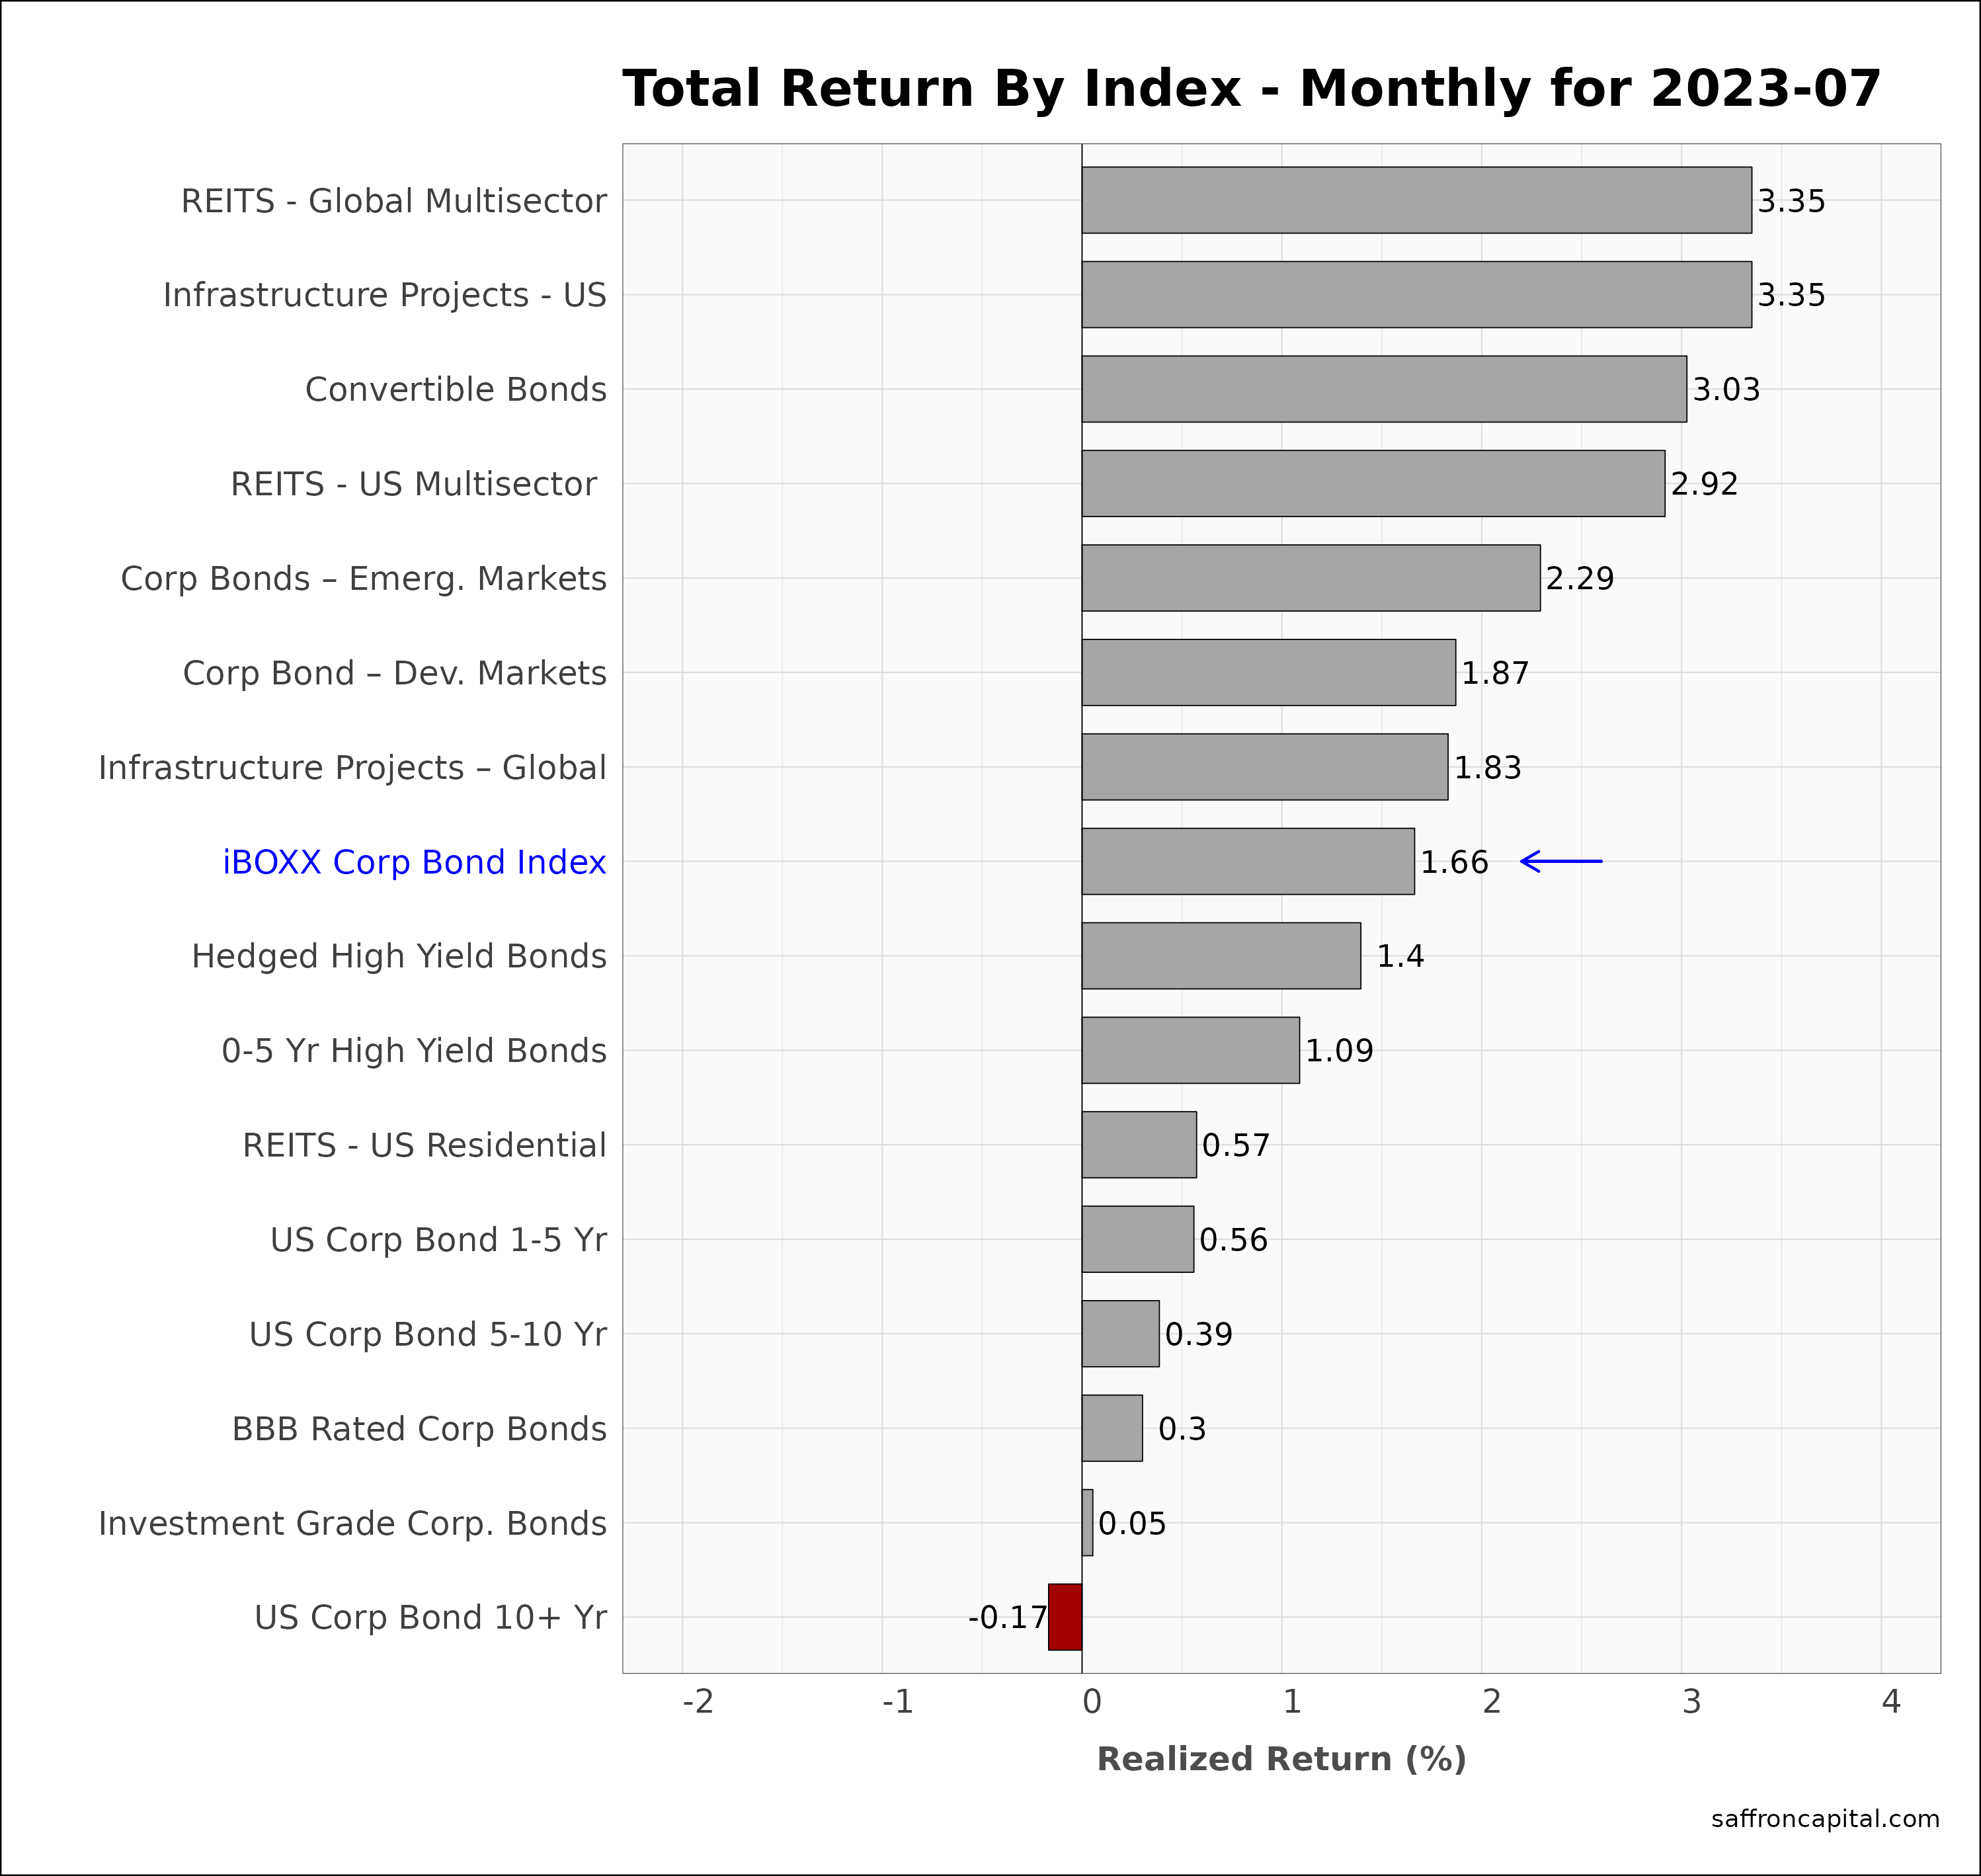
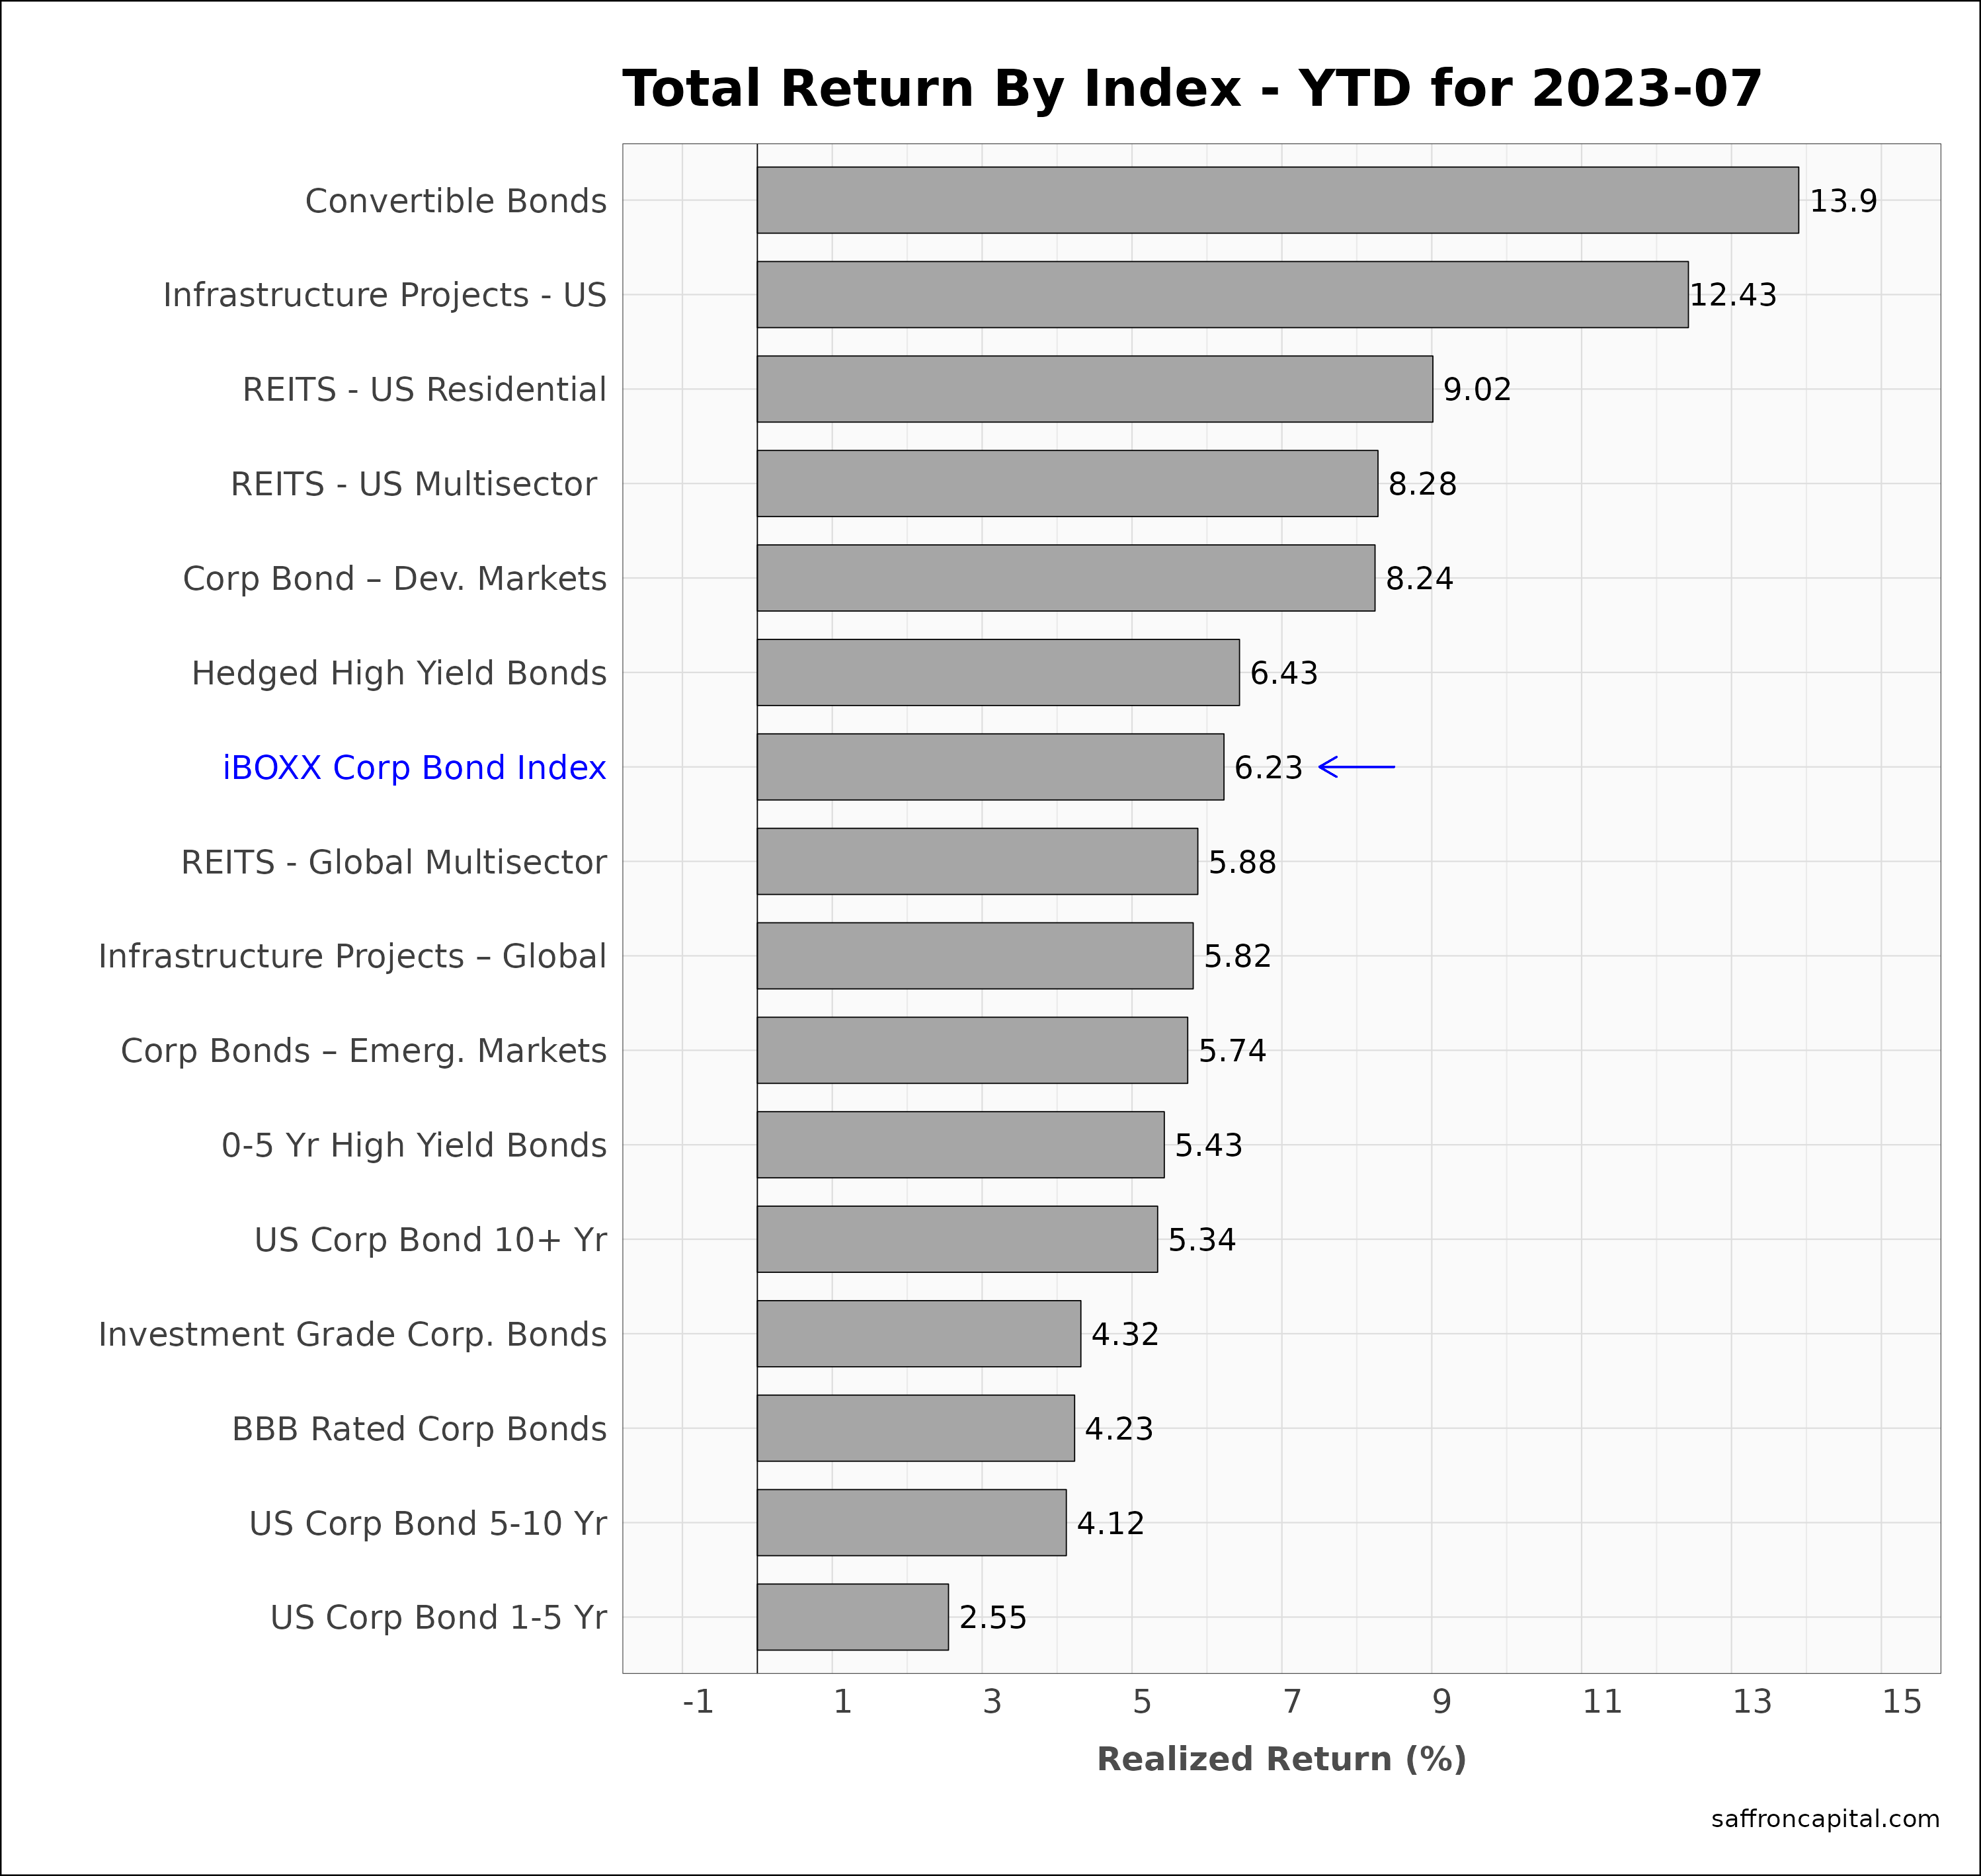
Corporate & Infrastructure Bonds
The iBoxx Corporate Bond Index (+1.66%) outperformed Treasury bonds in July. Performance was lead by Global Multisector REITS (3.35%), US Infrastructure project bonds (+3.35%), and Convertible bonds (+3.03%). In contrast, more defensive plays within the sector, like investment grade and low duration corporate bonds, all had weak returns. Year-to-date performance is topped by Convertible Bonds (+10.55%), US Infrastructure Bonds (+8.78%) and US Residential REITS (+8.39%).
Click to enlarge
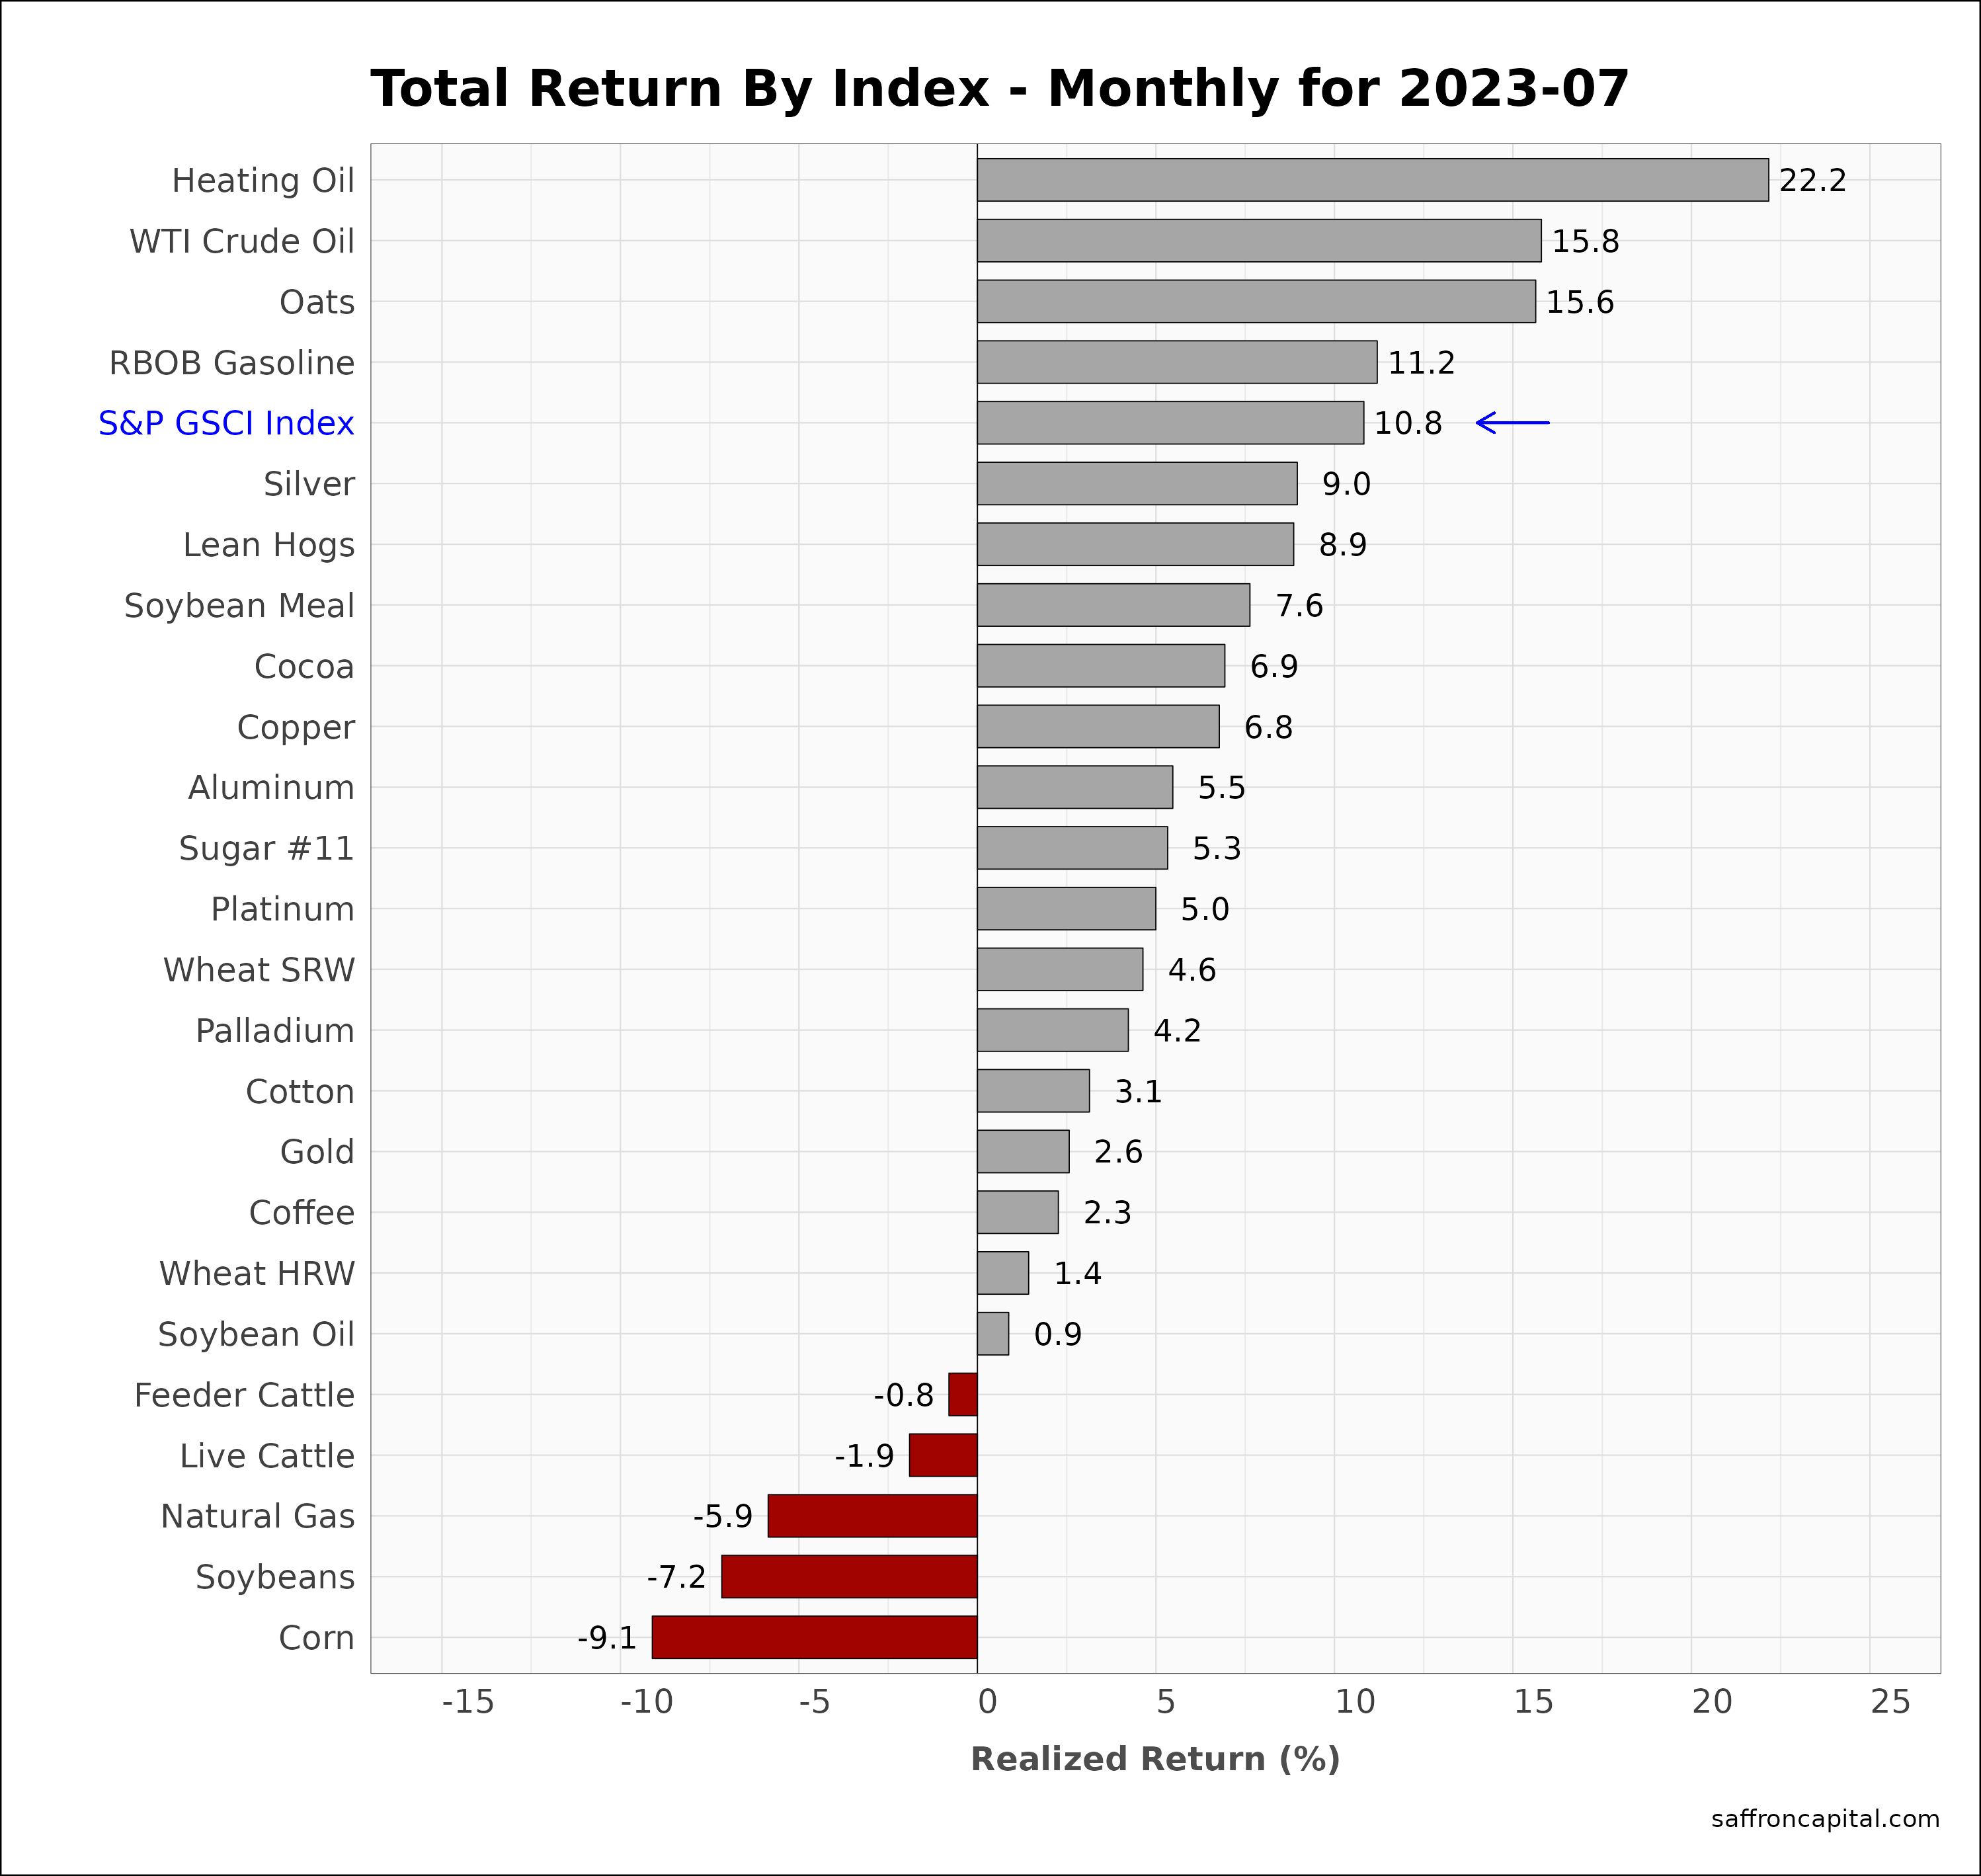
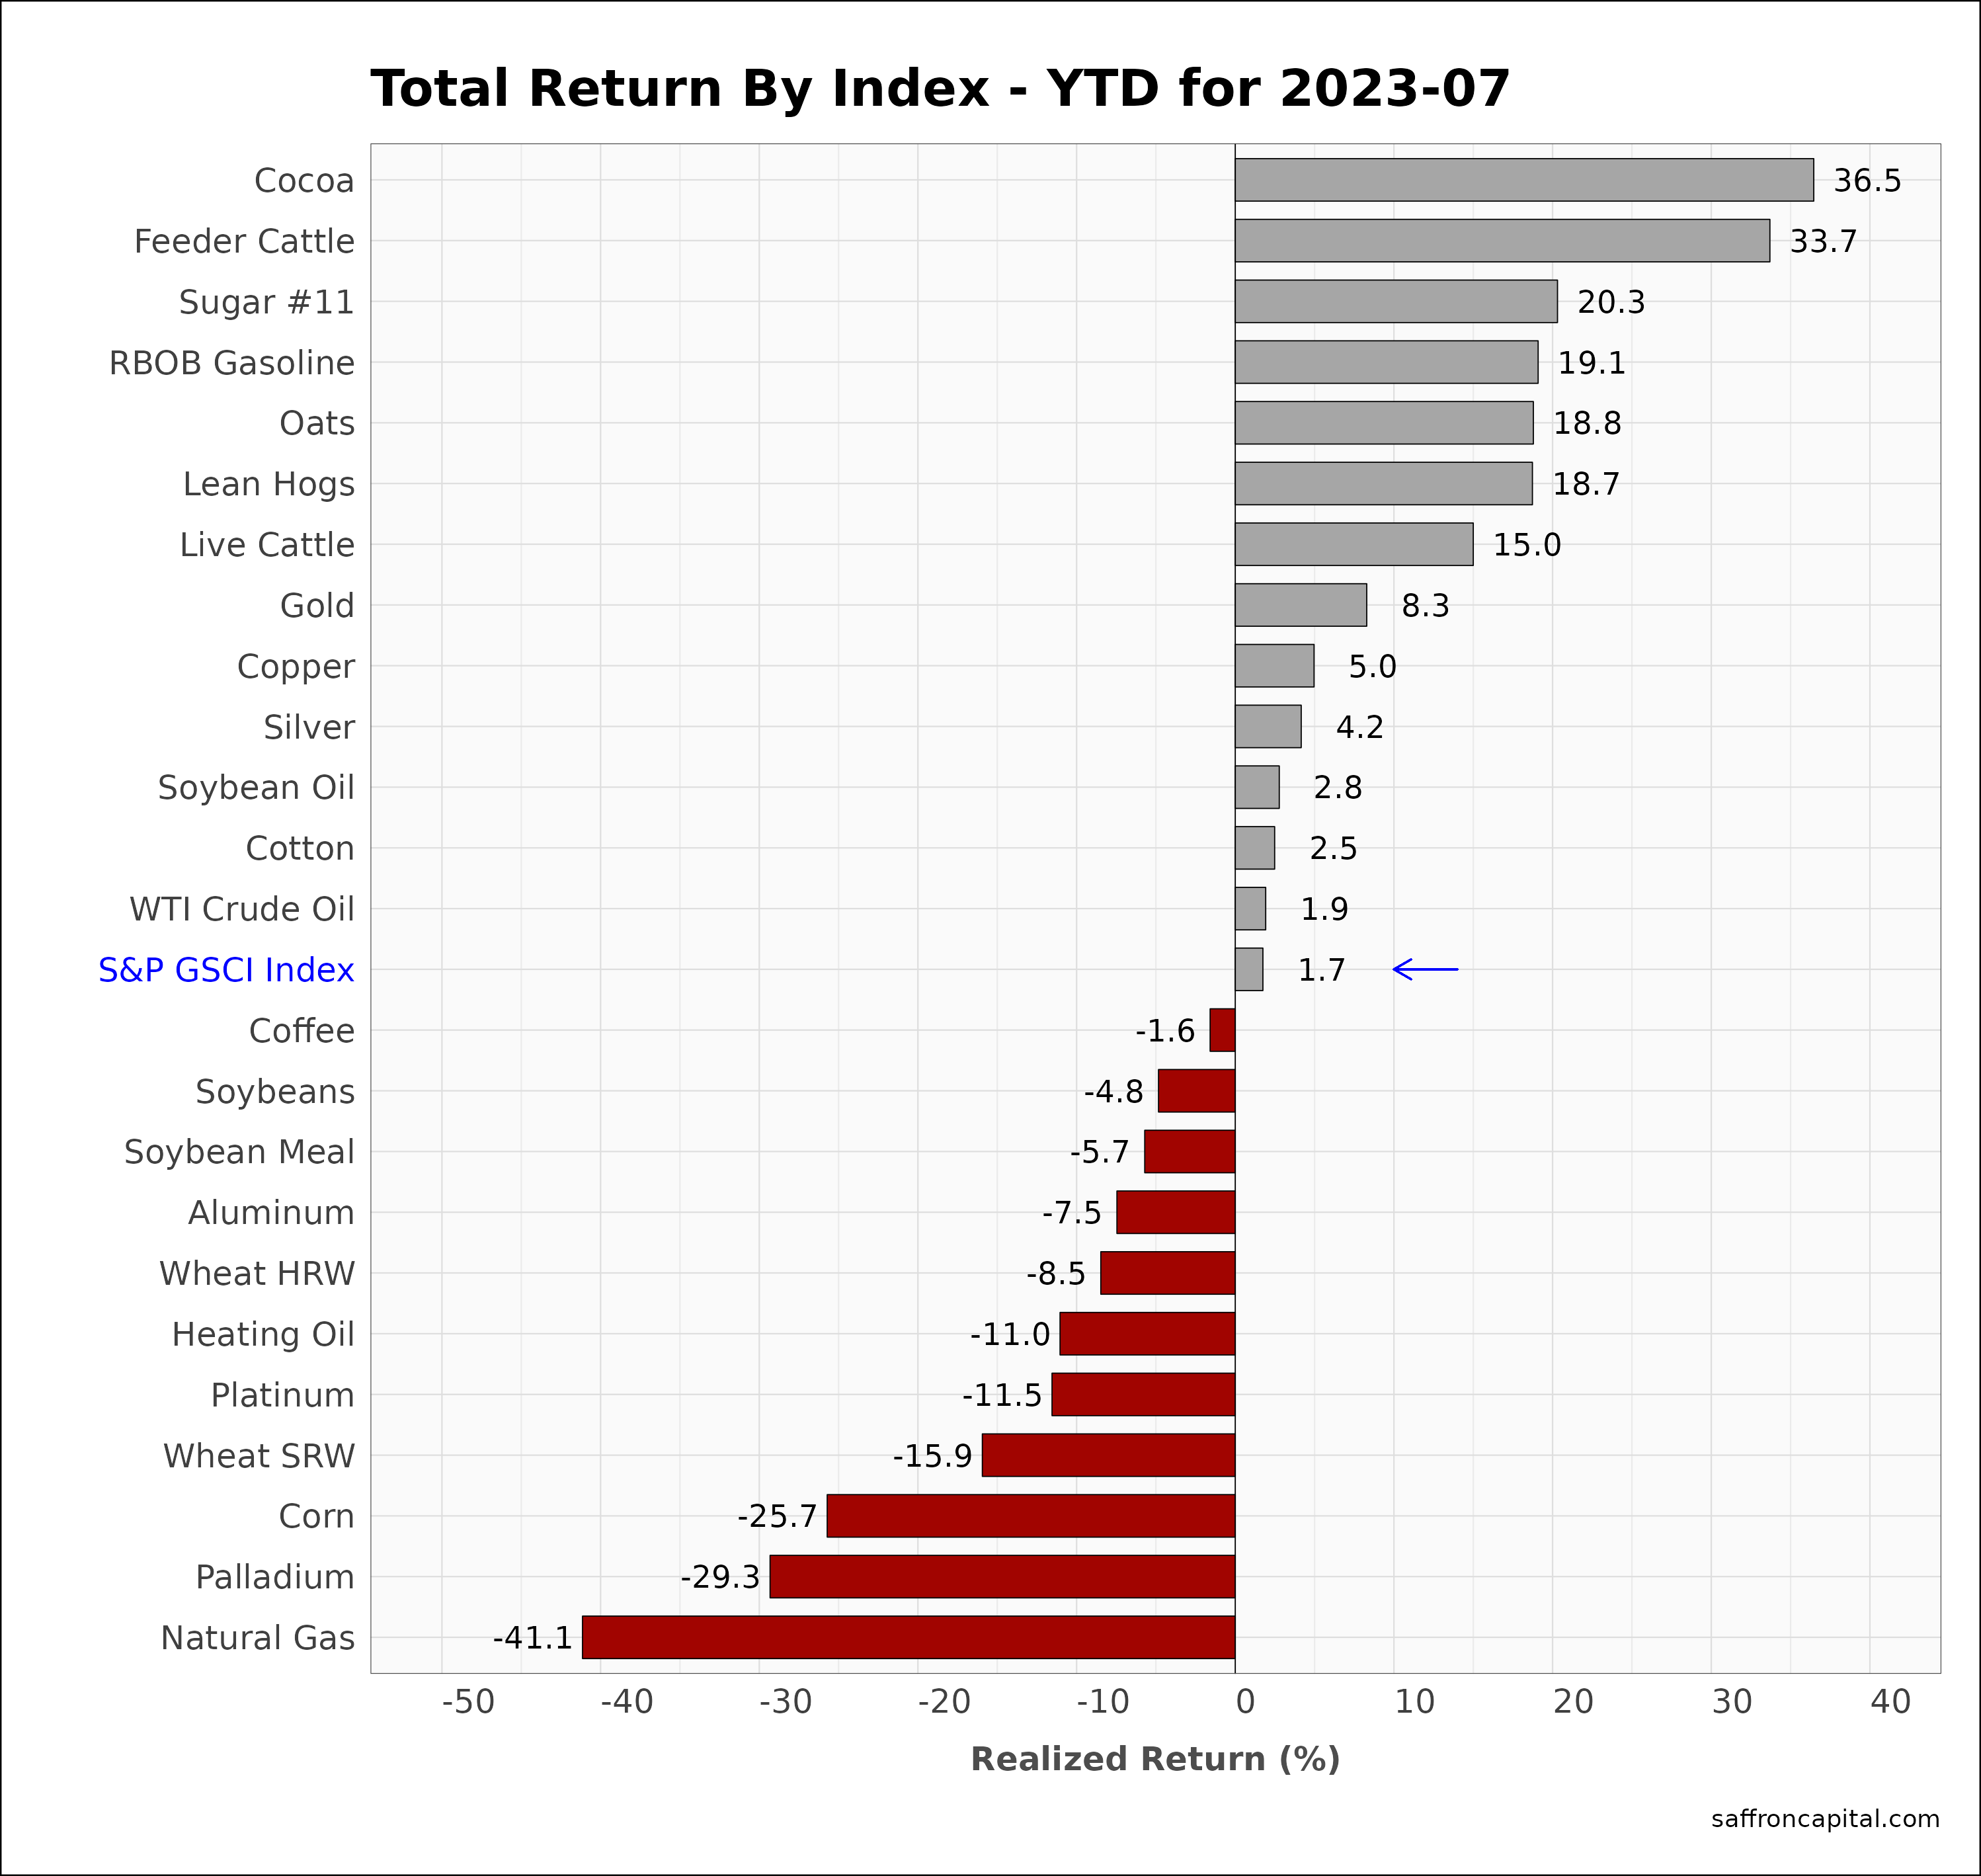
Commodities
July 2023 returns for the S&P GSCI index (+10.8%) confirmed that most commodities were up, notably oil products. For example, distillates used for jet fuel and heating oil (+22.2%) had the strongest price change of the month, followed by crude oil (+15.8%) and Oats (+15.6%). Grains, which were under drought stress, had sificant price declines follwoing recent rains, as seen in Soybean (-7.2%) and Corn (-9.1%). Year to date are more varied, as shown below.
Click to enlarge
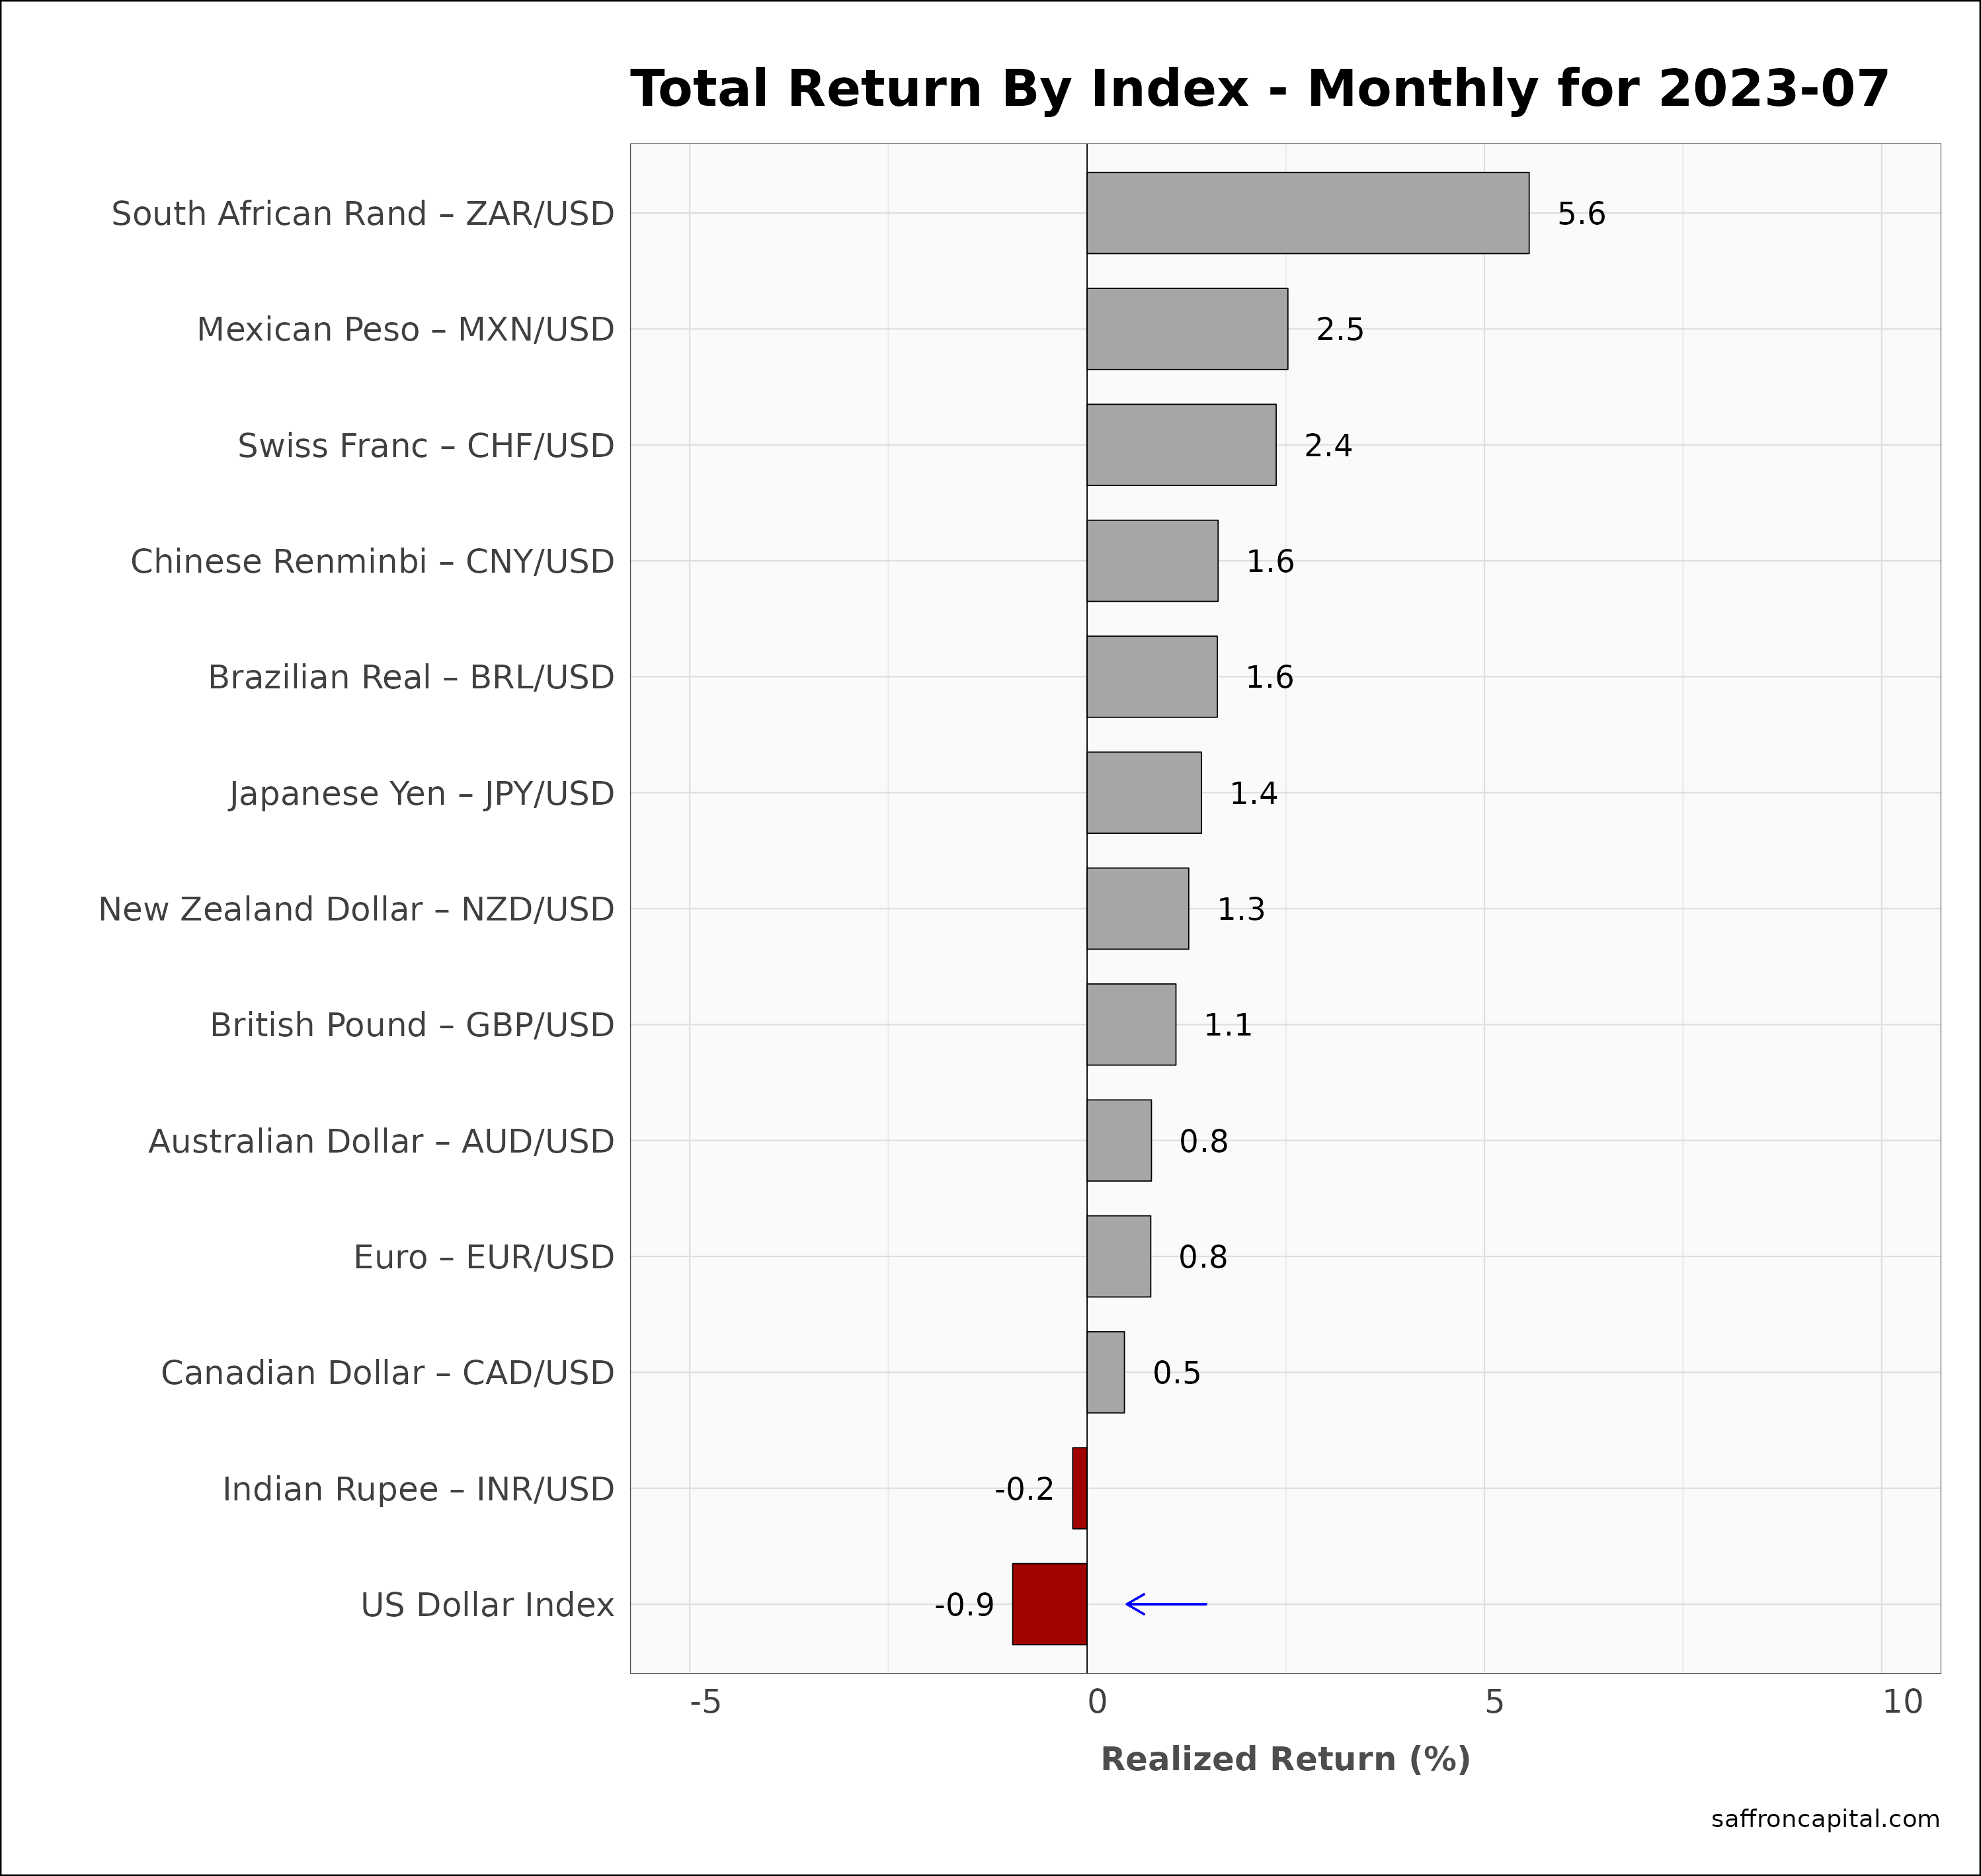
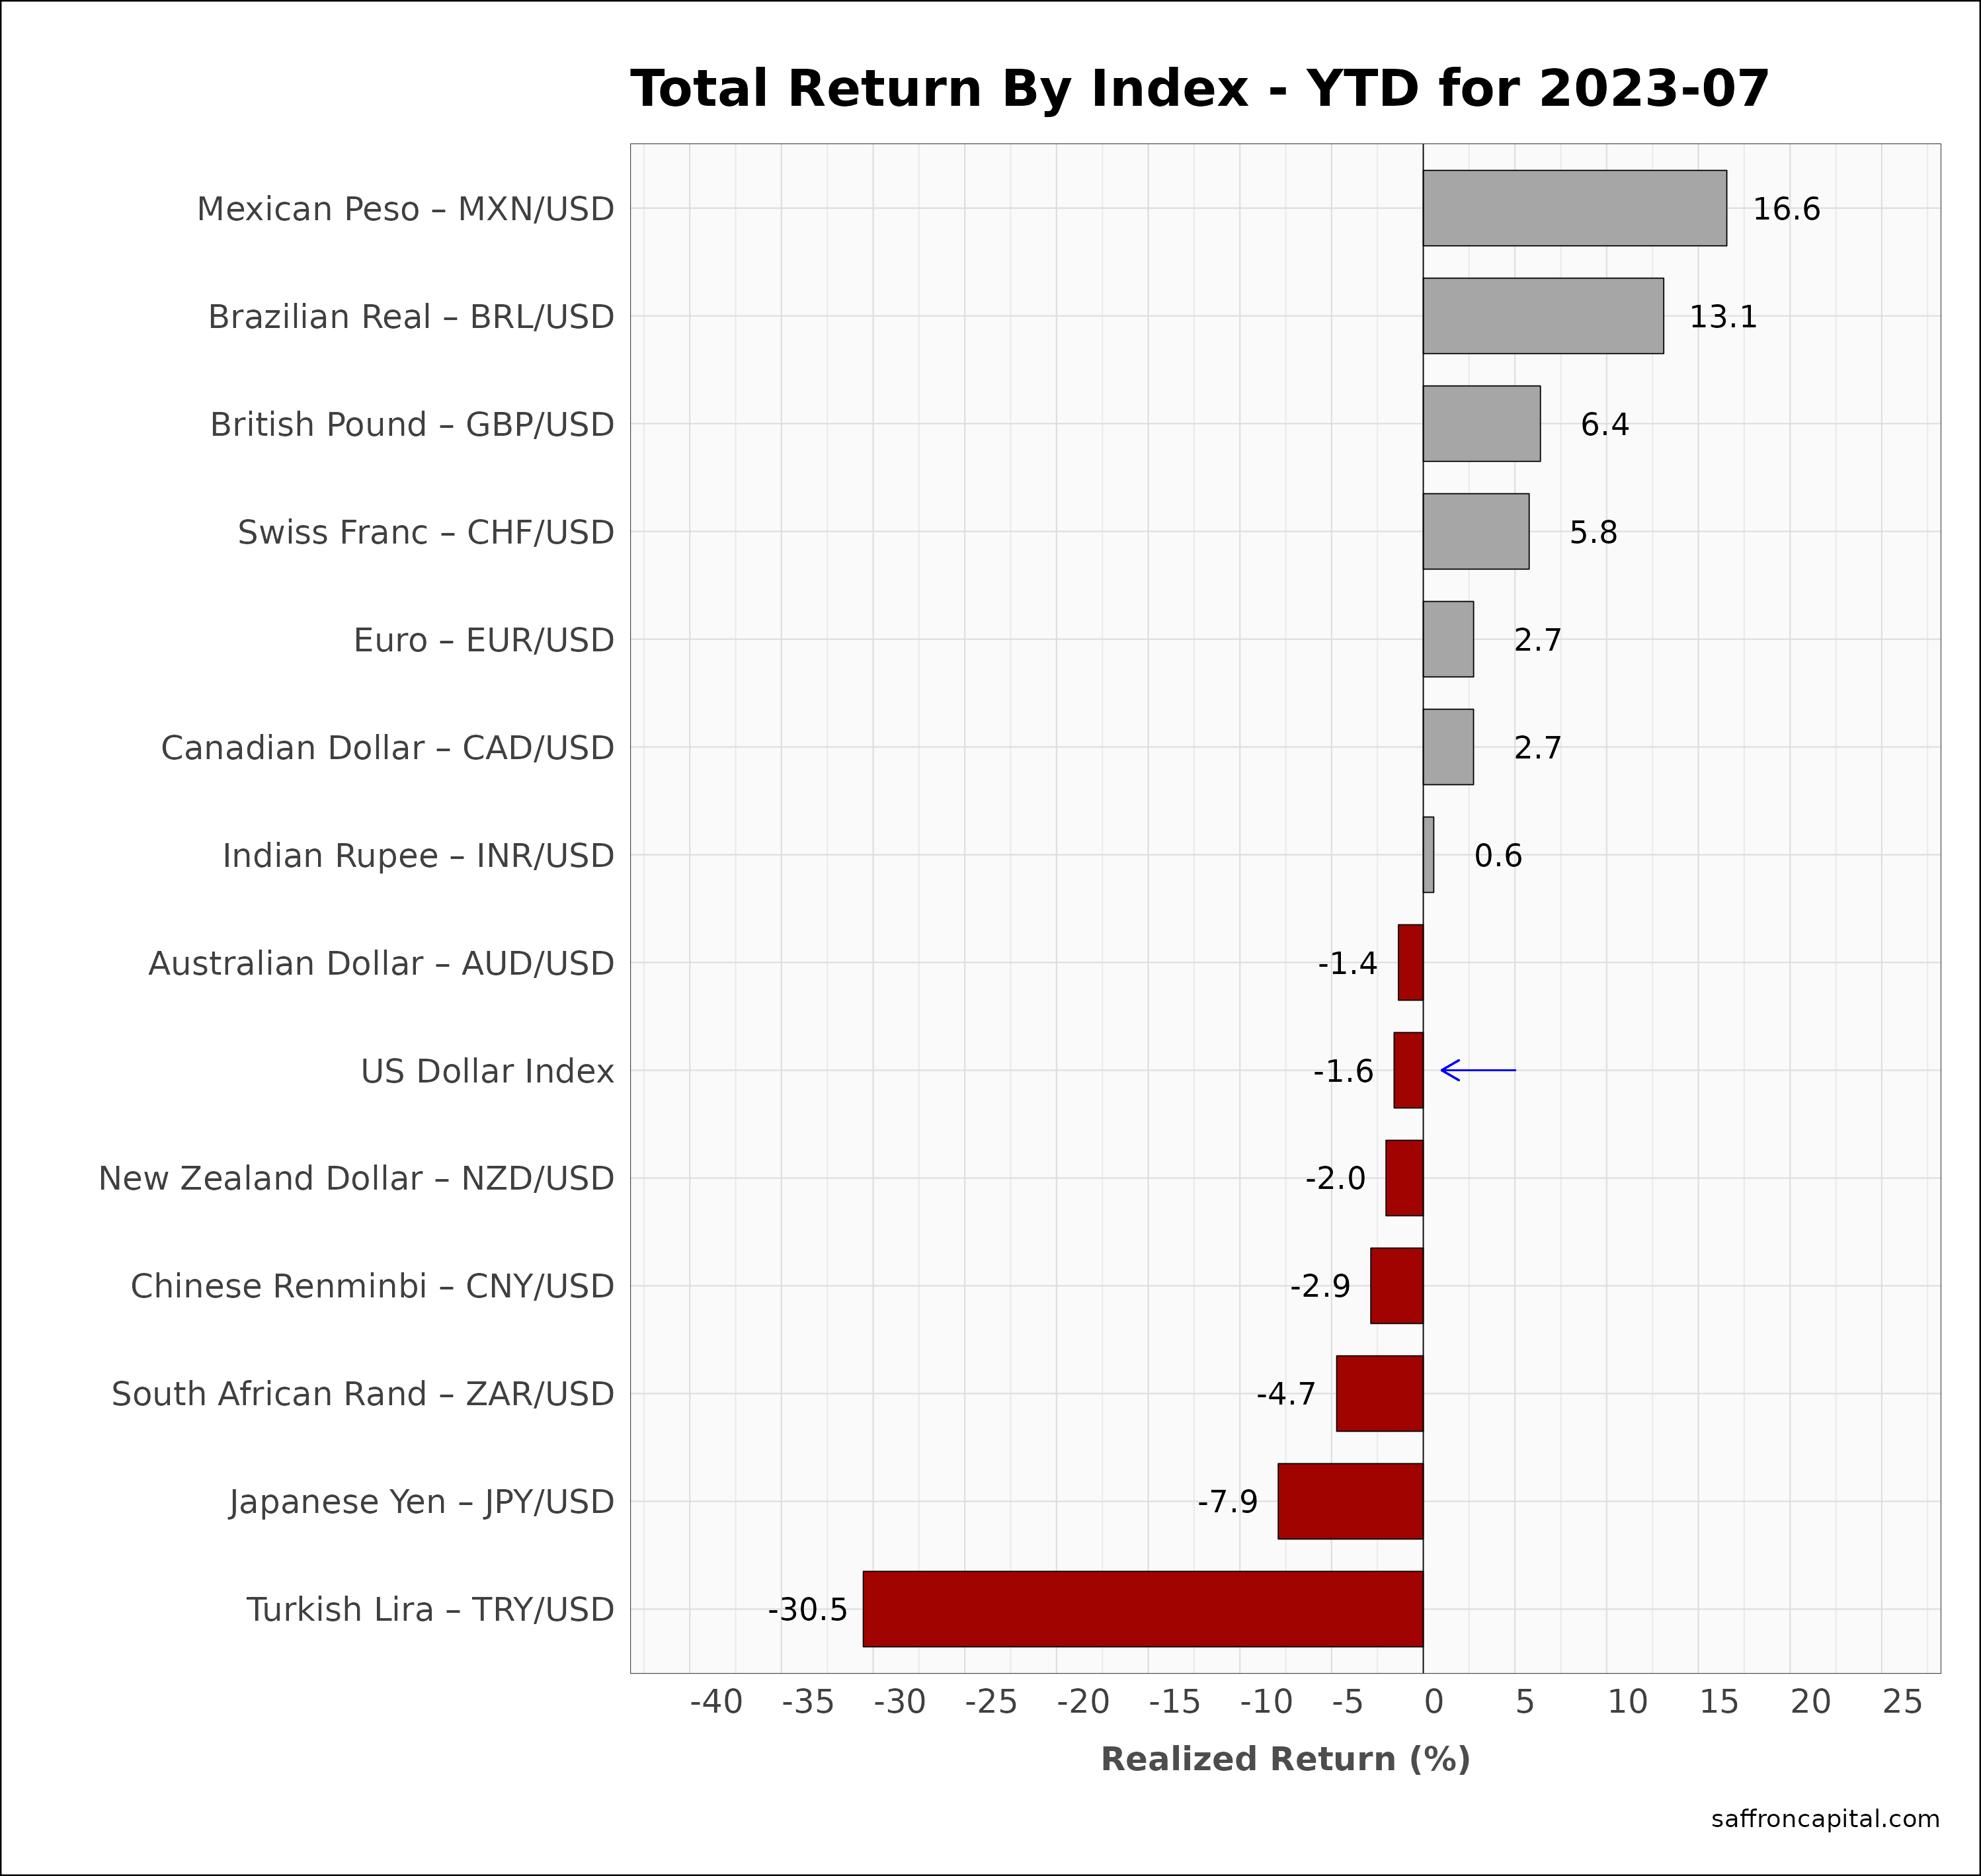
Currencies
The US Dollar (-0.9%) continued to exhibit weakness, as first seen in June, allowing many currencies to increase. Since January, the dollar (-1.6%) is down and the strongest currencies are the Mexican Peso (+16.6%), the Brazilian Real (+13.1%) and the British Pound (+6.4%). The wekest currencies since January include the Turkish Lira (-30.5%) and the Yen (-7.9%).
Click to enlarge
Have questions or concerns about the performance of your portfolio? Looking for improved performance at a lower cost? Whatever your needs are, we are here to listen and to help. You can schedule time with us here.


